Pushgateway允许短暂和批量作业将其指标暴露给 Prometheus。由于这些工作的生命周期可能不足够长,不能够存在足够的时间以让 Prometheus 抓取它们的指标。Pushgateway 允许它们可以将其指标推送到 Pushgateway,然后 Pushgateway 再将这些指标暴露给 Prometheus 抓取。
盲目的使用Pushgateway来代替Prometheus常用的拉动模型(pull model)来收集指标,会有以下几种问题:
1.通过单个 Pushgateway 监控多个实例时, Pushgateway 将会成为单点故障和潜在瓶颈
2.当你通过 up 命令(每次擦出时生成),将丢失 Prometheus 自动实例运行状态监控
3.Pushgateway 不会忘记推送时间序列并将永远暴露给 Prometheus,除非这些序列是通过 Pushgateway 的 API 手动删除的
1、下载pushgateway
下载地址:
https://github.com/prometheus/pushgateway/releases/download/v1.5.1/pushgateway-1.5.1.windows-amd64.zip
2、修改prometheus的配置
修改prometheus.yml,添加pushgateway的job
# my global config
global:scrape_interval: 15s # Set the scrape interval to every 15 seconds. Default is every 1 minute.evaluation_interval: 15s # Evaluate rules every 15 seconds. The default is every 1 minute.# scrape_timeout is set to the global default (10s).# Alertmanager configuration
alerting:alertmanagers:- static_configs:- targets:# - alertmanager:9093# Load rules once and periodically evaluate them according to the global 'evaluation_interval'.
rule_files:# - "first_rules.yml"# - "second_rules.yml"# A scrape configuration containing exactly one endpoint to scrape:
# Here it's Prometheus itself.
scrape_configs:# The job name is added as a label `job=<job_name>` to any timeseries scraped from this config.- job_name: "prometheus"# metrics_path defaults to '/metrics'# scheme defaults to 'http'.static_configs:- targets: ["localhost:9090"]#  - job_name: "station"
#    metrics_path: /prometheus
#    static_configs:
#      - targets: ["localhost:14501"]- job_name: "pushgateway"honor_labels: truestatic_configs:- targets: ["localhost:9091"]labels:instance: pushgateway
3、启动pushgateway
解压pushgateway
点击pushgateway.exe运行
4、测试推送数据到pushgateway(java)
引入依赖
<dependencies><dependency><groupId>org.springframework.boot</groupId><artifactId>spring-boot-starter-web</artifactId></dependency><dependency><groupId>org.springframework.boot</groupId><artifactId>spring-boot-starter-actuator</artifactId></dependency><dependency><groupId>io.micrometer</groupId><artifactId>micrometer-registry-prometheus</artifactId></dependency><dependency><groupId>io.prometheus</groupId><artifactId>simpleclient_pushgateway</artifactId><version>0.16.0</version></dependency></dependencies>
@Autowired
private CollectorRegistry collectorRegistry;PushGateway pushGateway= new PushGateway("http://localhost:9091");
Guage stationSystemCpuTotal = Gauge.build().name("cpu_total").help("Number of CPU cores on the station.").unit("C").labelNames("a","b").register(collectorRegistry);
stationSystemCpuTotal.labels("A", "B").set(10);
Map<String, String> groupingKey = new HashMap<>() {{put("collector_name", "cpu");}};
pushGateway.pushAdd(stationSystemCpuTotal , "test-job", groupingKey);
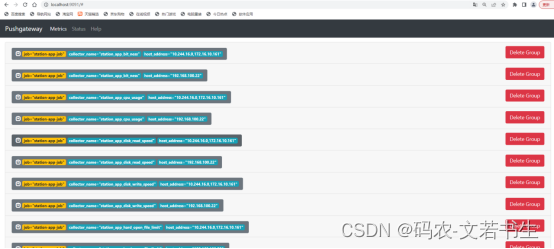
5、查看pushgatway
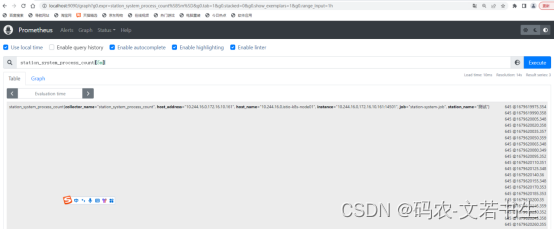
6、查看Prometheus