目录
- KDTree(K-Dimensional Tree)原理
- 步骤
- 空间索引建立例子[^1]
- 回溯搜索例子[^2]
- 相关包
- 案例[^3]
- 数据
- KDTree 识别轨道衔接出行
- 轨道衔接单车骑行范围分析
- 结果保存
KDTree(K-Dimensional Tree)原理
将需要匹配的 K 维空间点建立 K 维树空间索引,在近邻匹配时,输入的点在树中快速检索,即可找到最近邻的点。
在建立空间索引二维树时,算法复杂度介于 O ( l o g 2 n ) O(log_2n) O(log2n)和 O ( n ) O(n) O(n)之间。
- 最好的情况下,每次插入点能均匀分割剩余点,算法复杂度为 O ( l o g 2 n ) O(log_2n) O(log2n)
- 最坏的情况下,每次插入点其余点都在一个字空间中,树的深度为n,算法复杂度为 O ( n ) O(n) O(n)
步骤
- 空间索引建立
- 给定或选择中心节点
- 依次从各维度分割
- 按照层次插入点,建立空间索引
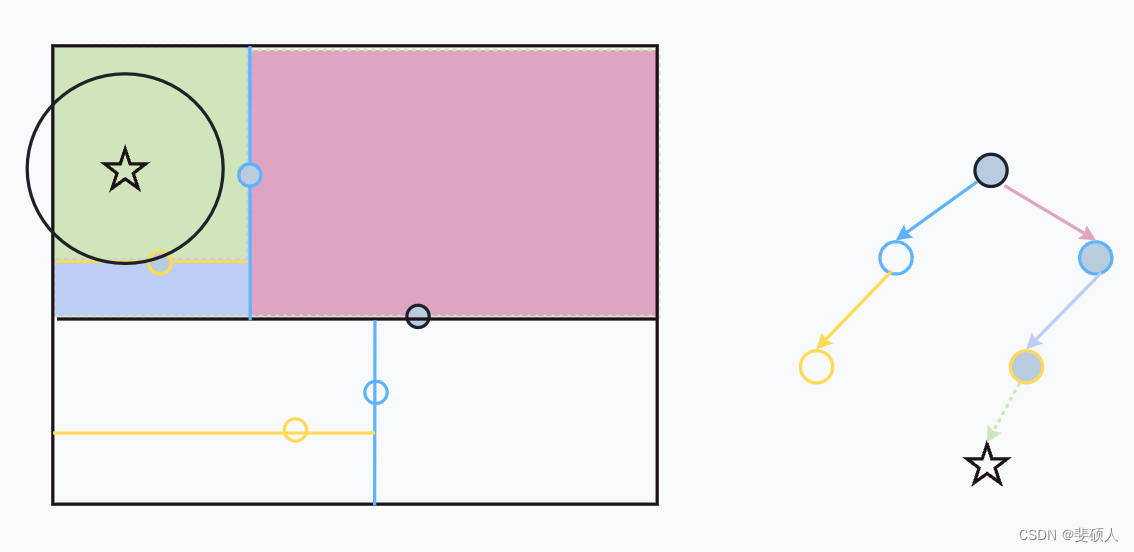
- 最近邻搜索
- 给定数据点,查询与其距离最近的点
- 从根节点开始依次向下搜索,进行深度优先遍历(二分搜索),直到
与待查询点处于同一子空间的叶子结点 - 回溯搜索路径、判断路径上其它子节点空间中,是否可能有距离更近的点
- 如过有可能,跳转到其他子空间去搜索,将其他子节点加入搜索路径
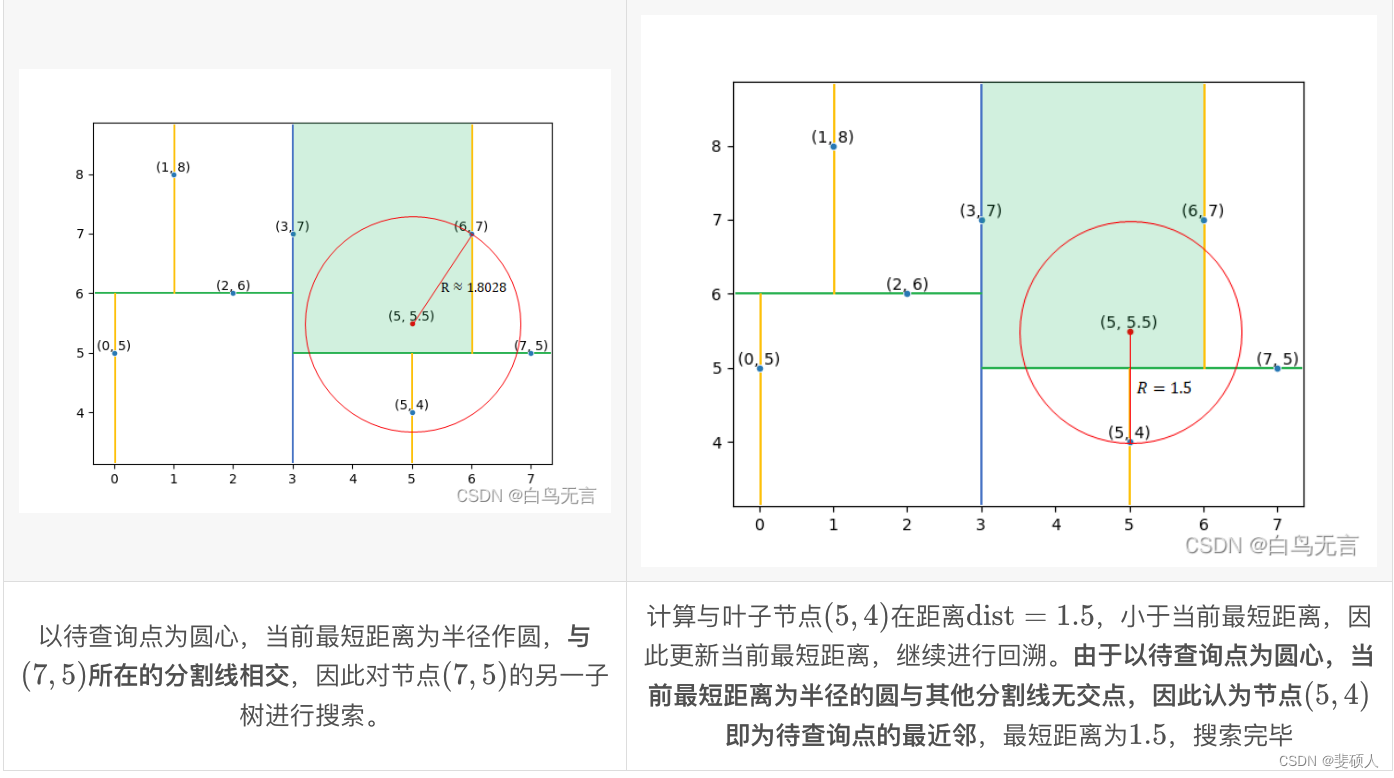
- 以
待查询点为圆心,以待查询点到叶子结点的距离为半径作圆,如果不相交则不必去其他字空间搜索
- 重复过程,直到搜索路径为空
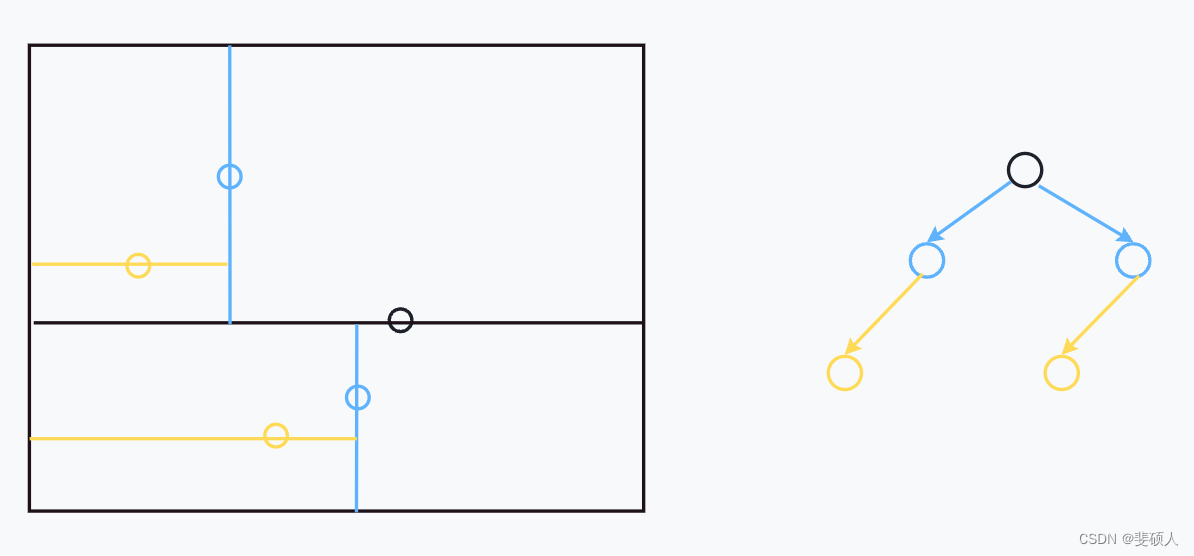
空间索引建立例子1
- 二维样例:{(2,3),(5,4),(9,6),(4,7),(8,1),(7,2)}
- 根据x轴中位数,选择中心点为(7,2)
- 首先在 x 轴维度上,比较其余点和中心点的大小,划分双支
- 左支:{(2,3),(5,4),(4,7)}
- 右支:{(9,6),(8,1)}
- 更新分割轴y轴
- 确定子节点
- 左节点
- 在左支中找到y轴的中位数(5,4)
- 左支数据更新为{(2,3)},右支数据更新为{(4,7)}
- 右节点
- 在右支中找到y轴的中位数(9,6)
- 左支数据更新为{(8,1)},右支数据为null。
- 左节点
- 更新分割轴x轴
- 确定(5,4)的子节点
- 左节点:由于只有一个数据,所以,左节点为(2,3)
- 右节点:由于只有一个数据,所以,右节点为(4,7)
- 确定(9,6)的子节点
- 确定(5,4)的子节点
回溯搜索例子2
相关包
sklearn、SciPy、TransBigData、BioPython 中都提供了 KDTree 相关算法接口
-
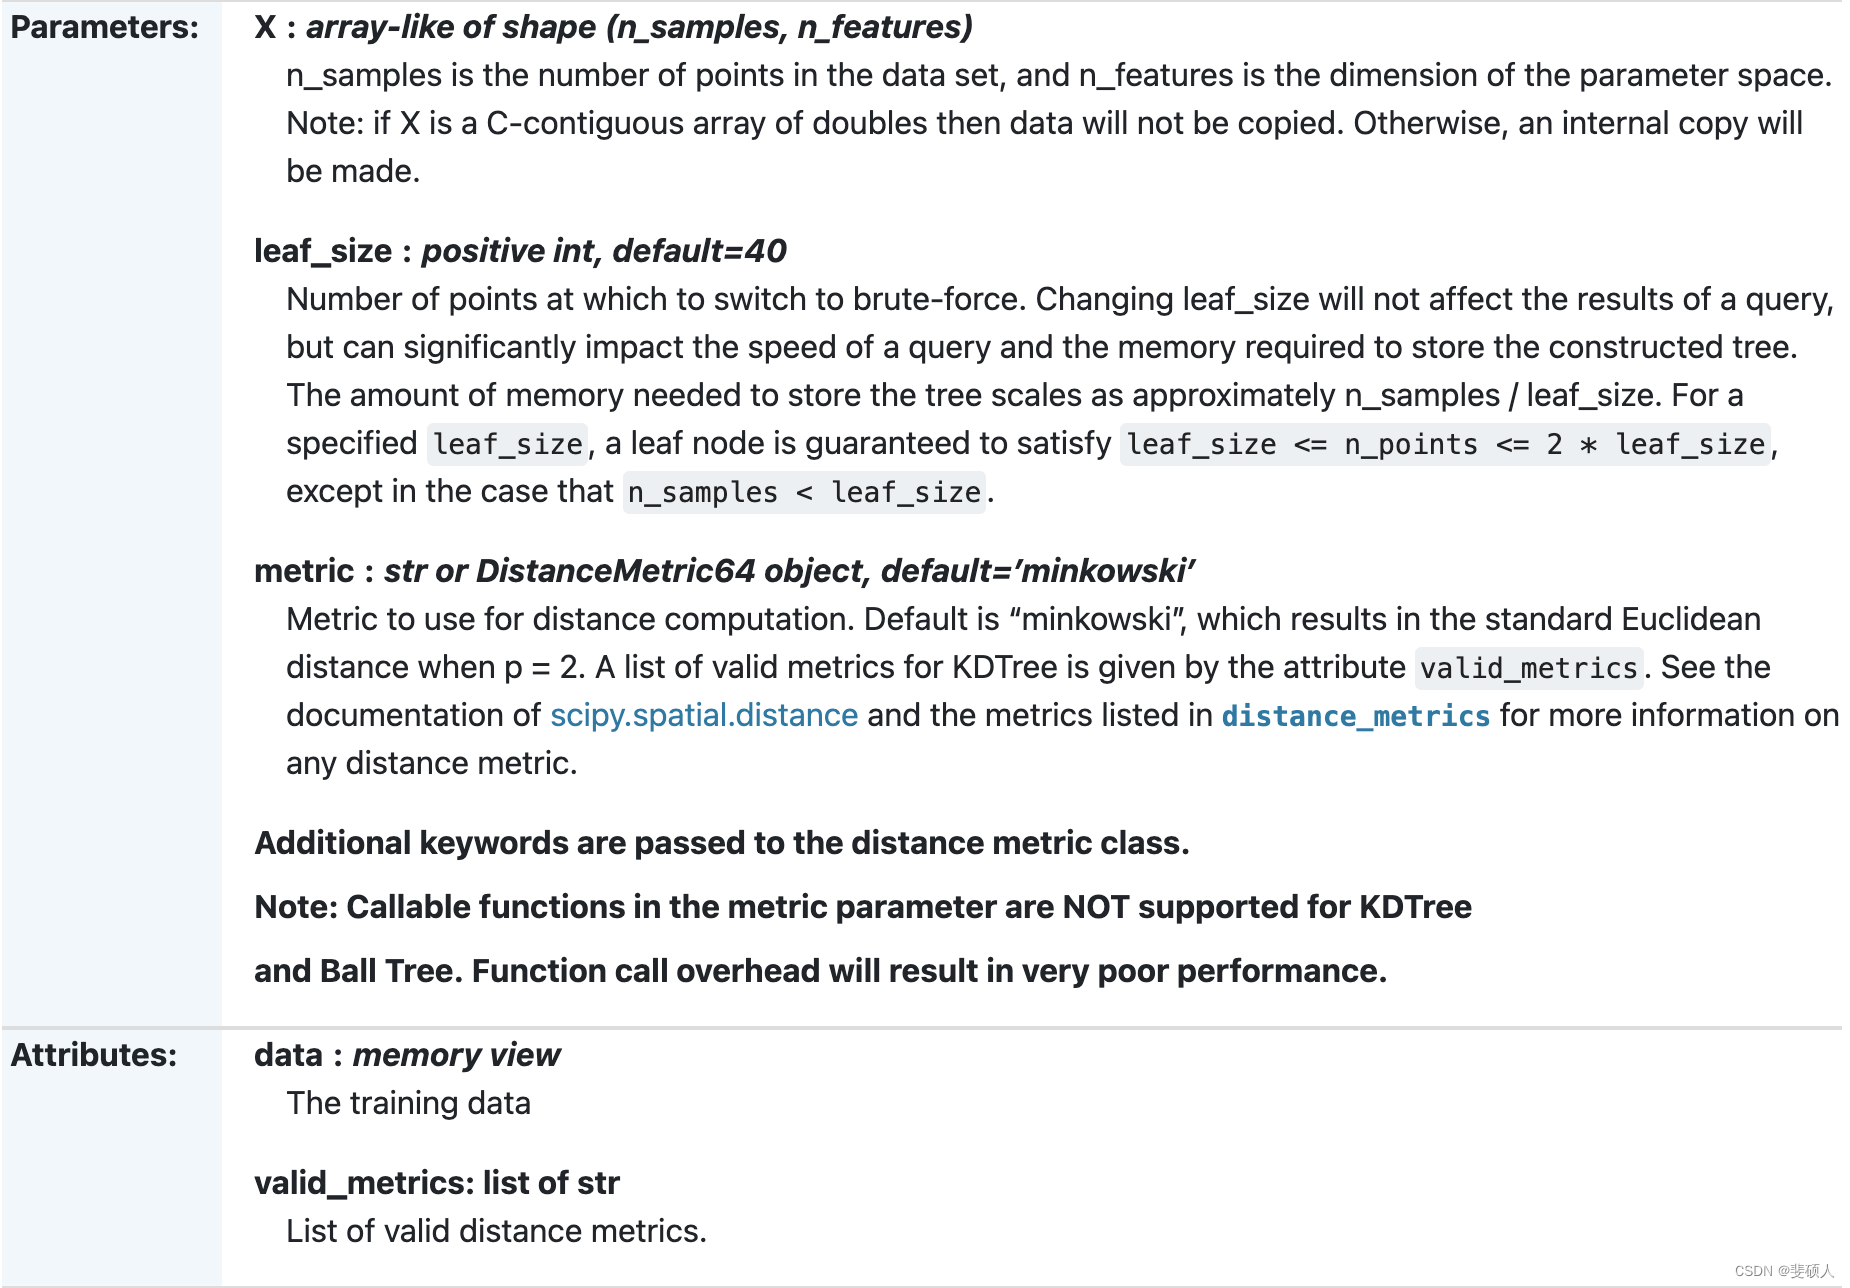
class sklearn.neighbors.KDTree(X, leaf_size=40, metric=‘minkowski’, **kwargs)
-
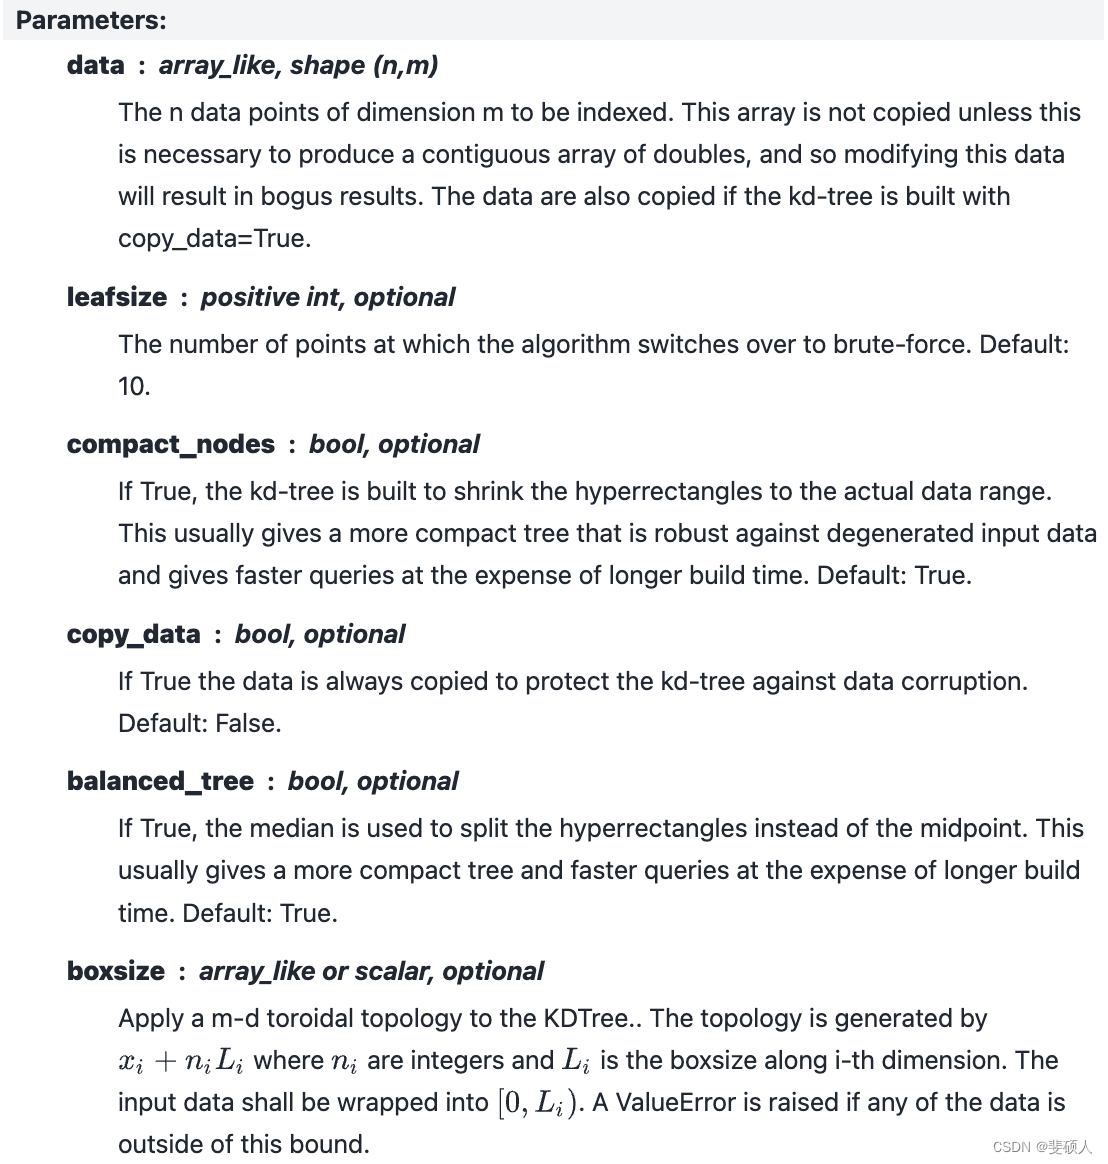
class scipy.spatial.KDTree(data, leafsize=10, compact_nodes=True, copy_data=False, balanced_tree=True, boxsize=None)
-
transbigdata.ckdnearest(dfA_origin, dfB_origin, Aname=[‘lon’, ‘lat’], Bname=[‘lon’, ‘lat’])
-
classBio.KDTree.KDTree.KDTree(dim, bucket_size=1)
案例3
数据
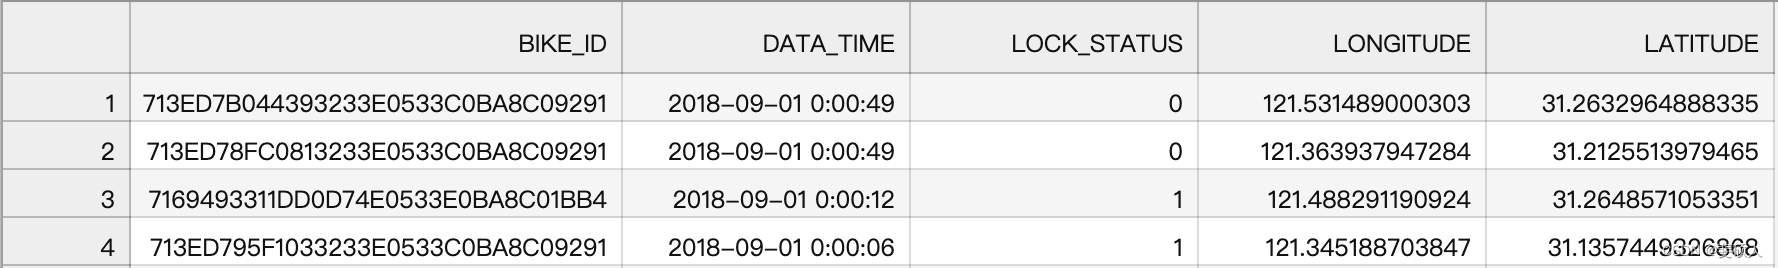
共享单车数据
| BIKE_ID | DATA_TIME | LOCK_STATUS | LONGITUDE | LATITUDE |
|---|---|---|---|---|
| 单车ID | 数据采集时间 | 单车开关锁状态 | GPS经度 | GPS维度 |
metro_station.csv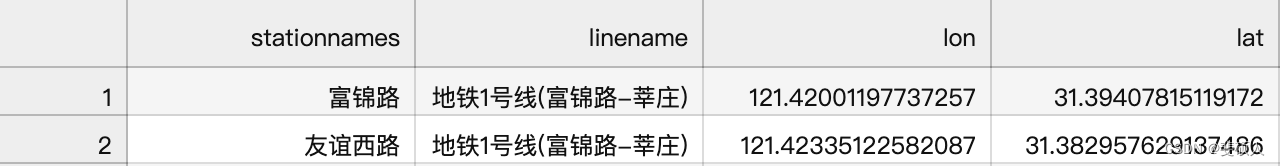
KDTree 识别轨道衔接出行
python">#定义函数,用cKDTree匹配点与点,点与线
import numpy as np
from scipy.spatial import cKDTree
import itertools
from operator import itemgetter
#定义KDTree的函数
def ckdnearest(dfA_origin,dfB_origin,Aname = ['slon','slat'],Bname = ['lon','lat']):gdA = dfA_origin.copy()gdB = dfB_origin.copy()from scipy.spatial import cKDTree#为gdB表的点建立KDTreebtree = cKDTree(gdB[Bname].values)#在gdB的KDTree中查询gdA的点,dist为距离,idx为gdB中离gdA最近的坐标点dist,idx = btree.query(gdA[Aname].values,k = 1)#构建匹配的结果gdA['dist'] = distgdA['index'] = idxgdB['index'] = range(len(gdB))gdf = pd.merge(gdA,gdB,on = 'index')#计算import CoordinatesConvertergdf['dist'] = CoordinatesConverter.getdistance(gdf[Aname[0]],gdf[Aname[1]],gdf[Bname[0]],gdf[Bname[1]])return gdf#读取轨道站点数据
metro_station = pd.read_csv(r'data/metro_station.csv')
metro_station = metro_station.drop_duplicates(subset= 'stationnames')
metro_station = metro_station[['stationnames','lon','lat']]#匹配起点最近的地铁站
metro_station.columns = ['o_station','o_lon','o_lat']
data_move_metro = ckdnearest(data_move_cleaned,metro_station,Aname = ['slon','slat'],Bname = ['o_lon','o_lat'])
data_move_metro = data_move_metro.rename(columns = {'dist':'o_dist'})#匹配终点最近的地铁站
metro_station.columns = ['d_station','d_lon','d_lat']
data_move_metro = ckdnearest(data_move_metro,metro_station,Aname = ['elon','elat'],Bname = ['d_lon','d_lat'])
data_move_metro = data_move_metro.rename(columns = {'dist':'d_dist'})
data_move_metro.iloc[:2].T    #筛选距离地铁站100米范围内的出行数据
data_move_metro = data_move_metro[(data_move_metro['o_dist']<100)|(data_move_metro['d_dist']<100)]
data_move_metro.iloc[:2].T
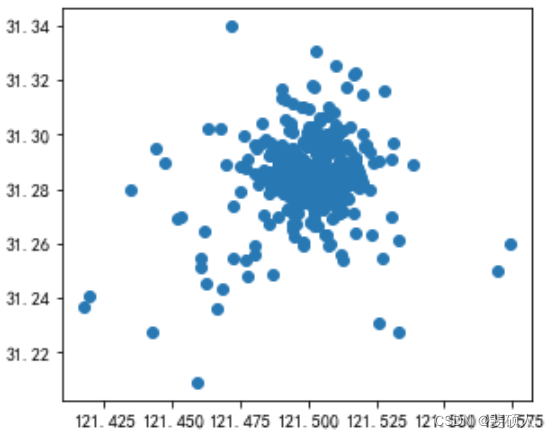
轨道衔接单车骑行范围分析
python">#选取某站点
station = '同济大学'
#提取地铁站衔接出行的另一端点分布
tmp1 = data_move_metro[(data_move_metro['o_station']==station)&(data_move_metro['o_dist']<=100)][['elon','elat']]
tmp2 = data_move_metro[(data_move_metro['d_station']==station)&(data_move_metro['d_dist']<=100)][['slon','slat']]
tmp1.columns = ['lon','lat']
tmp2.columns = ['lon','lat']
points = pd.concat([tmp1,tmp2])#转换为GeoDataFrame
points = geopandas.GeoDataFrame(points)
points['geometry'] = geopandas.points_from_xy(points['lon'],points['lat'])points.plot()
python">#读取轨道站点数据
metro_station = pd.read_csv(r'data/metro_station.csv')
metro_station = metro_station.drop_duplicates(subset= 'stationnames')
#提取这个站点的记录
thisstop = metro_station[metro_station['stationnames']==station]
thisstop = geopandas.GeoDataFrame(thisstop)
thisstop['geometry'] = geopandas.points_from_xy(thisstop['lon'],thisstop['lat'])
thisstop
| stationnames | linename | lon | lat | geometry |
|---|---|---|---|---|
| 同济大学 | 地铁10号线(新江湾城-虹桥火车站) | 121.502067 | 31.284578 | POINT (121.50207 31.28458) |
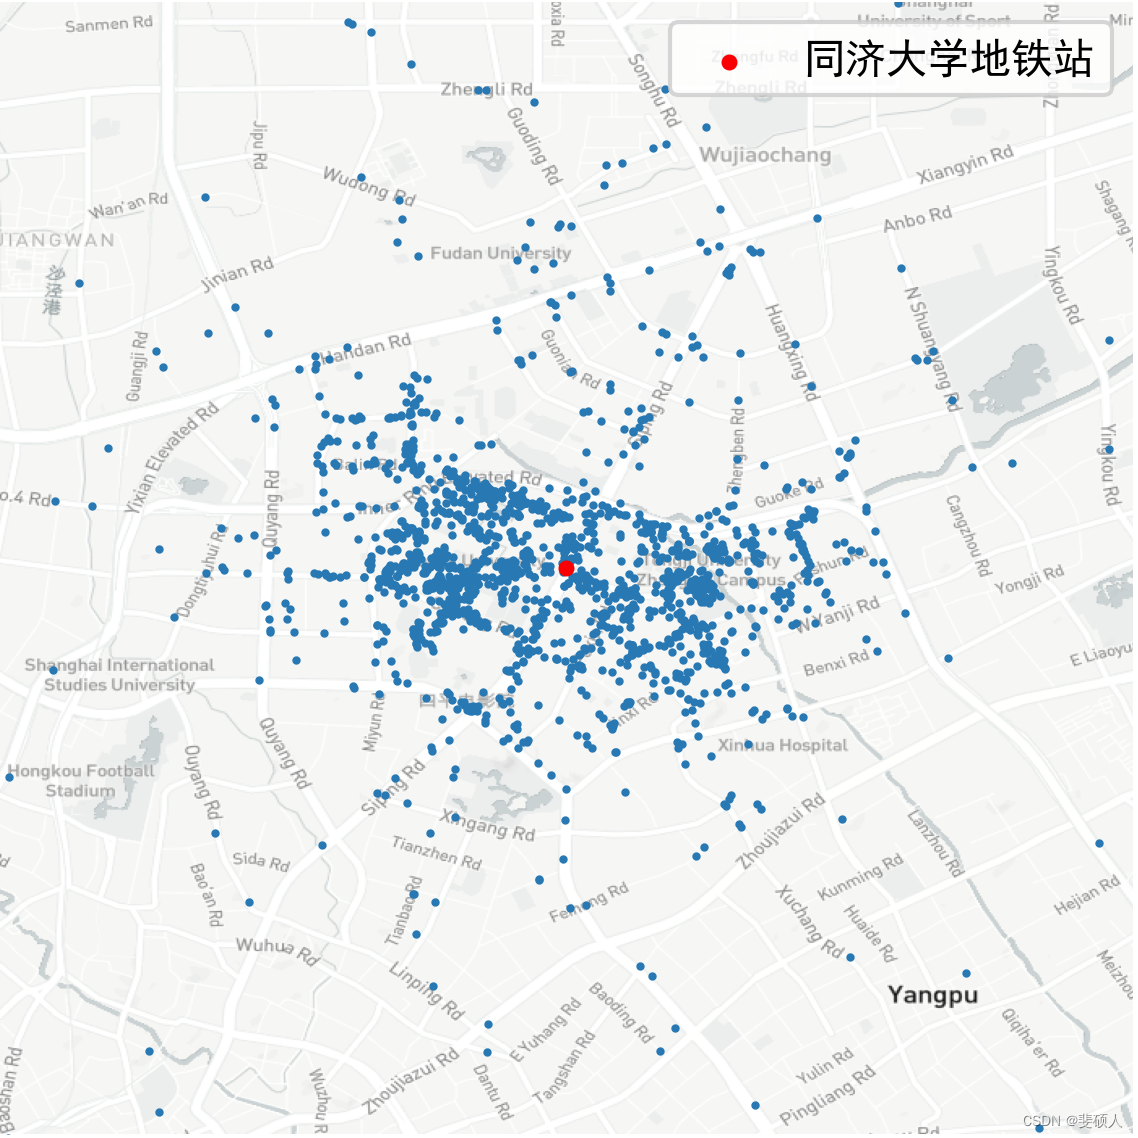
python">#取得这个站点的位置
lon_thisstop = thisstop['lon'].iloc[0]
lat_thisstop = thisstop['lat'].iloc[0]
#确定显示范围
bounds = [lon_thisstop-0.03,lat_thisstop-0.03,lon_thisstop+0.03,lat_thisstop+0.03]import matplotlib.pyplot as plt
fig = plt.figure(1,(6,5),dpi = 300)
ax = plt.subplot(111)
plt.sca(ax)
#加载底图
import transbigdata as tbd
#绘制底图
tbd.plot_map(plt,bounds,zoom = 14,style = 4)
points.plot(ax = ax,markersize = 1)
#标注地铁站点
thisstop.plot(ax = ax,c = 'red',markersize = 8,zorder = 2,label = station+'地铁站')
plt.legend()
#设置显示范围
plt.axis('off')
ax.set_xlim(bounds[0],bounds[2])
ax.set_ylim(bounds[1],bounds[3])
plt.show()
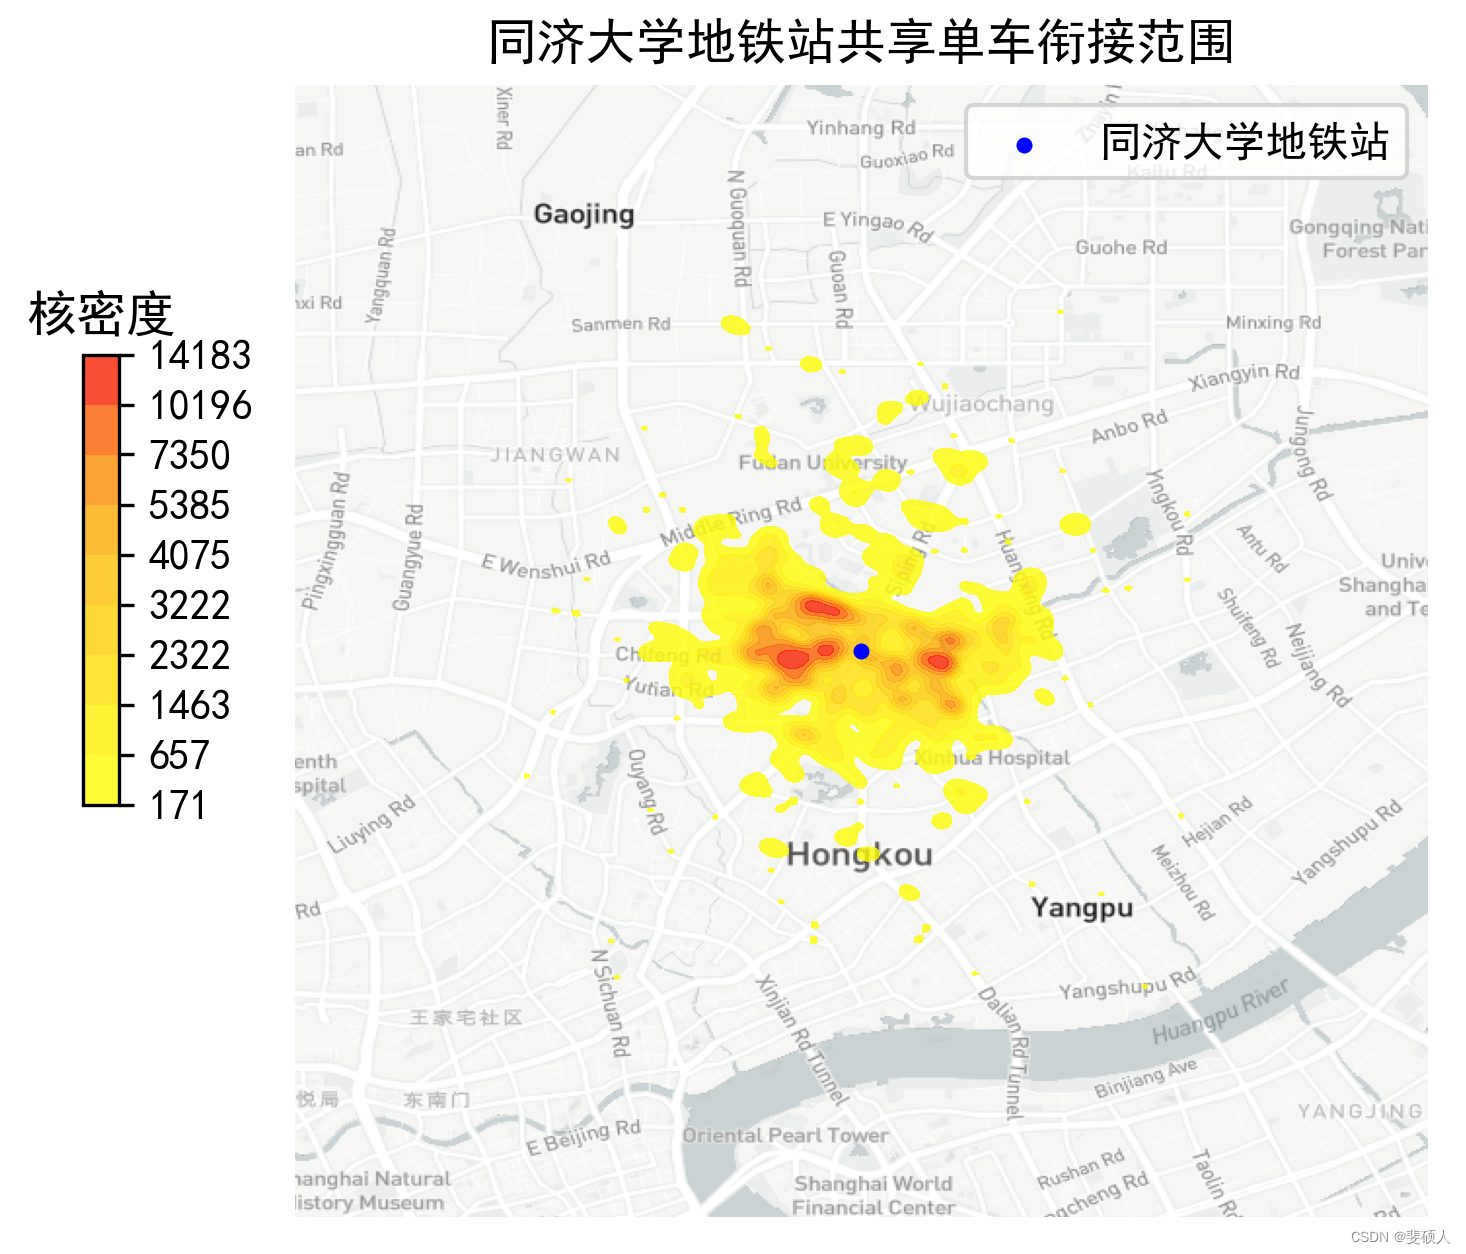
python">#剔除距离过远的点,否则核密度估计可能会出错
points = points[(points['lon']>bounds[0])&
(points['lat']>bounds[1])&
(points['lon']<bounds[2])&
(points['lat']<bounds[3])]import matplotlib.pyplot as plt
fig = plt.figure(1,(6,5),dpi = 300)
ax = plt.subplot(111)
plt.sca(ax)
#加载底图
import transbigdata as tbd
bounds = [lon_thisstop-0.05,lat_thisstop-0.05,lon_thisstop+0.05,lat_thisstop+0.05]
#绘制底图
tbd.plot_map(plt,bounds,zoom = 13,style = 4)
#标注地铁站点
thisstop.plot(ax = ax,c = 'blue',markersize = 8,zorder = 2,label = station+'地铁站')
plt.legend()
#设置显示范围
plt.axis('off')
ax.set_xlim(bounds[0],bounds[2])
ax.set_ylim(bounds[1],bounds[3])
plt.title(station+'地铁站共享单车衔接范围')
#设置色标
import matplotlib
cmapname = 'autumn_r'
cmap = matplotlib.cm.get_cmap(cmapname)
cax = plt.axes([0.08, 0.4, 0.02, 0.3])
#色标的标题
plt.title('核密度')
import seaborn as sns
#绘制二维核密度图
sns.kdeplot(points['lon'],points['lat'],#指定x与y坐标所在的列data = points,alpha = 0.8,#透明度gridsize = 180, #绘图精细度,越高越慢bw = 0.1,    #高斯核大小(经纬度),越小越精细cmap = cmap, #定义colormapax = ax, #指定绘图位置shade=True, #等高线间是否填充颜色shade_lowest=False,#最底层不显示颜色cbar=True, #显示colorbarcbar_ax=cax,#指定colorbar位置zorder = 1 #控制绘图顺序,使其不会挡住地铁站点)
plt.show()
结果保存
python">points[['lon','lat']].to_csv(r'data/bicycle_connection_points.csv',index = None)
bicycle_connection_points.csv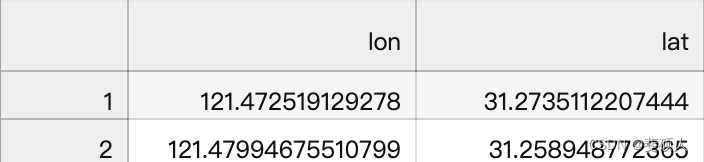
KD-Tree原理详解 ↩︎
KD-Tree详解: 从原理到编程实现 ↩︎
《交通时空大数据分析、挖掘与可视化(Python版)》 ↩︎

![[Linux] GDB使用指南----包含CentOS7下安装以及使用](https://img-blog.csdnimg.cn/direct/867e28a3dd5347d7a102f2f323e2c94c.png)