| 🎈🎈🎈Python实现Web图表功能系列:🎈🎈🎈 | |
|---|---|
| 1 | 🎈【Web开发】Python实现Web图表功能(D-Tale入门)🎈 |
| 2 | 🎈【Web开发】Python实现Web图表功能(D-Tale编译)🎈 |
| 3 | 🎈【Web开发】Python实现Web图表功能(pyecharts,Flask)🎈 |
| 4 | 🎈【Web开发】Python实现Web图表功能(ECharts.js,Flask)🎈 |
| 5 | 🎈【Web开发】Node实现Web图表功能(ECharts.js,Vue)🎈 |
| 6 | 🎈【Web开发】Node实现Web图表功能(ECharts.js,React)🎈 |
| 7 | 🎈【Web开发】Python实现Web图表功能(Grafana入门)🎈 |
文章目录
- 1、简介
- 2、安装
- 2.1 从 GitHub 获取
- 2.2 从 npm 获取
- 2.3 从 CDN 获取
- 2.4 在线定制
- 2.5 离线文件
- 3、Flask + echarts.js(入门例子)
- 3.1 直接渲染
- 3.2 模板渲染
- 4、Flask + echarts.js(jQuery例子)
- 4.1 异步请求jQuery.js($.ajax)
- 4.2 异步请求jQuery.js($.get)
- 4.3 异步请求jQuery.js($.post)
- 5、Flask + echarts.js(axios例子)
- 5.1 异步请求axios.js(axios.get)
- 5.2 异步请求axios.js(axios.post)
- 6、Flask + echarts.js(fetch例子)
- 6.1 异步请求fetch(fetch+get)
- 6.2 异步请求fetch(fetch+post)
- 结语
1、简介
官网地址:
https://echarts.apache.org/zh/index.html
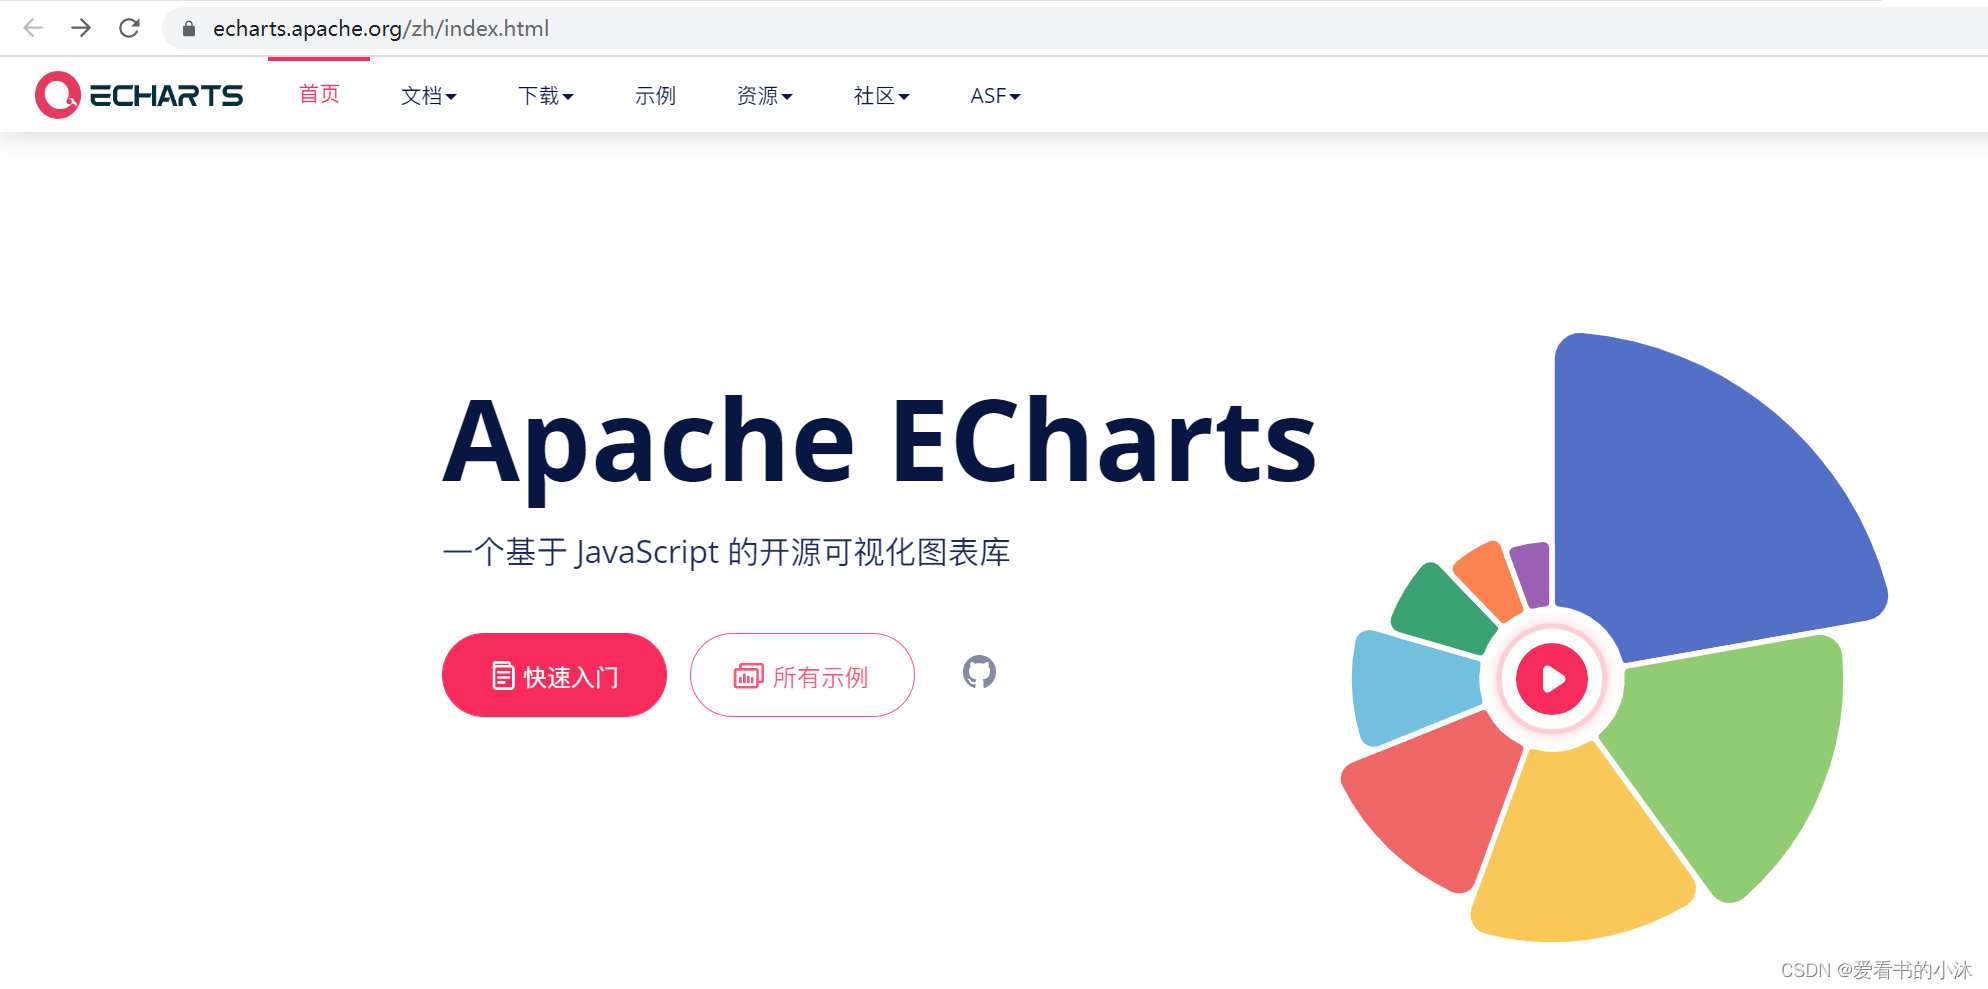
ECharts,一个使用 JavaScript 实现的开源可视化库,可以流畅的运行在 PC 和移动设备上,兼容当前绝大部分浏览器(IE9/10/11,Chrome,Firefox,Safari等),底层依赖矢量图形库 ZRender,提供直观,交互丰富,可高度个性化定制的数据可视化图表。

- 可视化类型
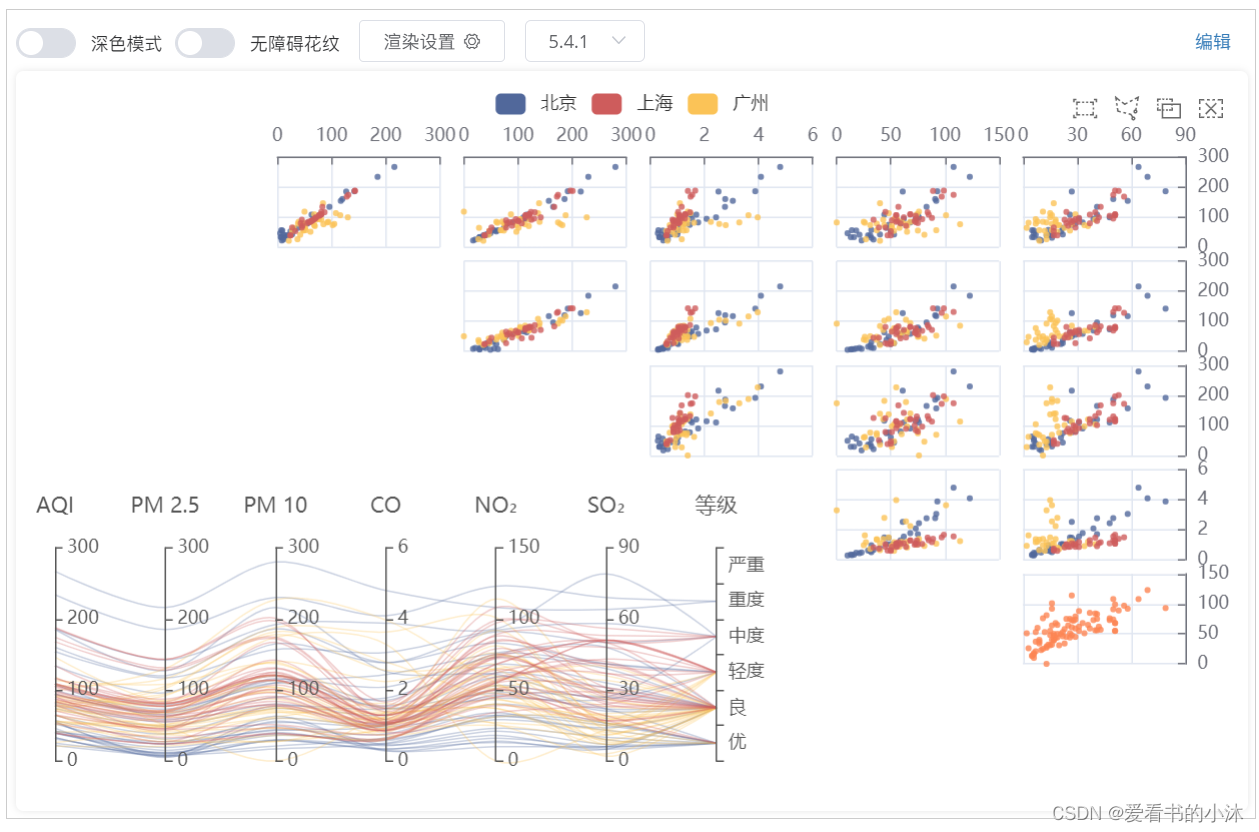
ECharts 提供了常规的折线图、柱状图、散点图、饼图、K线图,用于统计的盒形图,用于地理数据可视化的地图、热力图、线图,用于关系数据可视化的关系图、treemap、旭日图,多维数据可视化的平行坐标,还有用于 BI 的漏斗图,仪表盘,并且支持图与图之间的混搭。
除了已经内置的包含了丰富功能的图表,ECharts 还提供了自定义系列,只需要传入一个renderItem函数,就可以从数据映射到任何你想要的图形,更棒的是这些都还能和已有的交互组件结合使用而不需要操心其它事情。
- 数据格式
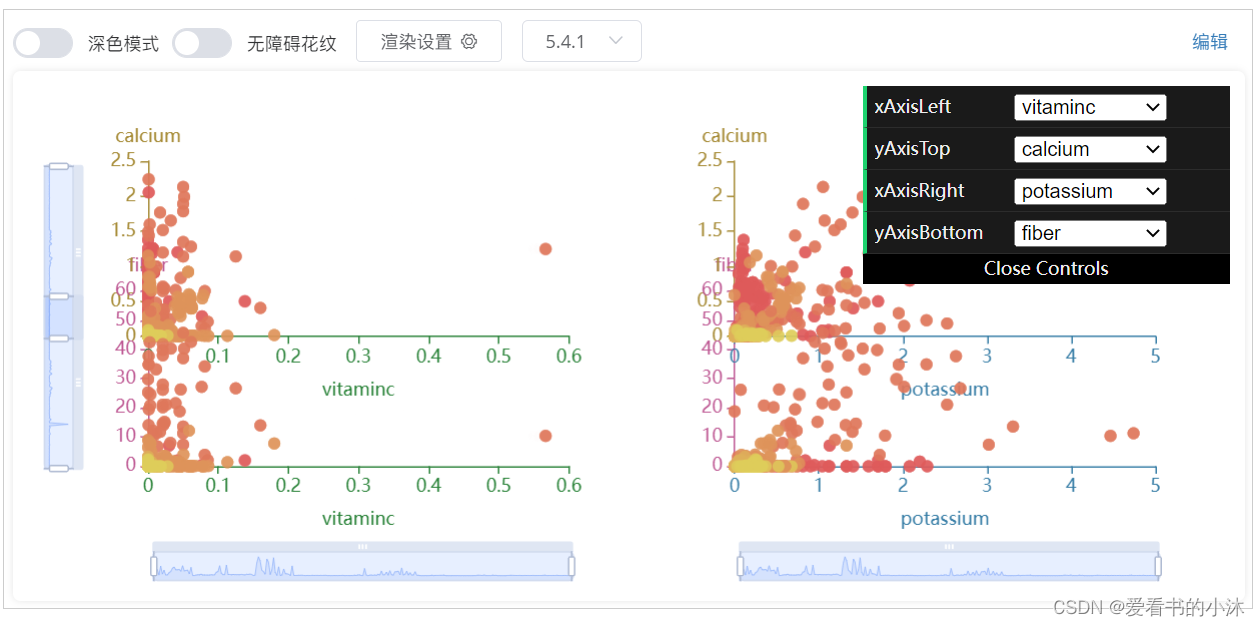
ECharts 内置的 dataset 属性(4.0+)支持直接传入包括二维表,key-value 等多种格式的数据源,通过简单的设置 encode 属性就可以完成从数据到图形的映射,这种方式更符合可视化的直觉,省去了大部分场景下数据转换的步骤,而且多个组件能够共享一份数据而不用克隆。
为了配合大数据量的展现,ECharts 还支持输入 TypedArray 格式的数据,TypedArray 在大数据量的存储中可以占用更少的内存,对 GC 友好等特性也可以大幅度提升可视化应用的性能。
- 动态数据
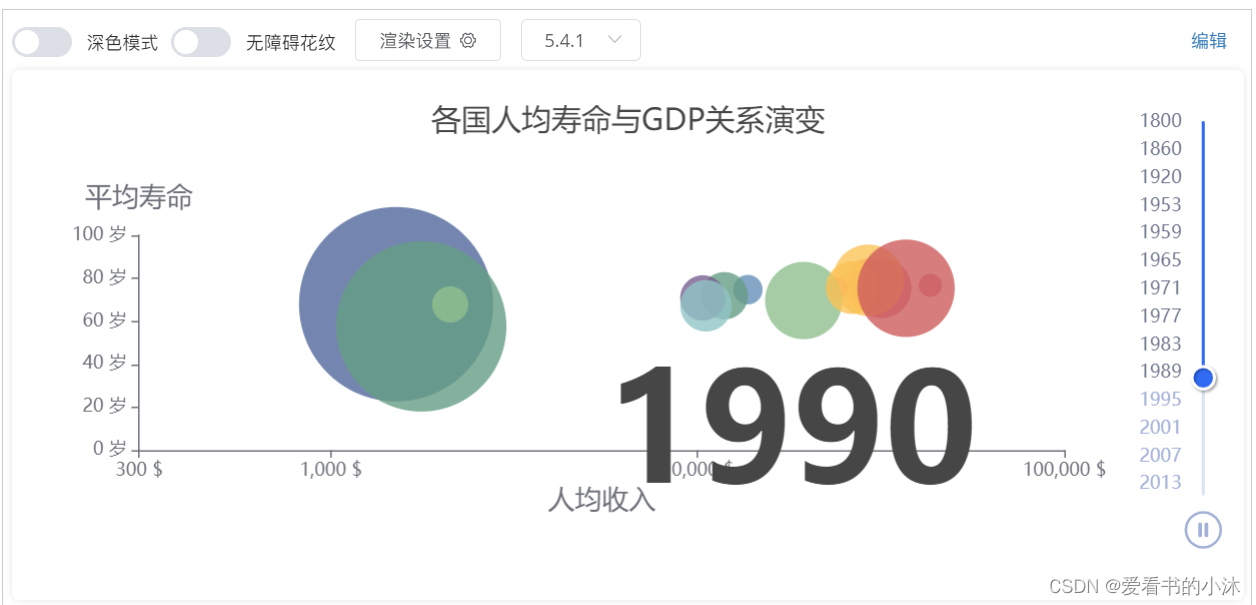
ECharts 由数据驱动,数据的改变驱动图表展现的改变。因此动态数据的实现也变得异常简单,只需要获取数据,填入数据,ECharts 会找到两组数据之间的差异然后通过合适的动画去表现数据的变化。配合 timeline 组件能够在更高的时间维度上去表现数据的信息。
- 前端展现
通过增量渲染技术(4.0+),配合各种细致的优化,ECharts 能够展现千万级的数据量,并且在这个数据量级依然能够进行流畅的缩放平移等交互。
几千万的地理坐标数据就算使用二进制存储也要占上百 MB 的空间。因此 ECharts 同时提供了对流加载(4.0+)的支持,你可以使用 WebSocket 或者对数据分块后加载,加载多少渲染多少!不需要漫长地等待所有数据加载完再进行绘制。

- 三维可视化
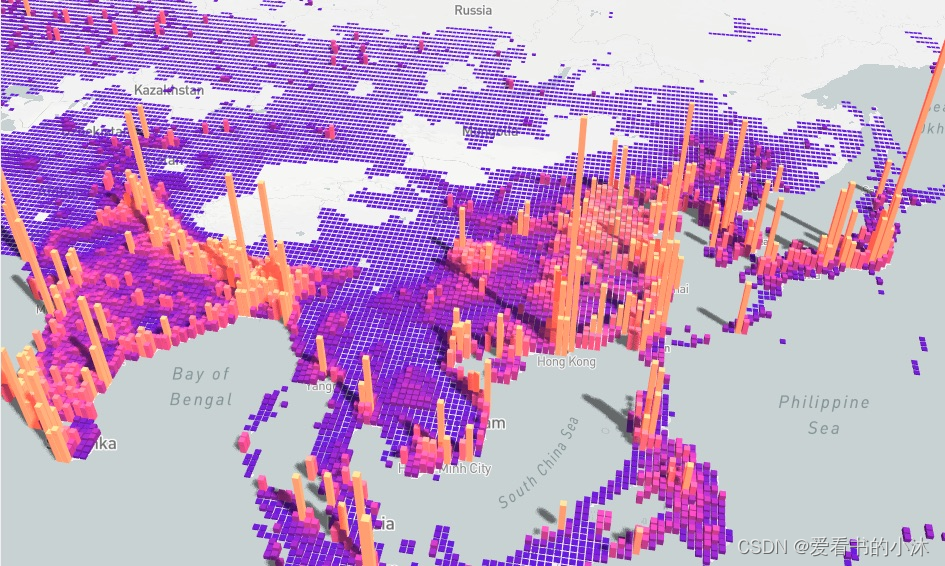
想要在 VR,大屏场景里实现三维的可视化效果?我们提供了基于 WebGL 的 ECharts GL,你可以跟使用 ECharts 普通组件一样轻松的使用 ECharts GL 绘制出三维的地球,建筑群,人口分布的柱状图,在这基础之上我们还提供了不同层级的画面配置项,几行配置就能得到艺术化的画面!
2、安装
Apache ECharts 提供了多种安装方式,你可以根据项目的实际情况选择以下任意一种方式安装。
- 从 GitHub 获取
- 从 npm 获取
- 从 CDN 获取
- 在线定制

2.1 从 GitHub 获取
https://github.com/apache/echarts/releases
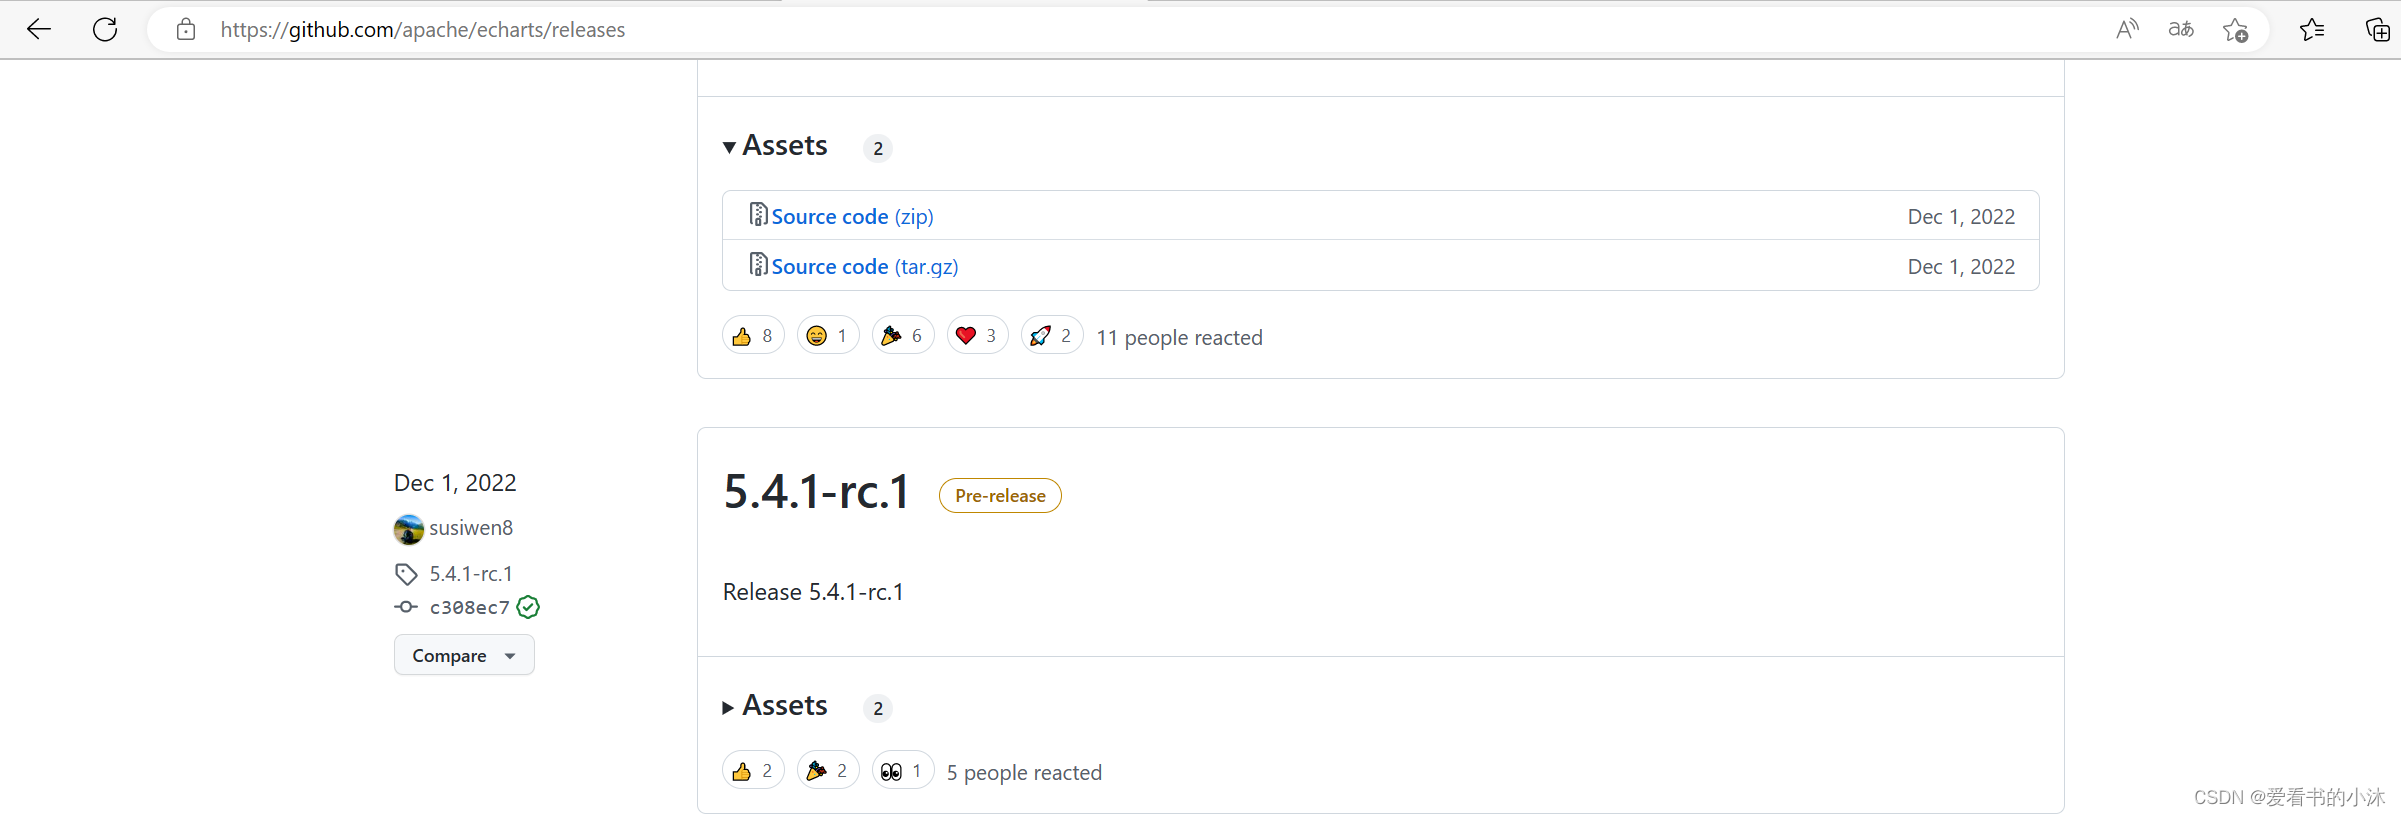
git clone https://github.com/apache/echarts.git
2.2 从 npm 获取
假如你的开发环境使用了 npm 或者 yarn 等包管理工具,并且使用 webpack 等打包工具进行构建,本文将会介绍如何引入 Apache EChartsTM 并通过 tree-shaking 特性只打包需要的模块以减少包体积。
npm install echarts
# or
npm install echarts --save
# or
npm install -g cnpm --registry=https://registry.npm.taobao.org
cnpm install echarts --save
–save 等同于-S,–save 会把依赖包名称添加到 package.json 文件 dependencies 下。
–save-dev 等同于 -D,–save-dev 则添加到 package.json 文件 devDependencies下。
dependencies是运行时的依赖,
devDependencies是开发时的依赖。
mkdir test_echarts
cd test_echarts
npm -v
npm init # or 全部采取默认方式命令: npm init -y
npm install echarts --save
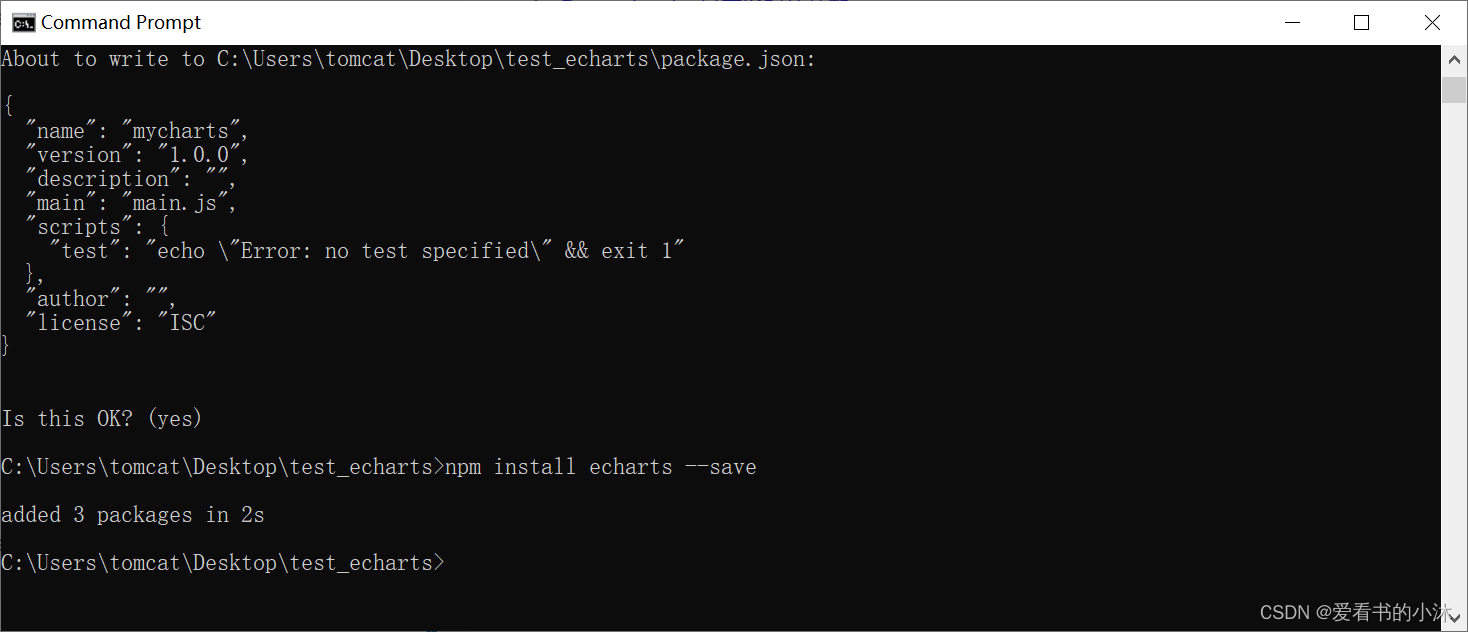
安装完成后 ECharts 和 zrender 会放在 node_modules 目录下:

npm install jquery --savenpm i bootstrap --save 或者 npm i bootstrap -S
#or
npm i bootstrap --save-dev 或者 npm i bootstrap -D
现在用一个网页测试如下:
<!DOCTYPE html>
<html lang="en">
<head><meta charset="UTF-8"><meta http-equiv="X-UA-Compatible" content="IE=edge"><meta name="viewport" content="width=device-width, initial-scale=1.0"><title>Document</title><script src="./node_modules/echarts/dist/echarts.js"></script>
</head><body><!-- 为 ECharts 准备一个定义了宽高的 DOM --><div id="main" style="width: 600px;height:400px;"></div><script type="text/javascript">// 基于准备好的dom,初始化echarts实例var myChart = echarts.init(document.getElementById('main'));// 指定图表的配置项和数据var option = {title: {text: '爱看书的小沐echarts图表',left:'right',textStyle:{color:'purple'}},tooltip: {},legend: {data: ['销量']},xAxis: {data: ['衬衫', '羊毛衫', '雪纺衫', '裤子', '高跟鞋', '袜子']},yAxis: {},series: [{name: '销量',type: 'bar',data: [5, 20, 36, 10, 10, 20]}]};// 使用刚指定的配置项和数据显示图表。myChart.setOption(option);</script></body>
</html>
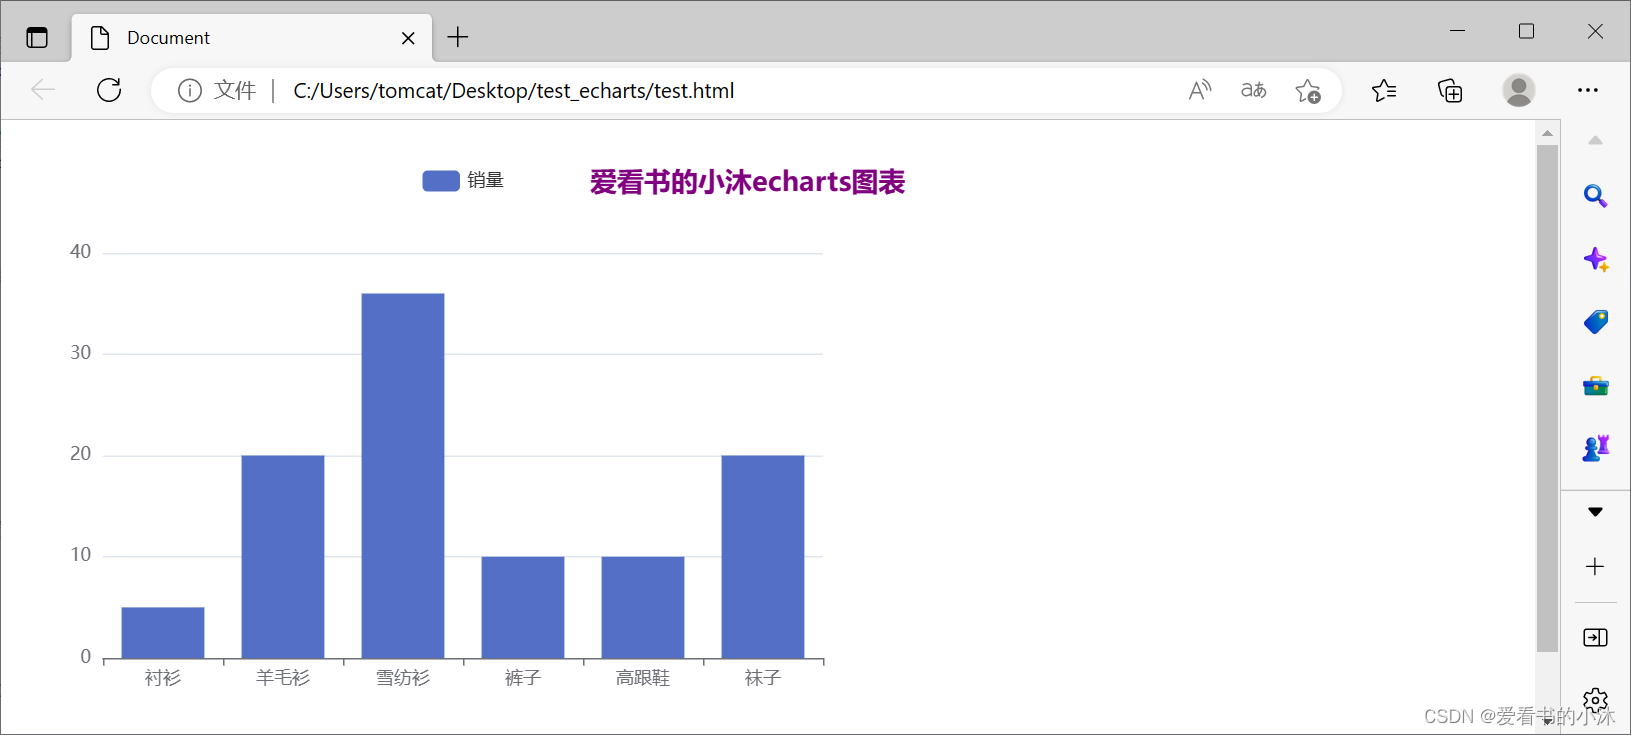
2.3 从 CDN 获取
以下推荐国外比较稳定的两个 CDN,国内还没发现哪一家比较好,目前还是建议下载到本地。
Staticfile CDN(国内) :
https://cdn.staticfile.org/echarts/4.3.0/echarts.min.jsjsDelivr:
https://cdn.jsdelivr.net/npm/echarts@4.3.0/dist/echarts.min.js。cdnjs :
https://cdnjs.cloudflare.com/ajax/libs/echarts/4.3.0/echarts.min.js
2.4 在线定制
https://echarts.apache.org/zh/builder.html


2.5 离线文件
在 ECharts 的官网上直接下载更多丰富的版本,包含了不同主题跟语言,下载地址:https://echarts.apache.org/zh/download.html。这些构建好的 echarts 提供了下面这几种定制:
完全版:echarts/dist/echarts.js,体积最大,包含所有的图表和组件,所包含内容参见:echarts/echarts.all.js。
常用版:echarts/dist/echarts.common.js,体积适中,包含常见的图表和组件,所包含内容参见:echarts/echarts.common.js。
精简版:echarts/dist/echarts.simple.js,体积较小,仅包含最常用的图表和组件,所包含内容参见:echarts/echarts.simple.js。
3、Flask + echarts.js(入门例子)
3.1 直接渲染
- app.py:
from flask import Flask, render_templateapp = Flask(__name__)@app.route('/')
def index():return render_template('index.html')if __name__ == '__main__':app.run(debug=True)
- index.html:
<!DOCTYPE html>
<html>
<head><meta charset="utf-8"><title>第一个 ECharts 实例</title><!-- 引入 echarts.js --><script src="https://cdn.staticfile.org/echarts/4.3.0/echarts.min.js"></script>
</head>
<body><!-- 为ECharts准备一个具备大小(宽高)的Dom --><div id="main" style="width: 600px;height:400px;"></div><script type="text/javascript">// 基于准备好的dom,初始化echarts实例var myChart = echarts.init(document.getElementById('main'));// 指定图表的配置项和数据var option = {legend: {},tooltip: {},dataset: {source: [['product', '2012', '2013', '2014', '2015'],['Matcha Latte', 41.1, 30.4, 65.1, 53.3],['Milk Tea', 86.5, 92.1, 85.7, 83.1],['Cheese Cocoa', 24.1, 67.2, 79.5, 86.4]]},xAxis: [{type: 'category', gridIndex: 0},{type: 'category', gridIndex: 1}],yAxis: [{gridIndex: 0},{gridIndex: 1}],grid: [{bottom: '55%'},{top: '55%'}],series: [// 这几个系列会在第一个直角坐标系中,每个系列对应到 dataset 的每一行。{type: 'bar', seriesLayoutBy: 'row'},{type: 'bar', seriesLayoutBy: 'row'},{type: 'bar', seriesLayoutBy: 'row'},// 这几个系列会在第二个直角坐标系中,每个系列对应到 dataset 的每一列。{type: 'bar', xAxisIndex: 1, yAxisIndex: 1},{type: 'bar', xAxisIndex: 1, yAxisIndex: 1},{type: 'bar', xAxisIndex: 1, yAxisIndex: 1},{type: 'bar', xAxisIndex: 1, yAxisIndex: 1}]}// 使用刚指定的配置项和数据显示图表。myChart.setOption(option);</script>
</body>
</html>
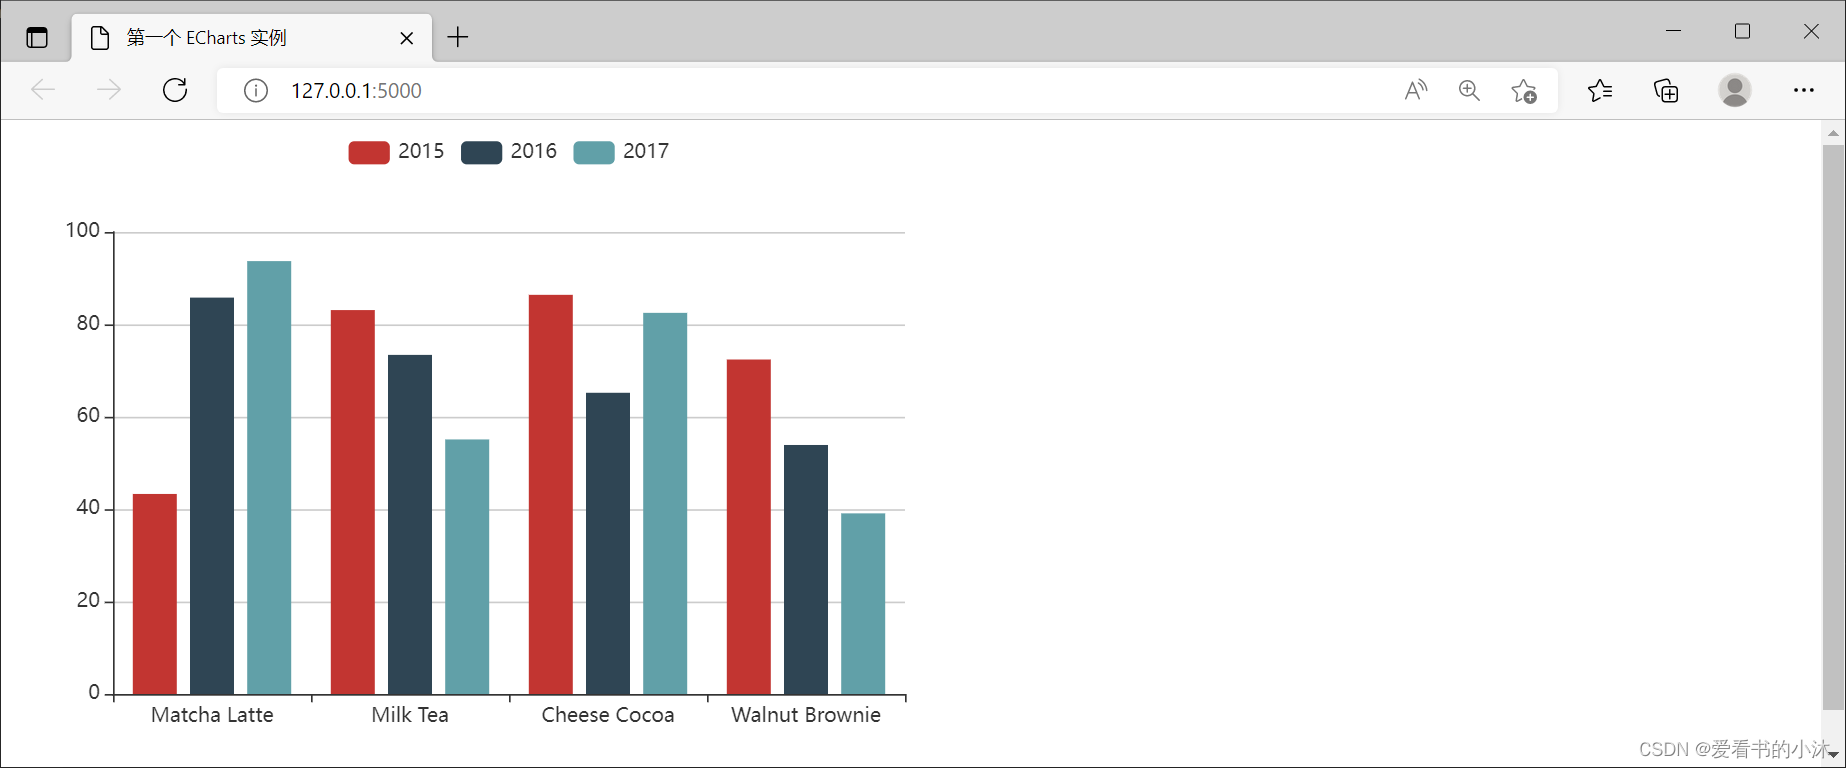
3.2 模板渲染
例子: 模板
- app.py:
import pandas as pd
from flask import Flask, render_templatedatas = {}
datas2 = {}
df = pd.read_csv('data/datum_shift.csv')
df = df.sort_values('AREA_SOUTH_BOUND_LAT', ascending=False)for item in df.head().values:datas[item[0]] = item[1]datas2[item[0]] = item[2]app = Flask(__name__)@app.route('/')
def index():return render_template('index.html', datas=datas)if __name__ == '__main__':app.run(debug=True)- index.html:
<!DOCTYPE html>
<html lang="en">
<head><meta charset="UTF-8"><title>房源占比前五的饼图</title><script src="./static/js/echarts.min.js"></script>
</head>
<body>
<div id="main" style="width:1000px;height:400px"></div>
<script type="text/javascript">// 基于准备好的dom,初始化echarts实例var myChart = echarts.init(document.getElementById('main'));option = {title: {text: 'datum_shift',subtext: '饼图练习',left: 'center'},tooltip: {trigger: 'item'},legend: {orient: 'vertical',left: 'left'},series: [{name: '各项占比',type: 'pie',radius: '50%',data: [{% for data in datas %}{value:{{ datas[data] }}, name: '{{data}}'},{% endfor %}],emphasis: {itemStyle: {shadowBlur: 10,shadowOffsetX: 0,shadowColor: 'rgba(0, 0, 0, 0.5)'}}}]};// 使用刚指定的配置项和数据显示图表。myChart.setOption(option);</script>
</body>
</html>
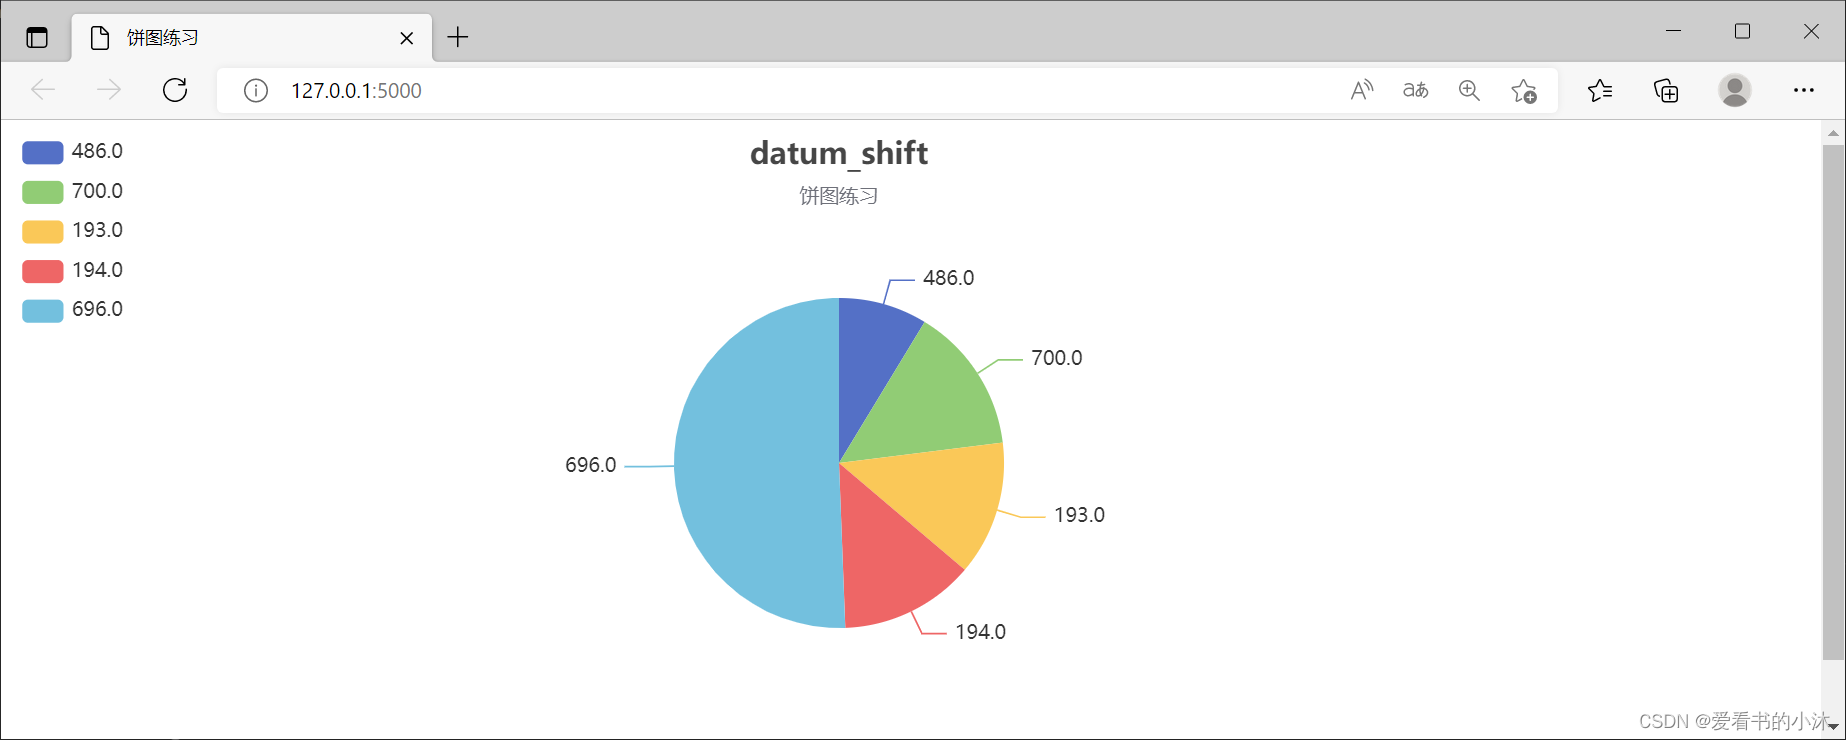
4、Flask + echarts.js(jQuery例子)
4.1 异步请求jQuery.js($.ajax)
例子:$.ajax
创建目录如下:
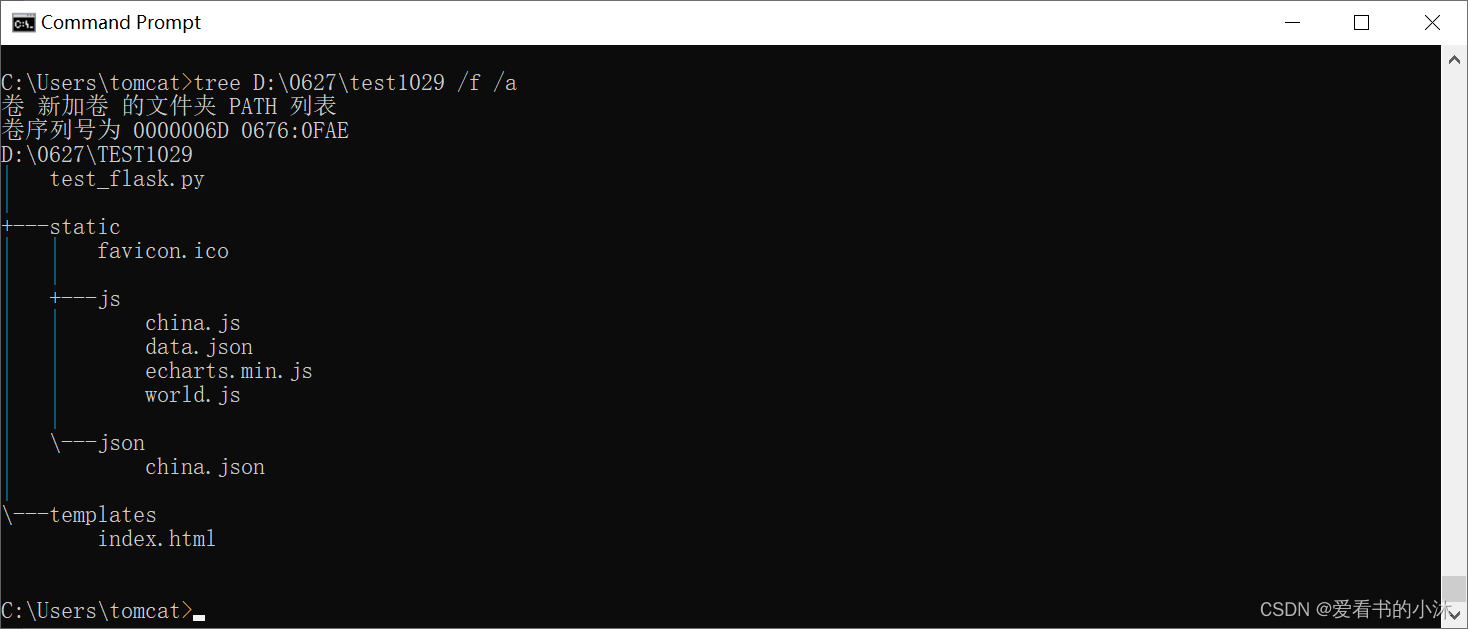
- test_flask.py:
import json
from flask import Flask, request, jsonify,render_template
app = Flask(__name__)@app.route('/test')
def hello_world():return 'Hello World,爱看书的小沐!'@app.route("/")
def index():return render_template("index.html")@app.route('/getdata_bar')
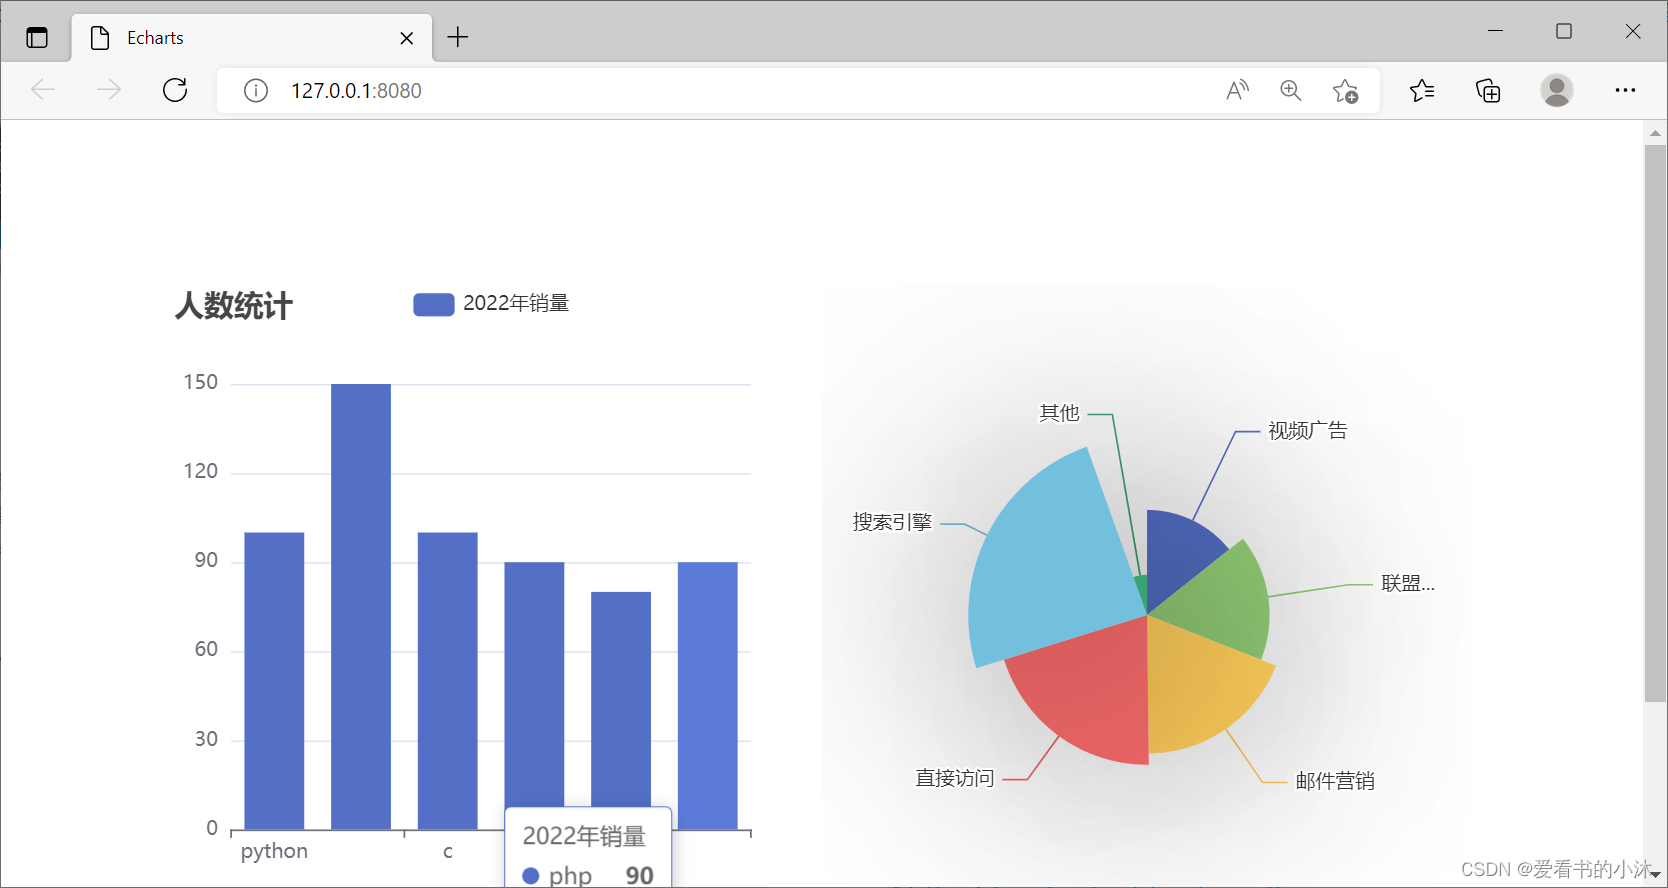
def getdata_bar():language = ['python', 'java', 'c', 'c++', 'c#', 'php']value = ['100', '150', '100', '90', '80', '90']return json.dumps({'language':language,'value':value},ensure_ascii=False) @app.route('/getdata_pie')
def getdata_pie():data = [{"value": 235, "name": '视频广告'},{"value": 274, "name": '联盟广告'},{"value": 310, "name": '邮件营销'},{"value": 335, "name": '直接访问'},{"value": 400, "name": '搜索引擎'},{"value": 90, "name": '其他'},],return json.dumps({'data':data},ensure_ascii=False) if __name__ == '__main__':app.run(host="0.0.0.0", port=8080)
- index.html:
<head><meta charset="UTF-8"><title>Echarts</title><script src="https://cdn.bootcss.com/jquery/3.0.0/jquery.min.js"></script><script src="/static/js/echarts.min.js"></script><style>body {margin: 100px;}.flex-div{display: flex;width: auto;}</style>
</head>
<body><!-- 为ECharts准备一个具备大小(宽高)的Dom --><div class="flex-div"><div id="echarts_lang" style="width: 600px;height:400px;"></div><div id="echarts_ad" style="width: 600px;height:400px;"></div><script type="text/javascript">$(function () {// 基于准备好的dom,初始化echarts实例var myChart = echarts.init(document.getElementById('echarts_lang'));$.ajax({url:'/getdata_bar',success:function (data) {json_data=JSON.parse(data)console.info(json_data['language'])console.info(json_data['value'])var option = {title: {text: '人数统计'},tooltip: {},legend: {data:['2022年销量']},xAxis: {data: json_data['language']},yAxis: {},series: [{name: '2022年销量',type: 'bar',data: json_data['value']}]};myChart.setOption(option);}})})$(function () {// 基于准备好的dom,初始化echarts实例var myChart = echarts.init(document.getElementById('echarts_ad'));$.ajax({url:'/getdata_pie',success:function (data) {json_data=JSON.parse(data)console.info(json_data['data'])option = {series : [{name: '访问来源',type: 'pie',radius: '55%',data: json_data['data'][0],roseType: 'angle',itemStyle: {normal: {shadowBlur: 200,shadowColor: 'rgba(0, 0, 0, 0.5)'}}}],};console.info(option)myChart.setOption(option);}})})</script>
</body>

4.2 异步请求jQuery.js($.get)
例子2: $.get
- app.py:
from flask import Flask, request, jsonify,render_template
app = Flask(__name__)categories=["衬衫","羊毛衫","雪纺衫","裤子","高跟鞋","袜子"]
data=[5, 20, 36, 10, 10, 20]
data2=[111, 222, 80, 150, 75, 55]app = Flask (__name__)@app.route('/test')
def hello_world():return 'Hello World,爱看书的小沐!'@app.route('/', methods=["GET"])
def index():return render_template("index.html")@app.route('/echarts', methods=["GET", "POST"])
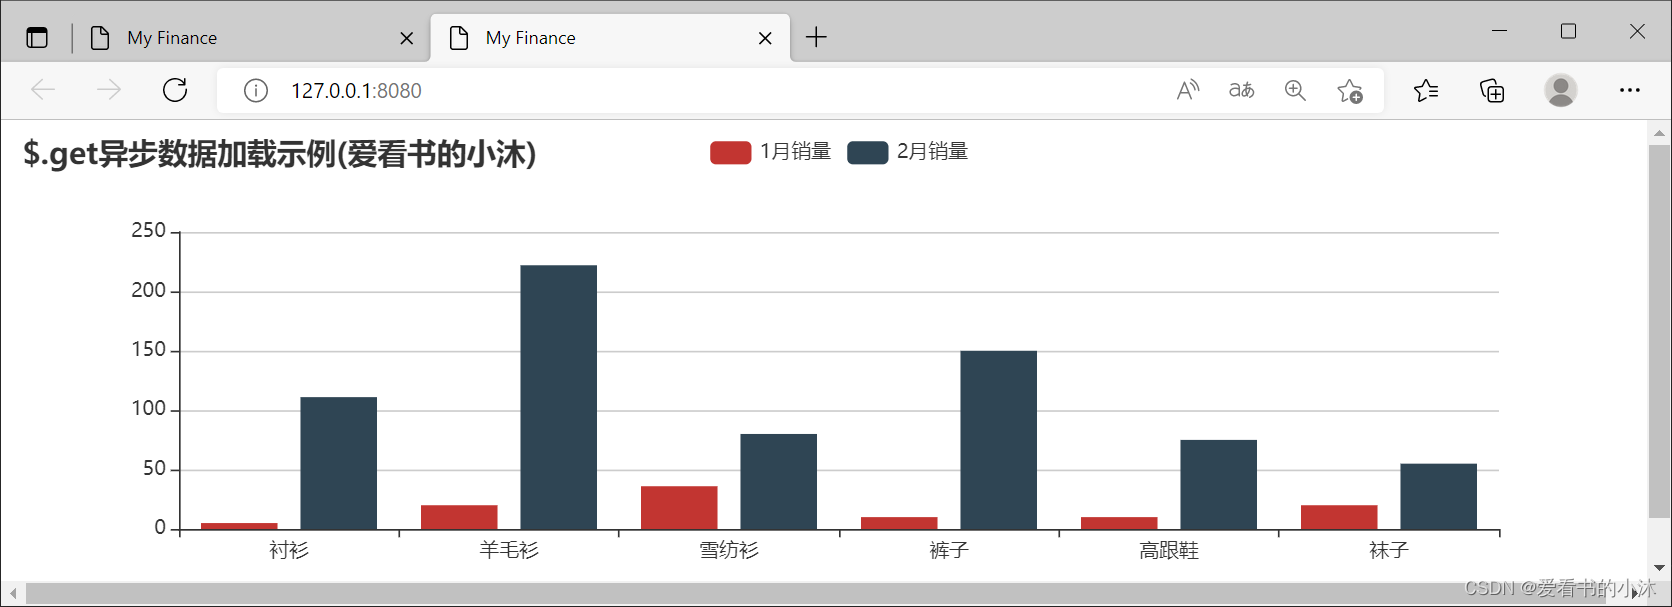
def echarts():return jsonify(categories = categories,data = data, data2 = data2)if __name__ == '__main__':app.run(host="0.0.0.0", port=8080)
- index.html:
<!DOCTYPE html>
<html style="height: 100%" lang="en"><head><meta charset="utf-8"><title>My Finance</title><script src="https://cdn.bootcdn.net/ajax/libs/jquery/3.5.1/jquery.js"></script><script src="https://cdn.staticfile.org/echarts/4.8.0/echarts.min.js"></script><!-- 引入 vintage 主题 -->
</head><body><!-- 为ECharts准备一个具备大小(宽高)的Dom --><div id="main" style="width:1000px;height:300px;"></div><script type="text/javascript">// 基于准备好的dom,初始化echarts实例var myChart = echarts.init(document.getElementById('main'));myChart.setOption({title: {text: '$.get异步数据加载示例(爱看书的小沐)'},tooltip: {},legend: {data: ['1月销量', '2月销量']},xAxis: {data: []},yAxis: {},series: [{name: '1月销量',type: 'bar',data: []},{name: '2月销量',type: 'bar',data: []}]});// 异步加载数据$.get('/echarts').done(function (data) {// 填入数据myChart.setOption({xAxis: {data: data.categories},axisLabel: {show: true,interval: 0,rotate: 40,textStyle: {color: '#333'}},series: [{name: '1月销量',data: data.data},{name: '2月销量',data: data.data2}]});});myChart.setOption(option);</script>
</body></html>
4.3 异步请求jQuery.js($.post)
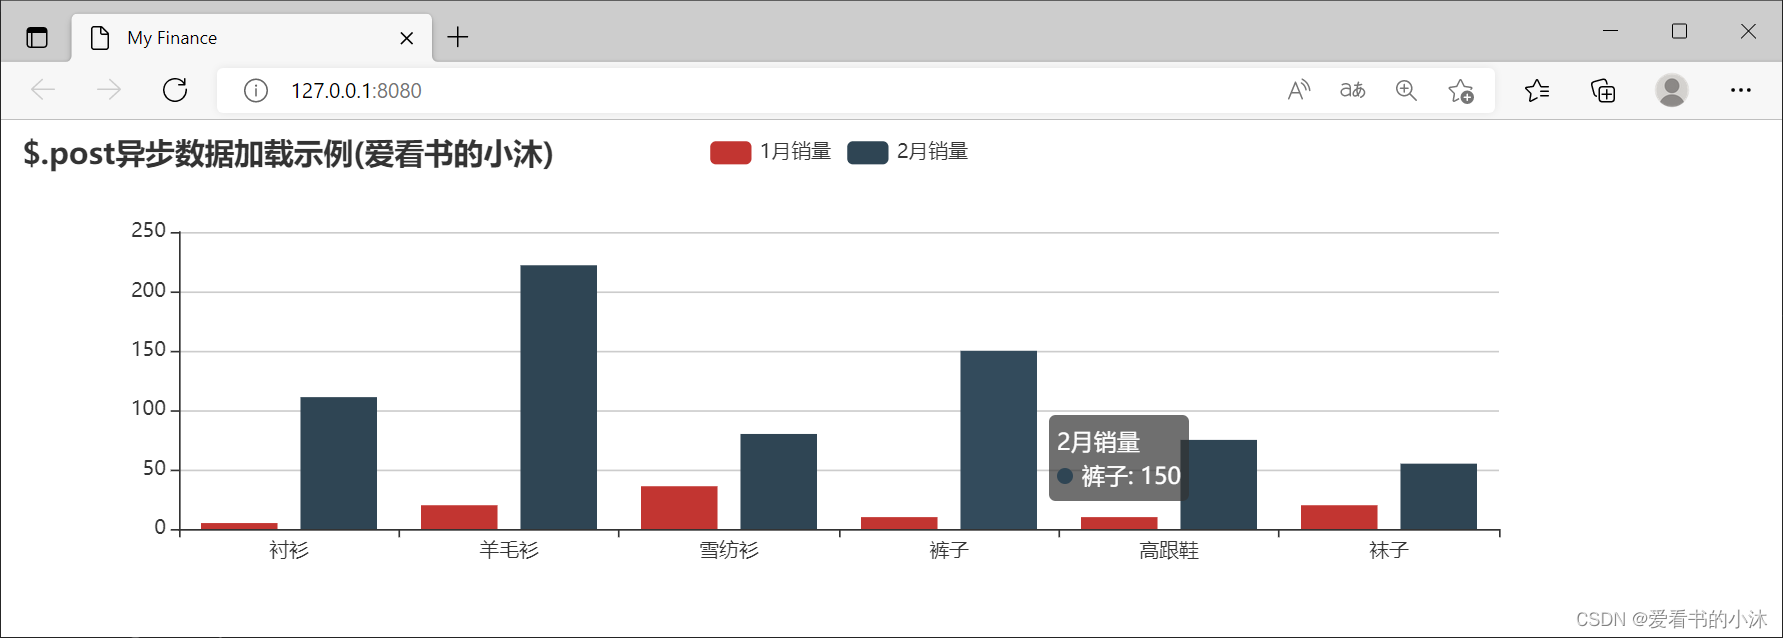
服务端代码app.py同上。
- index.html:
<!DOCTYPE html>
<html style="height: 100%" lang="en"><head><meta charset="utf-8"><title>My Finance</title><script src="https://cdn.bootcdn.net/ajax/libs/jquery/3.5.1/jquery.js"></script><script src="https://cdn.staticfile.org/echarts/4.8.0/echarts.min.js"></script><!-- 引入 vintage 主题 -->
</head><body><!-- 为ECharts准备一个具备大小(宽高)的Dom --><div id="main" style="width:1000px;height:300px;"></div><script type="text/javascript">// 基于准备好的dom,初始化echarts实例var myChart = echarts.init(document.getElementById('main'));myChart.setOption({title: {text: '$.post异步数据加载示例(爱看书的小沐)'},tooltip: {},legend: {data: ['1月销量', '2月销量']},xAxis: {data: []},yAxis: {},series: [{name: '1月销量',type: 'bar',data: []},{name: '2月销量',type: 'bar',data: []}]});// 异步加载数据$.post("/echarts",{suggest:123},function(res){// $.get('/echarts').done(function (data) {// 填入数据myChart.setOption({xAxis: {data: res.categories},axisLabel: {show: true,interval: 0,rotate: 40,textStyle: {color: '#333'}},series: [{name: '1月销量',data: res.data},{name: '2月销量',data: res.data2}]});});</script>
</body>
</html>
5、Flask + echarts.js(axios例子)
5.1 异步请求axios.js(axios.get)
jQuery 的默认 Content-Type 请求头是:Content-Type: application/x-www-form-urlencoded
axios 默认的 Content-Type 请求头是:Content-Type: application/json
Ajax 请求不来源于 form 提交,flask 的 request.form 是拿不到数据的。
如果项目是从 jQuery 转到 axios 上,需要在 axios 上做 Content-Type 的处理:
axios.post({headers: {'Content-Type': 'application/x-www-form-urlencoded'}
})
.then(function (response) {console.log(response);
})
axio.get的几种写法:
axios.get('/page?ID=123').then(function (response) {// handle successconsole.log(response);}).catch(function (error) {// handle errorconsole.log(error);}).then(function () {// always executed});// oraxios.get('/page', {params: {ID: 123}
})
.then(function (response) {console.log(response);
})
.catch(function (error) {console.log(error);
})
.then(function () {// always executed
});
如果请求的是图片流,如下:
axios({method:'get',url:'page/img',responseType:'stream'
})
.then(function (response) {response.data.pipe(fs.createWriteStream('detail.jpg'))
});
axios.js库的简单示例如下:
<html><head><meta charset="UTF-8"><title>LyShark</title><script src="https://cdn.lyshark.com/javascript/axios/0.26.0/axios.min.js"></script></head><body><input type="text" name="name" id="name" /><input type="text" name="age" id="age" /><button onclick="saveHanderPost()" >提交</button></body><!-- 第一种发送方法 --><script type="text/javascript">function saveHanderPost(){let name = document.getElementById("name").value;let age = document.getElementById("age").value;axios.post("/",{name:name,age:age}).then(function(response){console.log(response);console.log(response.data.username);console.log(response.data.message);}).catch(function(error){console.log(error);})}</script><!-- 第二种发送方法 --><script type="text/javascript">function saveHanderPostB(){let name = document.getElementById("name").value;let age = document.getElementById("age").value;axios({url: "/",method: "post",data: {name: name,age:age},responseType: "text/json",}).then(function(response){console.log(response);console.log(response.data.username);console.log(response.data.message);}).catch(function(error){console.log(error);})}</script>
</html>
服务端代码app.py同上。
- index.html
<!DOCTYPE html>
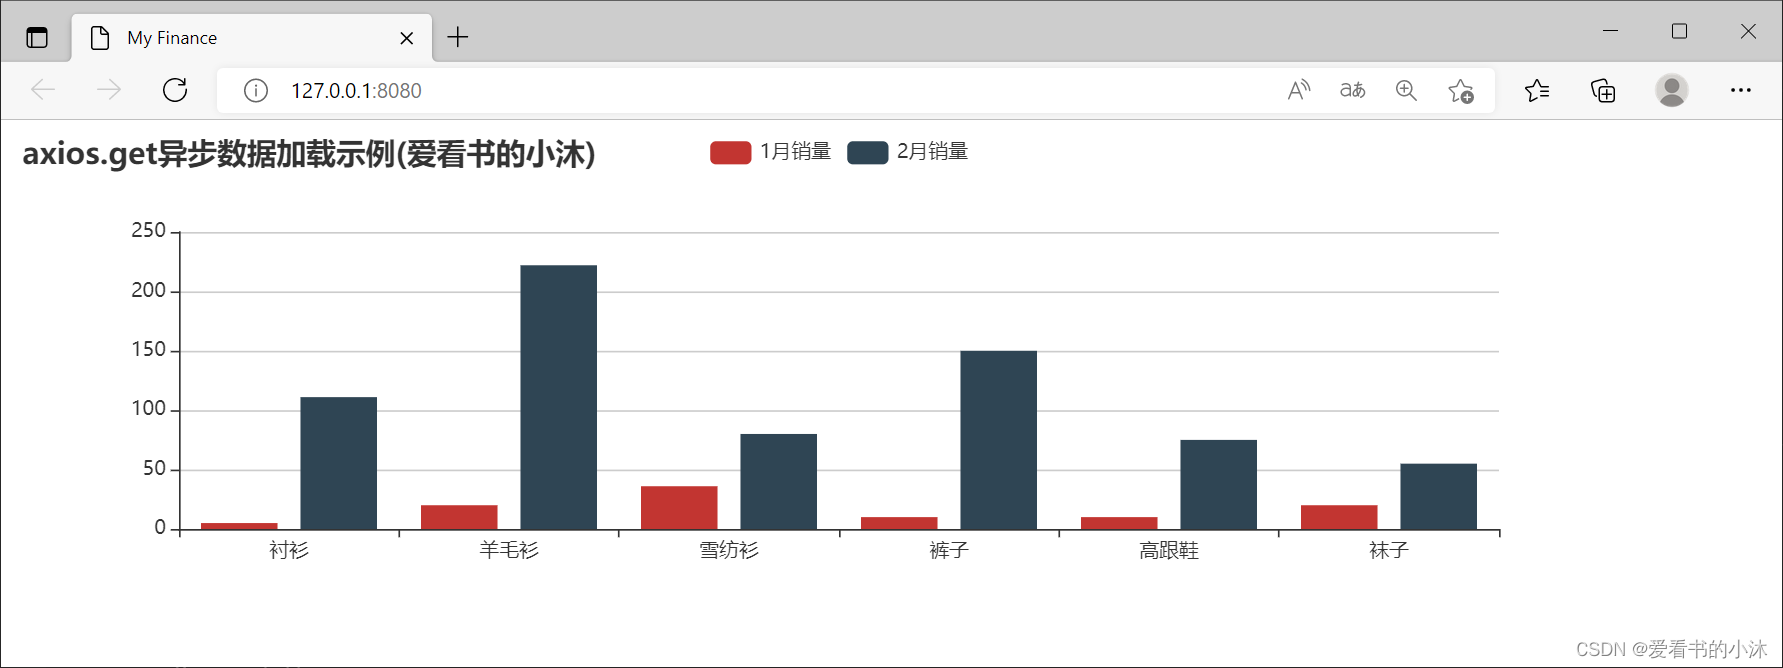
<html style="height: 100%" lang="en"><head><meta charset="utf-8"><title>My Finance</title><script src="https://cdn.bootcdn.net/ajax/libs/jquery/3.5.1/jquery.js"></script><script src="https://cdn.staticfile.org/echarts/4.8.0/echarts.min.js"></script><script src="https://cdn.lyshark.com/javascript/axios/0.26.0/axios.min.js"></script>
</head><body><!-- 为ECharts准备一个具备大小(宽高)的Dom --><div id="main" style="width:1000px;height:300px;"></div><script type="text/javascript">// 基于准备好的dom,初始化echarts实例var myChart = echarts.init(document.getElementById('main'));myChart.setOption({title: {text: 'axios.get异步数据加载示例(爱看书的小沐)'},tooltip: {},legend: {data: ['1月销量', '2月销量']},xAxis: {data: []},yAxis: {},series: [{name: '1月销量',type: 'bar',data: []},{name: '2月销量',type: 'bar',data: []}]});axios.get('/echarts').then(res => {// axios({//     method: 'get', //     url: '/echarts',//     params: {}// }).then((res) => {console.log(res);myChart.setOption({xAxis: {data: res.data.categories},axisLabel: {show: true,interval: 0,rotate: 40,textStyle: {color: '#333'}},series: [{name: '1月销量',data: res.data.data},{name: '2月销量',data: res.data.data2}]});})</script>
</body>
</html>
5.2 异步请求axios.js(axios.post)
服务端代码app.py同上。
- index.html
<!DOCTYPE html>
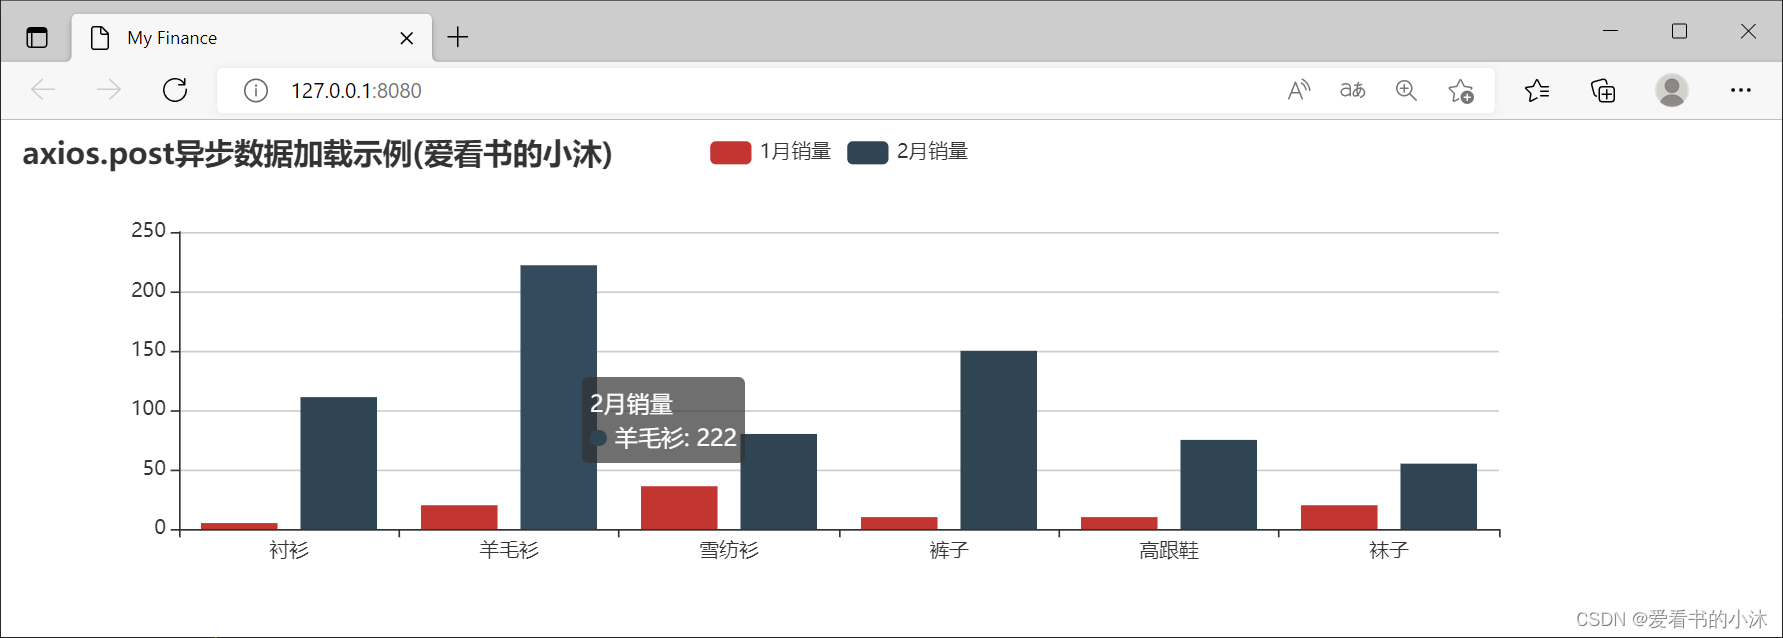
<html style="height: 100%" lang="en"><head><meta charset="utf-8"><title>My Finance</title><script src="https://cdn.bootcdn.net/ajax/libs/jquery/3.5.1/jquery.js"></script><script src="https://cdn.staticfile.org/echarts/4.8.0/echarts.min.js"></script><script src="https://cdn.lyshark.com/javascript/axios/0.26.0/axios.min.js"></script>
</head><body><!-- 为ECharts准备一个具备大小(宽高)的Dom --><div id="main" style="width:1000px;height:300px;"></div><script type="text/javascript">// 基于准备好的dom,初始化echarts实例var myChart = echarts.init(document.getElementById('main'));myChart.setOption({title: {text: 'axios.post异步数据加载示例(爱看书的小沐)'},tooltip: {},legend: {data: ['1月销量', '2月销量']},xAxis: {data: []},yAxis: {},series: [{name: '1月销量',type: 'bar',data: []},{name: '2月销量',type: 'bar',data: []}]});axios.post('/echarts', {name: 'alma',edu: {shcool: 'MIT', age: '20'},headers: {'Content-Type': 'application/x-www-form-urlencoded'}})// axios({//     url: "/echarts",//     method: "post",//     data: {//         name: 111,//         age: 222//     },//     responseType: "json",// }).then(function(res){// console.log(res);// console.log(res.data.username);// console.log(res.data.message);console.log(res);myChart.setOption({xAxis: {data: res.data.categories},axisLabel: {show: true,interval: 0,rotate: 40,textStyle: {color: '#333'}},series: [{name: '1月销量',data: res.data.data},{name: '2月销量',data: res.data.data2}]});}).catch(function(error){console.log(error);})</script>
</body>
</html>
6、Flask + echarts.js(fetch例子)
Fetch API 提供了一个获取资源的接口(包括跨网络通信)。对于任何使用过 XMLHttpRequest 的人都能轻松上手,而且新的 API 提供了更强大和灵活的功能集。
Fetch 提供了对 Request 和 Response(以及其它与网络请求有关的)对象的通用定义。这将在未来更多需要它们的地方使用它们,无论是 service worker、Cache API,又或者是其它处理请求和响应的方式,甚至是任何一种需要你自己在程序中生成响应的方式(即使用计算机程序或者个人编程指令)。
发送请求或者获取资源,请使用 fetch() 方法。它在很多接口中都被实现了,更具体地说,是在 Window 和 WorkerGlobalScope 接口上。因此在几乎所有环境中都可以用这个方法获取资源。
fetch 规范主要在三个方面与 jQuery.ajax() 不同:
- 从 fetch() 返回的 Promise 不会因 HTTP 的错误状态而被拒绝,即使响应是 HTTP 404 或 500。相反,它将正常兑现(ok 状态会被设置为 false),并且只有在网络故障或者有任何阻止请求完成时,才拒绝。
- 除非你在 init 对象中设置(去包含)credentials,否则 fetch() 将不会发送跨源 cookie。
6.1 异步请求fetch(fetch+get)
服务端代码app.py同上。
- index.html
<!DOCTYPE html>
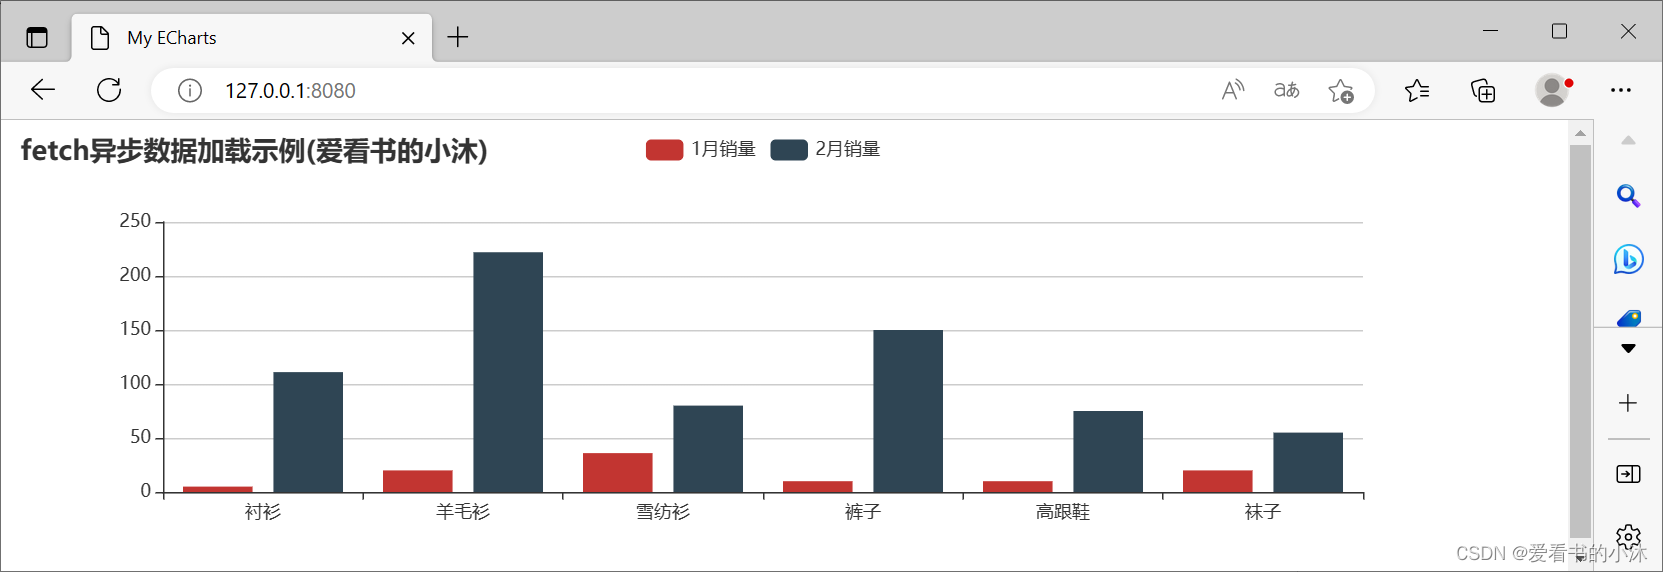
<html style="height: 100%" lang="en"><head><meta charset="utf-8"><title>My ECharts</title><script src="https://cdn.bootcdn.net/ajax/libs/jquery/3.5.1/jquery.js"></script><script src="https://cdn.staticfile.org/echarts/4.8.0/echarts.min.js"></script><!-- 引入 vintage 主题 -->
</head><body><!-- 为ECharts准备一个具备大小(宽高)的Dom --><div id="main" style="width:1000px;height:300px;"></div><script type="text/javascript">// 基于准备好的dom,初始化echarts实例var myChart = echarts.init(document.getElementById('main'));myChart.setOption({title: {text: 'fetch+get异步数据加载示例(爱看书的小沐)'},tooltip: {},legend: {data: ['1月销量', '2月销量']},xAxis: {data: []},yAxis: {},series: [{name: '1月销量',type: 'bar',data: []},{name: '2月销量',type: 'bar',data: []}]});<!-- //(1) --><!-- fetch("/echarts").then(res=>res.json()).then(res=>{ --><!-- console.log(res); --><!-- }) --><!-- //(2) --><!-- fetch("/echarts") --><!-- .then(res=>{ --><!-- console.log(res.status); // 200 --><!-- console.log(res.statusText); // ok --><!-- }) -->//(3)fetch("/echarts").then(response=>{<!-- fetch("/echarts").then(function(response){ --><!-- return response.blob(); --><!-- return response.text(); -->return response.json();}).then(function(data){console.log(data);myChart.setOption({xAxis: {data: data.categories},axisLabel: {show: true,interval: 0,rotate: 40,textStyle: {color: '#333'}},series: [{name: '1月销量',data: data.data},{name: '2月销量',data: data.data2}]});alert("ok");});</script>
</body>
</html>
6.2 异步请求fetch(fetch+post)
let payload = 'foo=bar&name=tomcat';let paramHeaders = new Headers({'Content-Type': 'application/x-www-form-urlencoded; charset=UTF-8'});fetch('/send-params', {method: 'POST', // 发送请求体时必须使用一种HTTP方法body: payload,headers: paramHeaders});
服务端代码app.py同上。
- index.html
<!DOCTYPE html>
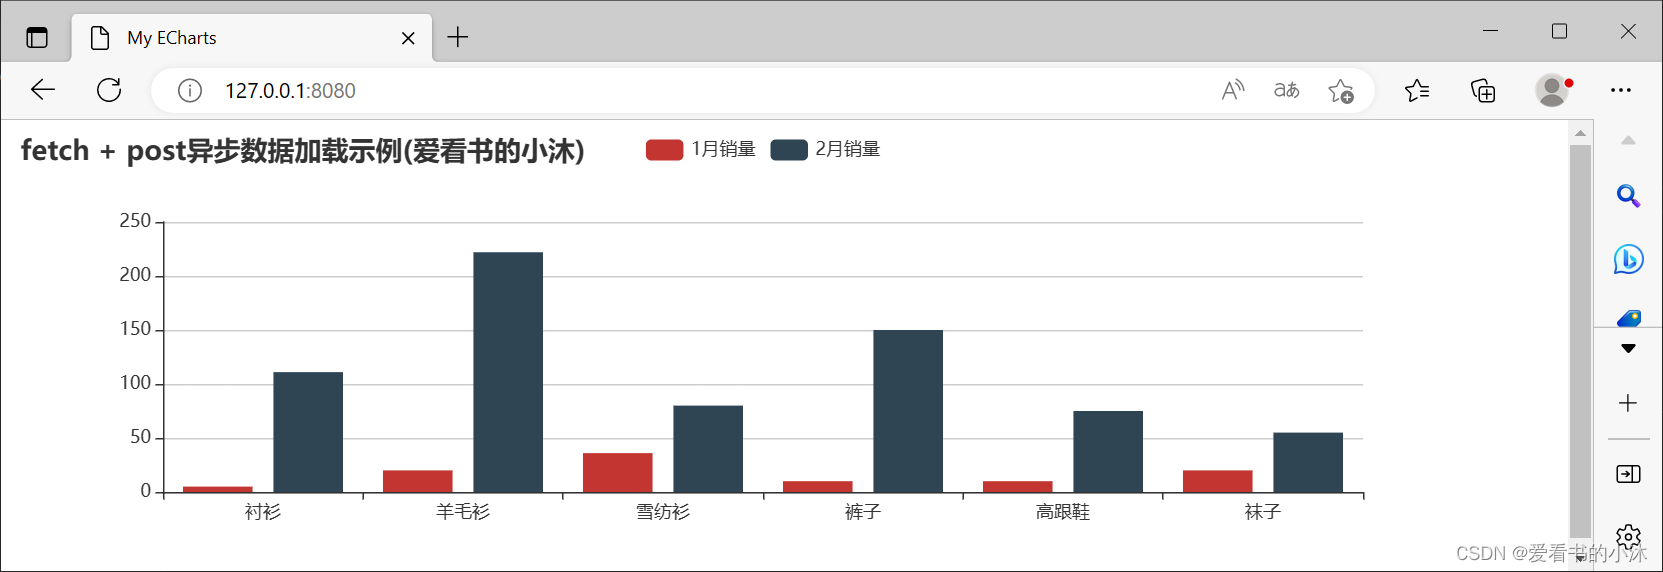
<html style="height: 100%" lang="en"><head><meta charset="utf-8"><title>My ECharts</title><script src="https://cdn.bootcdn.net/ajax/libs/jquery/3.5.1/jquery.js"></script><script src="https://cdn.staticfile.org/echarts/4.8.0/echarts.min.js"></script><!-- 引入 vintage 主题 -->
</head><body><!-- 为ECharts准备一个具备大小(宽高)的Dom --><div id="main" style="width:1000px;height:300px;"></div><script type="text/javascript">// 基于准备好的dom,初始化echarts实例var myChart = echarts.init(document.getElementById('main'));myChart.setOption({title: {text: 'fetch + post异步数据加载示例(爱看书的小沐)'},tooltip: {},legend: {data: ['1月销量', '2月销量']},xAxis: {data: []},yAxis: {},series: [{name: '1月销量',type: 'bar',data: []},{name: '2月销量',type: 'bar',data: []}]});<!-- fetch("http://127.0.0.1:3000/books", { -->fetch("/echarts", {method: "post",<!-- body: "uname=lisi&pwd=123", -->body: "",header: {"Content-Type": "application/x-www-form-urlencoded"}}).then(function(response){return response.json();}).then(function(response){console.log(response);myChart.setOption({xAxis: {data: response.categories},axisLabel: {show: true,interval: 0,rotate: 40,textStyle: {color: '#333'}},series: [{name: '1月销量',data: response.data},{name: '2月销量',data: response.data2}]});alert("ok");})</script>
</body>
</html>

结语
如果您觉得该方法或代码有一点点用处,可以给作者点个赞,或打赏杯咖啡;╮( ̄▽ ̄)╭
如果您感觉方法或代码不咋地//(ㄒoㄒ)//,就在评论处留言,作者继续改进;o_O???
如果您需要相关功能的代码定制化开发,可以留言私信作者;(✿◡‿◡)
感谢各位大佬童鞋们的支持!( ´ ▽´ )ノ ( ´ ▽´)っ!!!
