简述
医疗保健领域的机器学习研究往往缺乏完全可重复性和可比性所需的公共数据。由于患者相关数据附带的隐私问题和法律要求,数据集往往受到限制。因此,许多算法和模型发表在同一主题上,没有一个标准的基准。因此,本文提出了一个公共数据集,包含健康、活动和心率数据,来自诊断的成年患者,更众所周知的ADHD。该数据集包括来自51名ADHD患者和52名临床对照组的数据。除了活动和心率数据,我们还包括了一系列患者属性,如他们的年龄、性别和精神状态信息,以及来自计算机化神经心理测试的输出数据。结合所提供的数据集,我们还提供了基线实验,使用传统的机器学习算法来预测基于所包含的活动数据的ADHD。
关键词:注意缺陷多动障碍,多动症,活动记录仪,运动活动,心率,机器学习,人工智能,数据集
数据集详细信息
表1:85名有记录的运动活动的患者的特征和人口统计学数据。来自临床评估的数据是作为平均值(标准推导)。差异检验采用独立样本t检验和Levene方差等式检验,显著性水平为𝑝< 0.05。(NS等于𝑝> 0.05)

应用程序实现功能
发布这个数据集的目的有两方面。首先,希望使心理健康研究领域的人更容易获得没有私人医疗数据的计算机科学家。其次,有很多关于医疗应用的多媒体研究,其中数据集是私有的,使工作既不直接适用,也不能重复。我们希望通过发布这个数据集,我们为心理健康研究打开一个更加透明和协作的社区。作为一个起点,我们预计这个数据集将有几个应用程序和使用场景。下面是几个例子。
通过使用所纳入的活动数据、心率变异性或两者的结合来预测患者是否患有ADHD。
•使用与患者相关的属性来分析ADHD和双相情感障碍等其他疾病之间的联系。
•使用患者相关属性和无监督技术获得新的见解,可能推进ADHD和相关精神障碍的诊断和治疗。
•分析ADHD患者的心率数据。我们使用上述的一些应用程序场景进行实验。

主要代码:
将数据集进行可视化。在数据分析和机器学习的上下文中,可视化是一种强大的工具,它允许我们通过图形、图表、图像等形式直观地展示数据的特征、趋势、分布等信息。这有助于我们更好地理解数据,发现数据中的模式、异常值或关系,从而做出更准确的决策或构建更有效的模型。
数据可视化的方法多种多样,包括但不限于以下几种:
- 条形图(Bar Charts):用于比较不同类别的数据。
- 折线图(Line Charts):展示数据随时间或其他连续变量的变化趋势。
- 散点图(Scatter Plots):显示两个变量之间的关系,通常用于观察是否存在相关性。
- 直方图(Histograms):展示数据的分布情况,特别是连续变量的分布情况。
- 箱线图(Box Plots):提供数据分布的四分位数信息,帮助识别异常值。
- 热力图(Heatmaps):通过颜色的深浅来表示数据的大小或密度,常用于展示矩阵或表格数据。
- 饼图(Pie Charts):虽然使用较少,但可用于展示各部分占总体的比例。
dataX = pd.read_csv(_PATH_TO_FEATURES, sep=";").sort_values(by="ID")
dataY = pd.read_csv(_PATH_TO_GT, sep=";").sort_values(by="ID")
dataY.columns
Index(['ID', 'SEX', 'AGE', 'ACC', 'ACC_TIME', 'ACC_DAYS', 'HRV', 'HRV_TIME','HRV_HOURS', 'CPT_II', 'ADHD', 'ADD', 'BIPOLAR', 'UNIPOLAR', 'ANXIETY','SUBSTANCE', 'OTHER', 'CT', 'MDQ_POS', 'WURS', 'ASRS', 'MADRS','HADS_A', 'HADS_D', 'MED', 'MED_Antidepr', 'MED_Moodstab','MED_Antipsych', 'MED_Anxiety_Benzo', 'MED_Sleep','MED_Analgesics_Opioids', 'MED_Stimulants', 'filter_$'],dtype='object')
fig = plt.figure(figsize=(14,15))ax2 = fig.add_subplot(321)
ax2 = dataY['SEX'].value_counts().plot(kind='barh', color=['blue','red'], alpha=.5,title='Sex Distribution')
ax3 = fig.add_subplot(322)
ax3 = dataY['ADHD'].value_counts().plot(kind='barh', color=['blue','red', 'green'], alpha=.5,title='Diagnosis Distribution')
ax5 = fig.add_subplot(323)
ax5 = sns.distplot(dataY['MADRS'], kde=False)ax5 = fig.add_subplot(324)
ax5 = sns.distplot(dataY['WURS'], kde=False)
patient_activity_data = pd.read_csv(_VISUALIZE_PATIENT, sep=";", parse_dates=["TIMESTAMP"], infer_datetime_format=True).sort_values(by="TIMESTAMP")
patient_activity_data = patient_activity_data.set_index(['TIMESTAMP'])patient_activity_data.loc['2010-04-20 00:00:00':'2010-04-21 00:00:00'].plot(kind='line', figsize=(10,6))plt.xlabel('Time',size=20); plt.xticks(size=15)
plt.ylabel('Movement Activity',size=20); plt.yticks(size=15)plt.show() 
dataX = pd.read_csv(_PATH_TO_FEATURES, sep=";").sort_values(by="ID")
dataY = pd.read_csv(_PATH_TO_GT, sep=";").sort_values(by="ID")dataX = dataX.fillna(0)# Remove JSON symbols from headers
dataX = dataX.rename(columns = lambda x:re.sub('"', '', x))
dataX = dataX.rename(columns = lambda x:re.sub(',', '', x))
dataY = dataY.rename(columns = lambda x:re.sub('"', '', x))
dataY = dataY.rename(columns = lambda x:re.sub(',', '', x))# Match X and Y data
dataY = dataY[dataY["ID"].isin(dataX["ID"])]
dataX = dataX[dataX["ID"].isin(dataY["ID"])]dataY = dataY.set_index("ID")
dataX = dataX.set_index("ID")dataY = dataY["ADHD"].copy()# Find relevant features using tsfresh
dataX = select_features(dataX, dataY)scaler = StandardScaler(copy=True)
dataX.loc[:, dataX.columns] = scaler.fit_transform(dataX[dataX.columns])X_TRAIN, X_TEST, Y_TRAIN, Y_TEST = train_test_split(dataX,dataY,test_size=_TEST_RATIO,random_state=_RANDOM_SEED,stratify=dataY)
验证数据:


test_cv_results = []
for model in lr_models:test_cv_results.append((model.predict_proba(X_TEST)[:, 1], list(Y_TEST)))
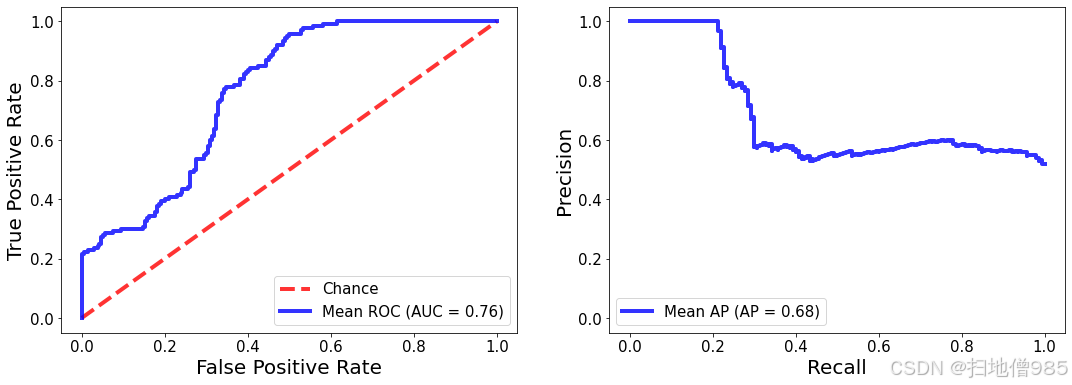
plot_au_curves(test_cv_results)
calculate_cv_results(test_cv_results)
参考文献:
[1]
Amirmasoud Ahmadi, Mehrdad Kashefi, Hassan Shahrokhi, and Mohammad Ali Nazari. 2021. Computer aided diagnosis system using deep convolutional neural networks for ADHD subtypes. Biomedical Signal Processing and Control 63 (2021), 102227.
Crossref
Google Scholar
[2]
Gail A Alvares, Daniel S Quintana, Ian B Hickie, and Adam J Guastella. 2016. Autonomic nervous system dysfunction in psychiatric disorders and the impact of psychotropic medications: a systematic review and meta-analysis. Journal of Psychiatry & Neuroscience (2016).
Google Scholar
[3]
Søren Brage, Niels Brage, Paul W Franks, Ulf Ekelund, and Nicholas J Wareham. 2005. Reliability and validity of the combined heart rate and movement sensor Actiheart. European journal of clinical nutrition 59, 4 (2005), 561--570.
Google Scholar
[4]
Erlend Joramo Brevik, Astri J Lundervold, Jan Haavik, and Maj-Britt Posserud. 2020. Validity and accuracy of the Adult Attention-Deficit/Hyperactivity Disorder (ADHD) Self-Report Scale (ASRS) and the Wender Utah Rating Scale (WURS) symptom checklists in discriminating between adults with and without ADHD. Brain and behavior 10, 6 (2020), e01605.
Google Scholar
[5]
Christopher Burton, Brian McKinstry, Aurora Szentagotai Tătar, Antoni Serrano-Blanco, Claudia Pagliari, and Maria Wolters. 2013. Activity monitoring in patients with depression: a systematic review. Journal of affective disorders 145, 1 (2013), 21--28.
Crossref
Google Scholar
[6]
Tianqi Chen and Carlos Guestrin. 2016. XGBoost: A Scalable Tree Boosting System. In Proceedings of the 22nd ACM SIGKDD International Conference on Knowledge Discovery and Data Mining (San Francisco, California, USA) (KDD '16). Association for Computing Machinery, New York, NY, USA, 10.
Digital Library
Google Scholar
[7]
Maximilian Christ, Nils Braun, Julius Neuffer, and Andreas W. Kempa-Liehr. 2018. Time Series FeatuRe Extraction on basis of Scalable Hypothesis tests (tsfresh -- A Python package). Neurocomputing 307 (2018).
Digital Library
Google Scholar
[8]
C. Keith Conners and Gill Sitarenios. 2011. Conners' Continuous Performance Test (CPT). Springer New York, New York, NY.
Crossref
Google Scholar
[9]
Gianni L Faedda, Kyoko Ohashi, Mariely Hernandez, Cynthia E McGreenery, Marie C Grant, Argelinda Baroni, Ann Polcari, and Martin H Teicher. 2016. Actigraph measures discriminate pediatric bipolar disorder from attention-deficit/hyperactivity disorder and typically developing controls. Journal of Child Psychology and Psychiatry 57, 6 (2016).
Crossref
Google Scholar
[10]
Ole Bernt Fasmer, Erlend Eindride Fasmer, Kristin Mjeldheim, Wenche Førland, Vigdis Elin Giæver Syrstad, Petter Jakobsen, Jan Øystein Berle, Tone EG Henriksen, Zahra Sepasdar, Erik R Hauge, et al. 2020. Diurnal variation of motor activity in adult ADHD patients analyzed with methods from graph theory. PloS one 15, 11 (2020).
Google Scholar
交流与联系
往期文章:
基于U-Net深度学习的肿瘤识别检测(肠胃息肉检测)_基于深度学习的息肉检测系统-CSDN博客


![[笔记]某变频器,功能列表及参数表](https://i-blog.csdnimg.cn/direct/18135b8d5f704809b035edafae1645b7.png)

