首先关于Qt的安装和基本配置这里就不做重复说明了,注:本文在Qt5.14基础上完成 完整的项目开源仓库链接在文章末尾
图形控件——qcustomplot
QCustomPlot是一个基于Qt框架的开源绘图库,用于创建高质量的二维图表和数据可视化。
QCustomPlot的主要功能:
绘制多种图表类型:包括折线图、散点图、柱状图、面积图
交互性:支持图表的缩放、平移、数据点选择等交互操作
多轴支持:可以在图表中添加多个X轴和Y轴,以便绘制复杂的多轴图表
定制化:提供丰富的样式和属性设置,用户可以自定义图表的外观,包括颜色、线条样式、标记
高性能:针对大数据量绘图进行了优化,能够处理大量数据点而不影响性能
主要组件:
QCustomPlot:主绘图控件,所有的绘图操作都在这个控件上进行。
QCPGraph:用于绘制常见的折线图和散点图。
QCPAxis:表示图表的轴,可以自定义轴的范围、标签、刻度等。
QCPItem:图表中的各种辅助元素,如直线、文本标签等。
QCPPlottable:可绘制对象的基类,所有具体的绘图类型都继承自这个类。
该控件使用方法
将qcustomplot的源码一个cpp一个h文件添加到项目工程中,并添加头文件和编译链接就可以便捷的在源码中使用了。注意在放置显示控件时需要先放置一个qt内置的QWidget控件,然后通过右键控件,升格,选中头文件和类名称,设置为QCustomPlot,然后源代码中就可以快乐使用了。具体设置的效果可以参考文末完整的项目链接。

绘制曲线数据
主要使用到了曲线控件customPlot->addGraph();
这个控件的使用方法整体上和Qt自带的控件差别不大,主要这个控件的视觉效果和长时间大数据绘制效果更好一些
在使用控件之前要先初始化相关的控件内容:
// 绘图图表初始化
void MainWindow::QPlot_init(QCustomPlot *customPlot)
{// 创建定时器,用于定时生成曲线坐标点数据QTimer *timer = new QTimer(this);timer->start(10);connect(timer, SIGNAL(timeout()), this, SLOT(Plot_TimeData_Update()));// 图表添加两条曲线pGraph1_1 = customPlot->addGraph();pGraph1_2 = customPlot->addGraph();// 设置曲线颜色pGraph1_1->setPen(QPen(Qt::red));pGraph1_2->setPen(QPen(Qt::black));// 设置坐标轴名称customPlot->xAxis->setLabel("X-Times");customPlot->yAxis->setLabel("Amplitude of channel");// 设置y坐标轴显示范围customPlot->yAxis->setRange(-2, 2);// 显示图表的图例customPlot->legend->setVisible(true);// 添加曲线名称pGraph1_1->setName("Channel1");pGraph1_2->setName("Channel2");// 设置波形曲线的复选框字体颜色ui->checkBox_1->setStyleSheet("QCheckBox{color:rgb(255,0,0)}"); // 设定前景颜色,就是字体颜色// 允许用户用鼠标拖动轴范围,用鼠标滚轮缩放,点击选择图形:customPlot->setInteractions(QCP::iRangeDrag | QCP::iRangeZoom | QCP::iSelectPlottables);
}
当向曲线添加新数据的时候可以同时控制范围窗口内的坐标轴尺寸,以及打印一些绘图相关的属性数据
void MainWindow::Plot_Show_Update(QCustomPlot *customPlot, double n1, double n2)
{cnt++;// 给曲线添加数据pGraph1_1->addData(cnt, n1);pGraph1_2->addData(cnt, n2);// 设置x坐标轴显示范围,使其自适应缩放x轴customPlot->xAxis->setRange( 0, (pGraph1_1->dataCount() > 1000) ? (pGraph1_1->dataCount()) : 1000);// 更新绘图,这种方式在高填充下太浪费资源。rpQueuedReplot,可避免重复绘图。customPlot->replot(QCustomPlot::rpQueuedReplot);static QTime time(QTime::currentTime());double key = time.elapsed() / 1000.0; // 开始到现在的时间,单位秒//计算帧数static double lastFpsKey;static int frameCount;frameCount++;if (key - lastFpsKey > 1) // 每1秒求一次平均值{// 帧数和数据总数ui->statusbar->showMessage(QString("Refresh rate: %1 FPS, Total data volume: %2").arg(frameCount / (key - lastFpsKey), 0, 'f', 0).arg(customPlot->graph(0)->data()->size() + customPlot->graph(1)->data()->size()),0);lastFpsKey = key;frameCount = 0;}
}
曲线的绘制效果:
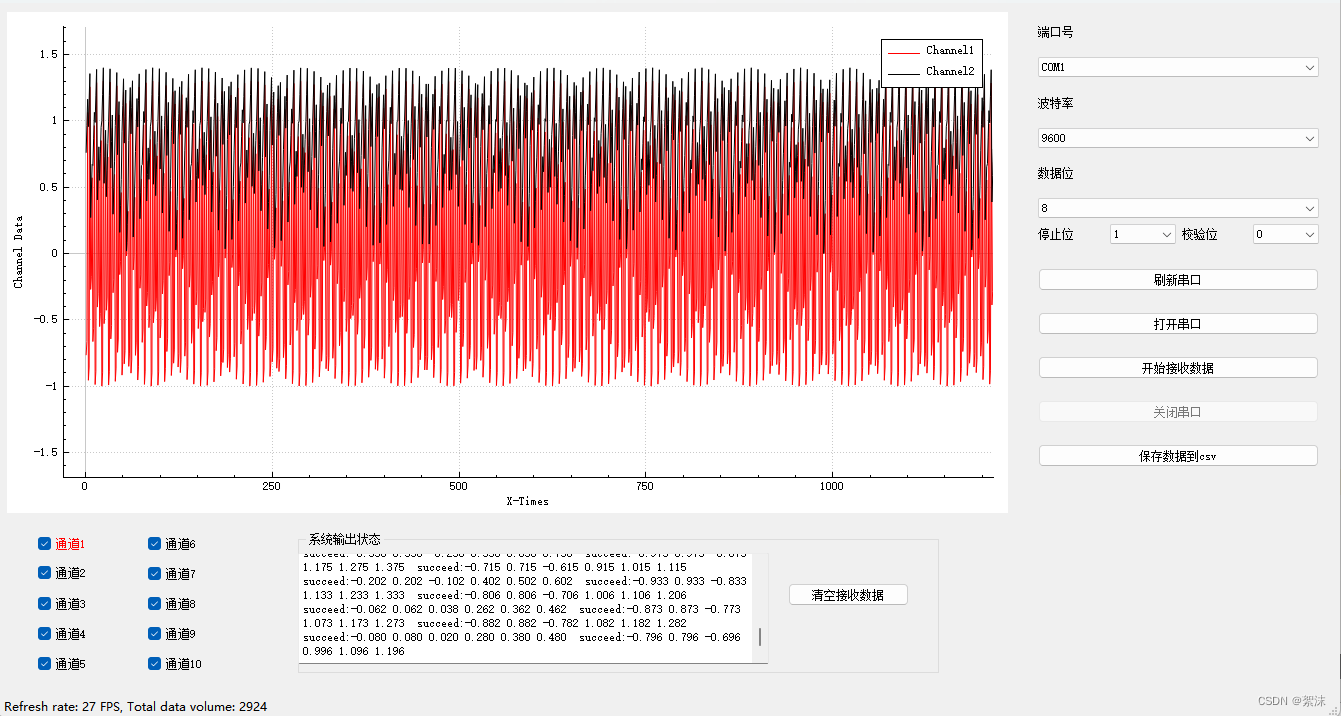
要实现上面的多通道效果还需要自行适配串口解析部分,然后匹配对应的数据后将数值传入到目标曲线对象。
完整的项目源码如下,包含数据解析、串口控制部分、同时实现数据保存到csv文件(代码中只保存了数组前两位的数值,需要保存多少数据可以自行修改代码实现)
项目Cpp文件:
#include "mainwindow.h"
#include "ui_mainwindow.h"MainWindow::MainWindow(QWidget *parent): QMainWindow(parent), ui(new Ui::MainWindow)
{ui->setupUi(this);// 给widget绘图控件,设置个别名,方便书写pPlot1 = ui->widget_1;// 状态栏指针sBar = statusBar();// 初始化图表1QPlot_init(pPlot1);cnt = 0;setWindowTitle("数据采集系统");serialport = new QSerialPort;find_port();                    //查找可用串口timerserial = new QTimer();QObject::connect(serialport,&QSerialPort::readyRead, this, &MainWindow::serial_timerstart);QObject::connect(timerserial,SIGNAL(timeout()), this, SLOT(Read_Date()));ui->close_port->setEnabled(false);//设置控件不可用
}// 析构函数
MainWindow::~MainWindow()
{delete ui;
}//查找串口
void MainWindow::find_port()
{//查找可用的串口bool fondcom = false;ui->com->clear();foreach(const QSerialPortInfo &info, QSerialPortInfo::availablePorts()){QSerialPort serial;serial.setPort(info);   //设置串口if(serial.open(QIODevice::ReadWrite)){//ui->com->addItem(serial.portName());        //显示串口namefondcom = true;QString std = serial.portName();QByteArray comname = std.toLatin1();//QMessageBox::information(this,tr("SerialFond"),tr((const char *)comname.data()),QMessageBox::Ok);serial.close();ui->open_port->setEnabled(true);}}if(fondcom==false){QMessageBox::information(this,tr("Error"),tr("Serial Not Fond!Plase cheak Hardware port!"),QMessageBox::Ok);}
}/* 打开并设置串口参数 */
void MainWindow::on_open_port_clicked()
{update();//find_port();     //重新查找com//初始化串口serialport->setPortName(ui->com->currentText());        //设置串口名if(serialport->open(QIODevice::ReadWrite))              //打开串口成功{serialport->setBaudRate(ui->baud->currentText().toInt());       //设置波特率switch(ui->bit->currentIndex())                   //设置数据位数{case 8:serialport->setDataBits(QSerialPort::Data8);break;default: break;}switch(ui->jiaoyan->currentIndex())                   //设置奇偶校验{case 0: serialport->setParity(QSerialPort::NoParity);break;default: break;}switch(ui->stopbit->currentIndex())                     //设置停止位{case 1: serialport->setStopBits(QSerialPort::OneStop);break;case 2: serialport->setStopBits(QSerialPort::TwoStop);break;default: break;}serialport->setFlowControl(QSerialPort::NoFlowControl);     //设置流控制// 设置控件可否使用ui->close_port->setEnabled(true);ui->open_port->setEnabled(false);ui->refresh_port->setEnabled(false);}else    //打开失败提示{// Sleep(100);QMessageBox::information(this,tr("Erro"),tr("Open the failure"),QMessageBox::Ok);}
}/* 关闭串口并禁用关联功能 */
void MainWindow::on_close_port_clicked()
{serialport->clear();        //清空缓存区serialport->close();        //关闭串口ui->open_port->setEnabled(true);ui->close_port->setEnabled(false);ui->refresh_port->setEnabled(true);
}/* 开始接收数据* */
void MainWindow::on_recive_data_clicked()
{QString str = "START_SEND_DATA\r\n";QByteArray str_utf8 = str.toUtf8();if(serialport->isOpen())serialport->write(str_utf8);else QMessageBox::information(this,tr("ERROE"),tr("串口未连接,请先检查串口连接"),QMessageBox::Ok);
}void MainWindow::serial_timerstart()
{timerserial->start(1);serial_bufferClash.append(serialport->readAll());
}//串口接收数据帧格式为:帧头'*' 帧尾'#' 数字间间隔符号',' 符号全为英文格式
void MainWindow::Read_Date()
{QString string;QStringList serialBuferList;int list_length = 0;//帧长QString str = ui->Receive_text_window->toPlainText();timerserial->stop();//停止定时器
//    qDebug()<< "[Serial LOG]serial read data:" <<serial_bufferClash;QByteArray bufferbegin = "*";   //帧头int index=0;QByteArray bufferend = "#";     //帧尾int indexend = 1;QByteArray buffercashe;index = serial_bufferClash.indexOf(bufferbegin,index);indexend = serial_bufferClash.indexOf(bufferend,indexend);
//    qDebug()<< index<< indexend;int bufferlens=0;if((index<serial_bufferClash.size())&&(indexend<serial_bufferClash.size())){bufferlens = indexend - index-1;buffercashe = serial_bufferClash.mid(index+1,bufferlens);qDebug()<< "[Serial LOG]serial chack data:" <<buffercashe;string.prepend(buffercashe);serialBuferList = string.split(" ");      //数据分割list_length=serialBuferList.count();    //帧长if (list_length>1){clash.data1 = serialBuferList[0].toDouble();clash.data2 = serialBuferList[1].toDouble();plot_buffer.push_back(clash);clash.data1 = serialBuferList[2].toDouble();clash.data2 = serialBuferList[3].toDouble();plot_buffer.push_back(clash);clash.data1 = serialBuferList[4].toDouble();clash.data2 = serialBuferList[5].toDouble();plot_buffer.push_back(clash);}}else{qDebug()<< "[Serial LOG][ERROR]recive data:" <<serial_bufferClash;}str+="succeed:"+buffercashe;str += "  ";ui->Receive_text_window->clear();ui->Receive_text_window->append(str);serial_bufferClash.clear();
}/*  刷新串口按键的按钮槽函数* */
void MainWindow::on_refresh_port_clicked()
{find_port();
}// 绘图图表初始化
void MainWindow::QPlot_init(QCustomPlot *customPlot)
{// 创建定时器,用于定时生成曲线坐标点数据QTimer *timer = new QTimer(this);timer->start(10);connect(timer, SIGNAL(timeout()), this, SLOT(Plot_TimeData_Update()));// 图表添加两条曲线pGraph1_1 = customPlot->addGraph();pGraph1_2 = customPlot->addGraph();// 设置曲线颜色pGraph1_1->setPen(QPen(Qt::red));pGraph1_2->setPen(QPen(Qt::black));// 设置坐标轴名称customPlot->xAxis->setLabel("X-Times");customPlot->yAxis->setLabel("Channel Data");// 设置y坐标轴显示范围customPlot->yAxis->setRange(-2, 2);// 显示图表的图例customPlot->legend->setVisible(true);// 添加曲线名称pGraph1_1->setName("Channel1");pGraph1_2->setName("Channel2");// 设置波形曲线的复选框字体颜色ui->checkBox_1->setStyleSheet("QCheckBox{color:rgb(255,0,0)}"); // 设定前景颜色,就是字体颜色// 允许用户用鼠标拖动轴范围,用鼠标滚轮缩放,点击选择图形:customPlot->setInteractions(QCP::iRangeDrag | QCP::iRangeZoom | QCP::iSelectPlottables);
}int data_lens = 0;
// 定时器溢出处理槽函数。用来生成曲线的坐标数据。
void MainWindow::Plot_TimeData_Update()
{int lens = plot_buffer.size();if (lens > data_lens){for(int i=data_lens;i<lens;i++){Plot_Show_Update(pPlot1, plot_buffer[i].data1, plot_buffer[i].data2);data_lens++;qDebug()<<"[Plot LOG]data_lens:"<<data_lens<< "size:"<<lens;}}
}// 曲线更新绘图
void MainWindow::Plot_Show_Update(QCustomPlot *customPlot, double n1, double n2)
{cnt++;// 给曲线添加数据pGraph1_1->addData(cnt, n1);pGraph1_2->addData(cnt, n2);// 设置x坐标轴显示范围,使其自适应缩放x轴customPlot->xAxis->setRange( 0, (pGraph1_1->dataCount() > 100) ? (pGraph1_1->dataCount()) : 100);// 更新绘图,这种方式在高填充下太浪费资源。rpQueuedReplot,可避免重复绘图。customPlot->replot(QCustomPlot::rpQueuedReplot);static QTime time(QTime::currentTime());double key = time.elapsed() / 1000.0; // 开始到现在的时间,单位秒//计算帧数static double lastFpsKey;static int frameCount;frameCount++;if (key - lastFpsKey > 1) // 每1秒求一次平均值{// 帧数和数据总数ui->statusbar->showMessage(QString("Refresh rate: %1 FPS, Total data volume: %2").arg(frameCount / (key - lastFpsKey), 0, 'f', 0).arg(customPlot->graph(0)->data()->size() + customPlot->graph(1)->data()->size()),0);lastFpsKey = key;frameCount = 0;}
}/* 清空缓存数据* */
void MainWindow::on_clean_data_clicked()
{qDebug()<< "[Clean Data]";plot_buffer.clear();data_lens = 0;cnt = 0;pGraph1_1->data().data()->clear();pGraph1_2->data().data()->clear();pPlot1->graph(0)->data().clear();pPlot1->graph(1)->data().clear();
}// setVisible设置可见性属性,隐藏曲线,不会对图例有任何影响。推荐使用。
void MainWindow::on_checkBox_1_stateChanged(int arg1)
{if (arg1){pGraph1_1->setVisible(true);}else{pGraph1_1->setVisible(false); // void QCPLayerable::setVisible(bool on)}pPlot1->replot();
}void MainWindow::on_checkBox_2_stateChanged(int arg1)
{if (arg1){pGraph1_2->setVisible(true);}else{pGraph1_2->setVisible(false); // void QCPLayerable::setVisible(bool on)}pPlot1->replot();
}// 保存缓冲区数据为csv文件
void MainWindow::on_savedata_csv_clicked()
{if(plot_buffer.size()<1){QMessageBox::information(this, "提示","当前数据为空");return;}serialport->clear();        //清空缓存区timerserial->stop();serialport->close();        //关闭串口ui->open_port->setEnabled(true);ui->close_port->setEnabled(false);QString csvFile = QFileDialog::getExistingDirectory(this);QDateTime current_date_time =QDateTime::currentDateTime();QString current_date =current_date_time.toString("yyyy_MM_dd_hh_mm");csvFile += tr("/sensor_Save_%1.csv").arg(current_date);if(csvFile.isEmpty()){QMessageBox::information(this,tr("警告"),tr("文件路径错误,无法打开文件,请重试"),QMessageBox::Ok);}else{qDebug()<< csvFile;QFile file(csvFile);if ( file.exists()){//如果文件存在执行的操作,此处为空,因为文件不可能存在}file.open( QIODevice::ReadWrite | QIODevice::Text );QTextStream out(&file);out<<tr("data1,")<<tr("data2,\n");     //写入表头// 创建 CSV 文件for (const auto &data : plot_buffer) {out << QString("%1,%2").arg(data.data1).arg(data.data2) << "\n";}file.close();QMessageBox::information(this, "提示","数据保存成功");}serialport->open(QIODevice::ReadWrite);        //打开串口ui->open_port->setEnabled(false);ui->close_port->setEnabled(true);
}
完整项目链接->完整的项目工程Github链接
