- Python GUI 设计案例
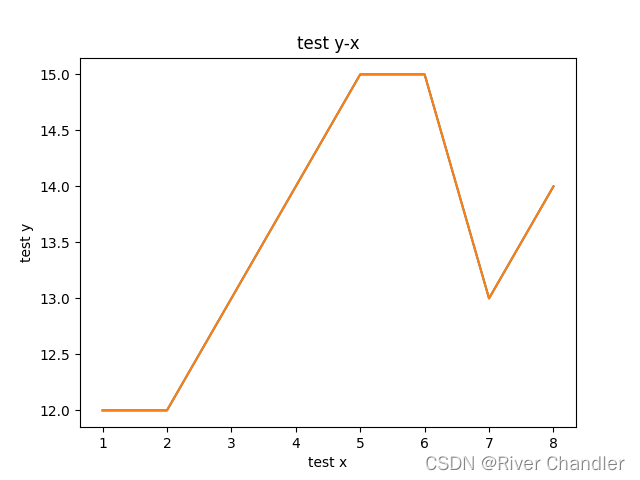
基于matplotlib的 y-x 简单绘图
import tkinter as tk
from tkinter import filedialog
import matplotlib.pyplot as plt
import numpy as npdef select_x_file():x_file_path = filedialog.askopenfilename(title="x")x_file_entry.delete(0, tk.END)x_file_entry.insert(tk.END, x_file_path)def select_y_file():y_file_path = filedialog.askopenfilename(title="y")y_file_entry.delete(0, tk.END)y_file_entry.insert(tk.END, y_file_path)def plot_graph():x_file_path = x_file_entry.get()y_file_path = y_file_entry.get()x_data = np.loadtxt(x_file_path)y_data = np.loadtxt(y_file_path)if len(x_data) != len(y_data):result_text.set("len x not equals len y")else:plt.plot(x_data, y_data)plt.title(title_entry.get())plt.xlabel(xlabel_entry.get())plt.ylabel(ylabel_entry.get())plt.show()def save_graph():save_path = filedialog.asksaveasfilename(title="save graphic", defaultextension=".png")plt.savefig(save_path)window = tk.Tk()
window.title("PLOT y-x GRAPH")x_file_label = tk.Label(window, text="x path:")
x_file_label.grid(row=0, column=0)x_file_entry = tk.Entry(window, width=50)
x_file_entry.grid(row=0, column=1)x_button = tk.Button(window, text="file x ", command=select_x_file)
x_button.grid(row=0, column=2)y_file_label = tk.Label(window, text="y path:")
y_file_label.grid(row=1, column=0)y_file_entry = tk.Entry(window, width=50)
y_file_entry.grid(row=1, column=1)y_button = tk.Button(window, text="file y", command=select_y_file)
y_button.grid(row=1, column=2)plot_button = tk.Button(window, text="PLOT!", command=plot_graph)
plot_button.grid(row=2, column=0, columnspan=3)title_label = tk.Label(window, text="TITLE")
title_label.grid(row=3, column=0)title_entry = tk.Entry(window, width=50)
title_entry.grid(row=3, column=1)xlabel_label = tk.Label(window, text="x LABEL")
xlabel_label.grid(row=4, column=0)xlabel_entry = tk.Entry(window, width=50)
xlabel_entry.grid(row=4, column=1)ylabel_label = tk.Label(window, text="y LABEL")
ylabel_label.grid(row=5, column=0)ylabel_entry = tk.Entry(window, width=50)
ylabel_entry.grid(row=5, column=1)save_button = tk.Button(window, text="SAVE GRAPH", command=save_graph)
save_button.grid(row=6, column=0, columnspan=3)window.geometry("600x300")
window.mainloop()