目录
1、南丁格尔玫瑰图
2、锥形柱状图
3、渐变曲线图
4、曲线图
1、南丁格尔玫瑰图
![]()
option = {title: {text: '作物占比',left: 50, // 组件离容器左侧的距离top: 20},legend: {top: '52%',x: 'center',y: 'top',width: 180,height: 60,itemGap: 30,itemWidth: 15,itemHeight: 15,},tooltip: {//触发方式trigger: 'item',},series:{type: 'pie',radius: [20, 90], //饼图半径,第一项是内半径,第二项是外半径,内半径设大可以显示成圆环图center: ['50%', '32%'], // 饼图的中心(圆心)坐标,第一项是横坐标,第二项是纵坐标roseType: 'radius', //定义饼形图变成南丁格尔玫瑰图,两种模式:使用radius可以用圆心角展现数据百分比,半径来展示数据大小;使用area圆心角相同,通过半径展示数据itemStyle: {borderRadius: 5},//单个扇区的标签配置label: {show: false},//高亮样式设置emphasis: {label: {show: false}},itemStyle: {normal: {label: {show: false},labelLine: {show: false}}},color: ['#87CEFA', '#66CD00', '#EEAD0E', '#EE7942', '#87CEFA', '#6B8E23', '#FF8C00', '#9370DB', '#8B8970', '#CAE1FF'],data: [{ value: 36, name: '小麦' },{ value: 33, name: '烟草' },{ value: 30, name: '玉米' },{ value: 26, name: '荔枝' },{ value: 21, name: '水稻' },{ value: 16, name: '石榴' },{ value: 12, name: '花生' },{ value: 10, name: '番茄' },{ value: 8, name: '马铃薯' },{ value: 7, name: '葡萄' },],}};2、锥形柱状图

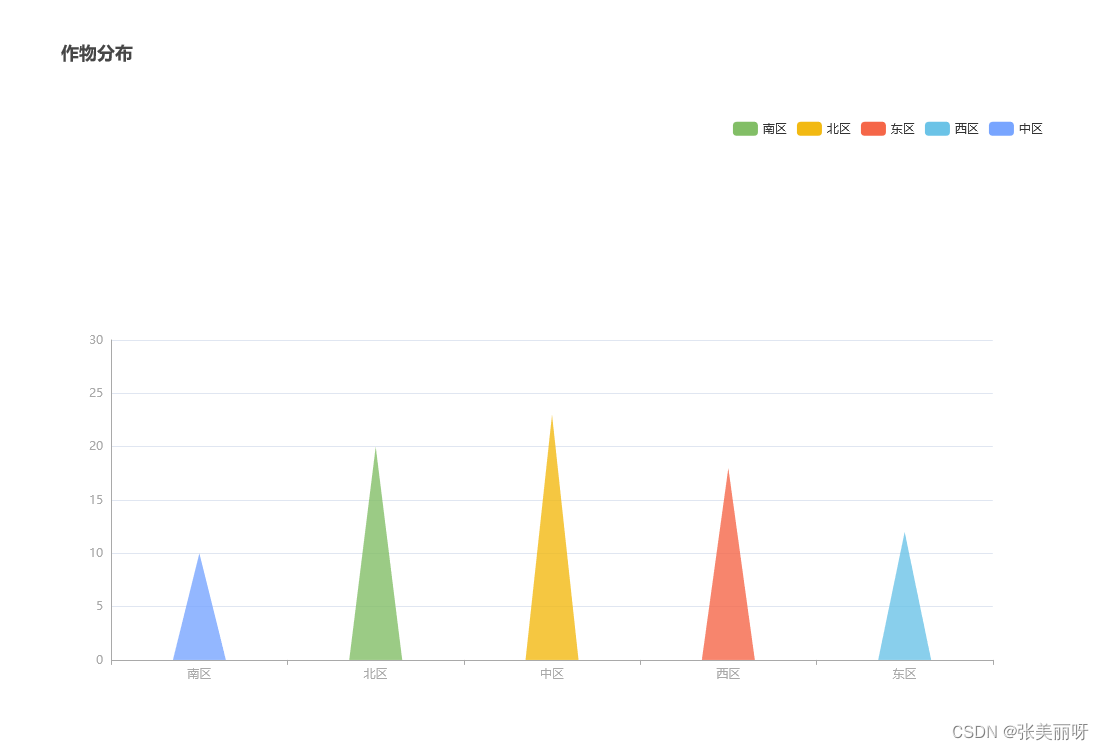
option = {title: {text: '作物分布',left: '5%',top: '5%',},legend: {data: ['南区', '北区', '东区', '西区', '中区'],right: '5%',top: '15%'},grid: {height: 320,bottom: '14%',},tooltip: {trigger: 'axis',axisPointer: {type: 'none'},formatter: function (params) {return params[0].name + ': ' + params[0].value;}},xAxis: {data: ['南区', '北区', '中区', '西区', '东区'],axisLine: {lineStyle: {color: '#a9a9a9'  // X轴线条颜色},},axisLabel: {textStyle: {color: '#a9a9a9'    // 文本颜色  灰色}},},yAxis: {type: 'value',axisLine: {show: true,lineStyle: {color: '#a9a9a9'  // Y轴线条颜色},},axisLabel: {textStyle: {color: '#a9a9a9'   // Y轴文本颜色}},// max: 30,min: 0,splitNumber: 5,max: 30,min: 0,splitNumber: 5,},color: ['#78a5ff', '#82be66', '#f2b912', '#f56648', '#6bc3e7'],series: [{type: 'pictorialBar',symbol: 'triangle', // 三角形//位置偏移barCategoryGap: '-10%',//图形宽度barWidth: 53,//图形形状// symbol: 'path://M150 50 L130 130 L170 130  Z',itemStyle: {normal: {opacity: 0.8,color: function (params) {//注意,如果颜色太少的话,后面颜色不会自动循环,最好多定义几个颜色var colorList = ['#78a5ff', '#82be66', '#f2b912', '#f56648', '#6bc3e7'];return colorList[params.dataIndex]}},emphasis: {opacity: 1},},data: [10, 20, 23, 18, 12],z: 10,},{name: '南区',type: 'bar',},{name: '北区',type: 'bar',},{name: '东区',type: 'bar',}, {name: '西区',type: 'bar',}, {name: '中区',type: 'bar',}]
};
3、渐变曲线图

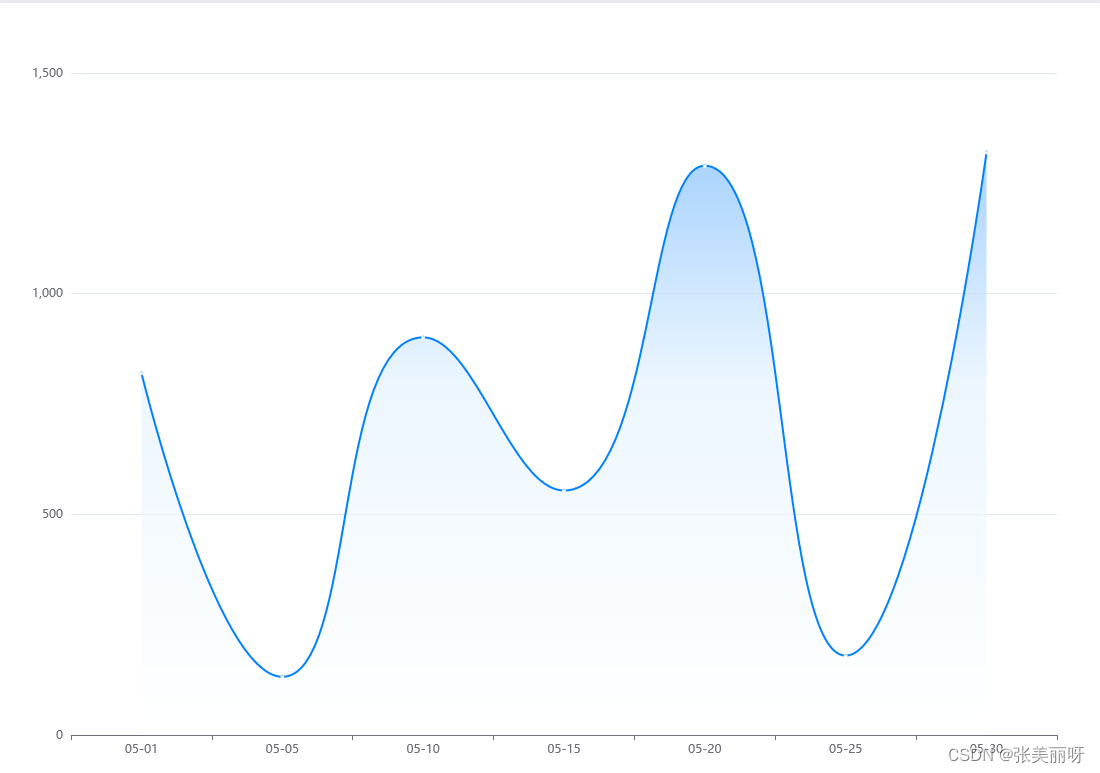
option = {title: {left: "5%",top: "5%",},tooltip: {trigger: "axis",axisPointer: {type: "cross",label: {backgroundColor: "#6a7985",},},},color: ["#0080ff", "#4cd5ce"],grid: {left: "3%",right: "4%",bottom: "3%",containLabel: true,},xAxis: [{type: "category",// boundaryGap: false,data: ["05-01", "05-05", "05-10", "05-15", "05-20", "05-25", "05-30"], //时间根据筛选日期决定}],yAxis: [{type: "value",min: 0,splitNumber: 3,},],series: [{type: 'line',smooth: true,   // 设置平滑曲线itemStyle: {normal: { //颜色渐变函数 前四个参数分别表示四个位置依次为左、下、右、上color: new echarts.graphic.LinearGradient(0, 0, 0, 1, [{offset: 0, color: '#81befd' // 0% 处的颜色}, {offset: 0.4, color: '#e4f2ff' // 100% 处的颜色}, {offset: 1, color: '#fff' // 100% 处的颜色}]), //背景渐变色    lineStyle: {        // 系列级个性化折线样式  width: 2,type: 'solid',color: "#0180ff" //折线的颜色}},emphasis: {color: '#0180ff',lineStyle: {        // 系列级个性化折线样式  width: 5,type: 'solid',color: "0180ff"}}},//线条样式symbolSize: 2, //折线点的大小label: {normal: {// show: true,  // 折点数字是否显示position: 'top'}},areaStyle: { normal: {} },data: [820, 132, 901, 554, 1290, 180, 1320],}],
};
4、曲线图

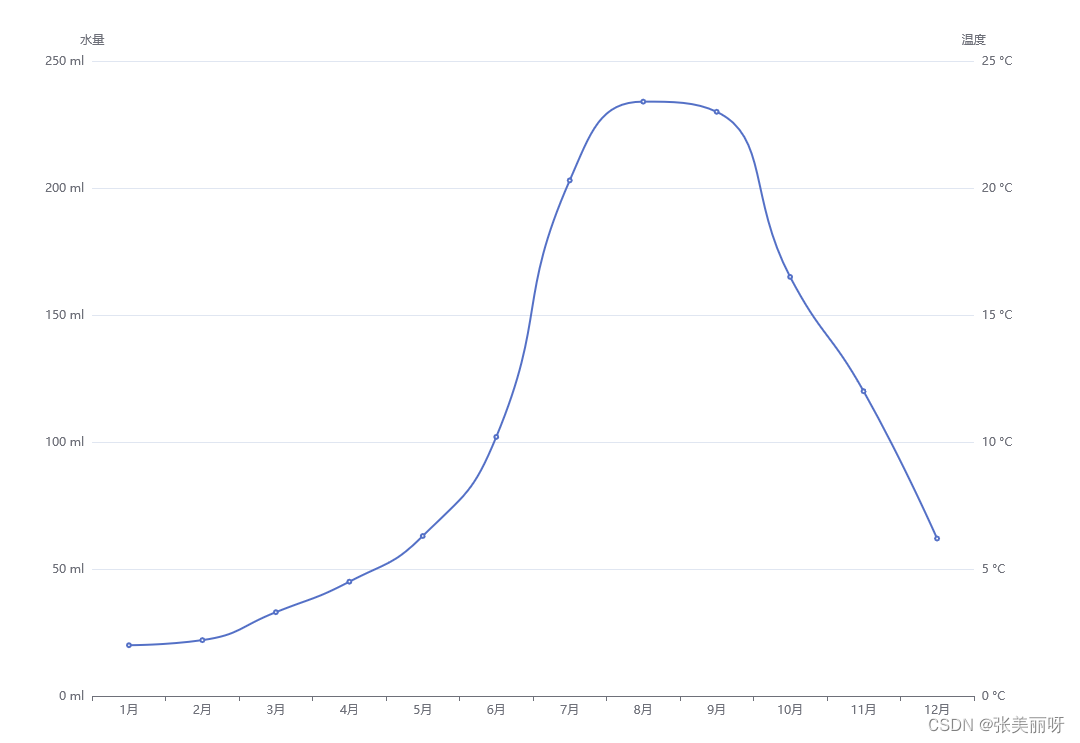
option = {tooltip: {trigger: 'axis',axisPointer: {type: 'cross',crossStyle: {color: '#999'}}},xAxis: [{type: 'category',data: ['1月','2月','3月','4月','5月','6月','7月','8月','9月','10月','11月','12月'],axisPointer: {type: 'shadow'}}],yAxis: [{type: 'value',name: '水量',min: 0,max: 250,interval: 50,axisLabel: {formatter: '{value} ml'}},{type: 'value',name: '温度',min: 0,max: 25,interval: 5,axisLabel: {formatter: '{value} °C'}}],series: [{name:'平均温度',type:'line',smooth: true,yAxisIndex: 1,data:[2.0, 2.2, 3.3, 4.5, 6.3, 10.2, 20.3, 23.4, 23.0, 16.5, 12.0, 6.2]}]};


