文章目录
- 一、在ubuntu中使用apt包下载Perf
- 二、使用源码安装Perf,并移植到arm-linux环境下
- 三、使用perf
- 四、Perf的功能介绍
系统:Ubuntu18.04系统
内核版本:5.4.0-150-generic(通过uname -r查看)
一、在ubuntu中使用apt包下载Perf
输入perf命令,提示:
Command 'perf' not found, but can be installed with:apt install linux-tools-common
Please ask your administrator.
按照提示安装linux-tools-common:
sudo apt-get install linux-tools-common
查看perf -v,提示:
WARNING: perf not found for kernel 5.4.0-150You may need to install the following packages for this specific kernel:linux-tools-5.4.0-150-genericlinux-cloud-tools-5.4.0-150-genericYou may also want to install one of the following packages to keep up to date:linux-tools-genericlinux-cloud-tools-generic
由于linux有不同的发行版本,内核工具也不同,提示的意思是可以下载特定的内核版本下的tools,根据命令行的提示,使用uname -r 查看内核版本,并下载
sudo apt-get install linux-tools-5.4.0-150-generic
再次执行perf -v可以得到当前版本
perf version 5.4.233
参考博文:Perf的安装与简单使用
二、使用源码安装Perf,并移植到arm-linux环境下
perf是一种系统级性能分析工具,它涉及内核调用,所以安装需要知道内核版本。查看arm-linux平台的内核的版本,到官网上去下载特定的内核源码
在开发板终端输入
uname -r
5.4.31
去官网上下载内核源码,可以手动下载,也可以使用wget,以下操作在ubuntu平台
-
Linux内核源码下载网站:Index of /sites/ftp.kernel.org/pub/linux/kernel/ (sjtu.edu.cn) 或者 Index of /kernel/linux/kernel/
-
wget下载,例如:
wget http://ftp.sjtu.edu.cn/sites/ftp.kernel.org/pub/linux/kernel/v5.x/linux-5.4.31.tar.gz
下载完毕之后,解压内核源代码
tar -zxvf linux-5.4.31.tar.gz
进入如下目录
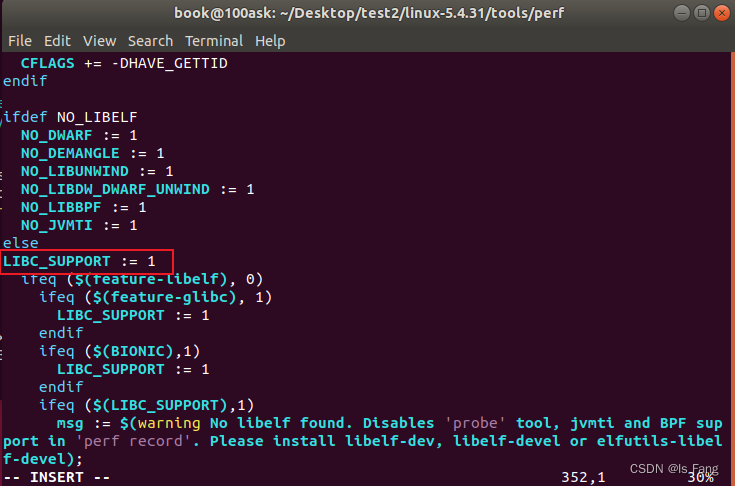
cd linux-5.4.31/tools/perf/
修改Makefile.conf文件,添加LIBC_SUPPORT := 1
源码级安装,如有些依赖包没有安装,得安装一下,Perf源码安装的依赖:ubuntu源码安装性能分析工具perf - 知乎 (zhihu.com)
make -j4 && make install
当前文件夹生成perf应用,
file perf
输出结果:
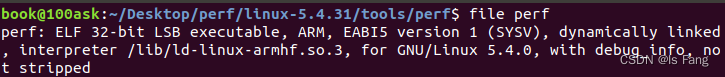
将编译得到的应用发送到开发板上,运行成功
如果遇到其他问题可以参考博文:
linux perf arm,perf arm交叉编译
perf使用的博文:
perf性能分析工具使用分享
打卡不停更#Linux perf工具使用
perf学习-linux自带性能分析工具
三、使用perf
编写示例程序
#include <stdio.h>
void print(void)
{int i = 0;while(1){i++;}
}
int main ()
{print();return 0;
}
编译目标位可执行文件
gcc -g test.c -o test
使用perf分析性能
perf stat test
出现报错
Error:
You may not have permission to collect stats.Consider tweaking /proc/sys/kernel/perf_event_paranoid,
which controls use of the performance events system by
unprivileged users (without CAP_SYS_ADMIN).The current value is 3:-1: Allow use of (almost) all events by all usersIgnore mlock limit after perf_event_mlock_kb without CAP_IPC_LOCK
>= 0: Disallow ftrace function tracepoint by users without CAP_SYS_ADMINDisallow raw tracepoint access by users without CAP_SYS_ADMIN
>= 1: Disallow CPU event access by users without CAP_SYS_ADMIN
>= 2: Disallow kernel profiling by users without CAP_SYS_ADMINTo make this setting permanent, edit /etc/sysctl.conf too, e.g.:kernel.perf_event_paranoid = -1
根据提示到指定文件夹中查找该变量,发现没有,经过百度后替换perf_event_paranoid文件夹内容为-1,注意修改内核文件要加sudo
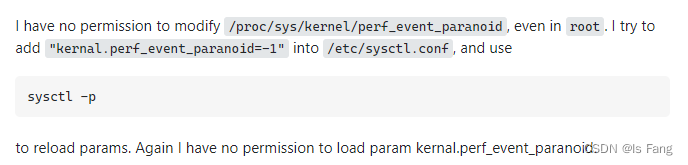
参考博文:perf have no permission to collect stats
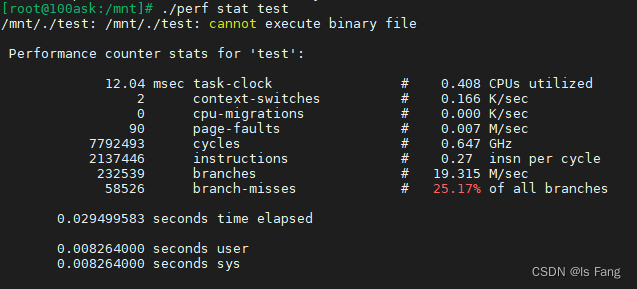
重新执行
perf stat test
输出结果如下
Performance counter stats for 'test':0.74 msec task-clock # 0.484 CPUs utilized 0 context-switches # 0.000 K/sec 0 cpu-migrations # 0.000 K/sec 58 page-faults # 0.079 M/sec <not supported> cycles <not supported> instructions <not supported> branches <not supported> branch-misses 0.001520723 seconds time elapsed0.001628000 seconds user0.000000000 seconds sys
四、Perf的功能介绍
可以使用许多 perf 命令来获取有关 CPU 使用情况、内存使用情况、I/O 使用情况等信息
>$ perf --helpusage: perf [--version] [--help] [OPTIONS] COMMAND [ARGS]The most commonly used perf commands are:annotate Read perf.data (created by perf record) and display annotated codearchive Create archive with object files with build-ids found in perf.data filebench General framework for benchmark suitesbuildid-cache Manage build-id cache.buildid-list List the buildids in a perf.data filec2c Shared Data C2C/HITM Analyzer.config Get and set variables in a configuration file.data Data file related processingdiff Read perf.data files and display the differential profileevlist List the event names in a perf.data fileftrace simple wrapper for kernel's ftrace functionalityinject Filter to augment the events stream with additional informationkallsyms Searches running kernel for symbolskmem Tool to trace/measure kernel memory propertieskvm Tool to trace/measure kvm guest oslist List all symbolic event typeslock Analyze lock eventsmem Profile memory accessesrecord Run a command and record its profile into perf.data #可以记录指定进程的指定事件report Read perf.data (created by perf record) and display the profile #可以生成一份报告,显示前面记录的性能参数sched Tool to trace/measure scheduler properties (latencies)script Read perf.data (created by perf record) and display trace outputstat Run a command and gather performance counter statistics #可以查看指定命令的CPU和内存使用情况test Runs sanity tests.timechart Tool to visualize total system behavior during a workloadtop System profiling tool.version display the version of perf binaryprobe Define new dynamic tracepointstrace strace inspired toolSee 'perf help COMMAND' for more information on a specific command.
https://blog.csdn.net/qq_38131812/article/details/123048333
https://zhuanlan.zhihu.com/p/498100484