之前有记录过一致性分析中的天选之子ICC(传送),也提到过Bland-Altman图,Bland-Altman图在一致性分析中作为一种既定量又定性的方法,还有着高颜值的表达展现,受到了广泛地应用。
如下图所示,Bland-Altman分析主打一个高端大气:
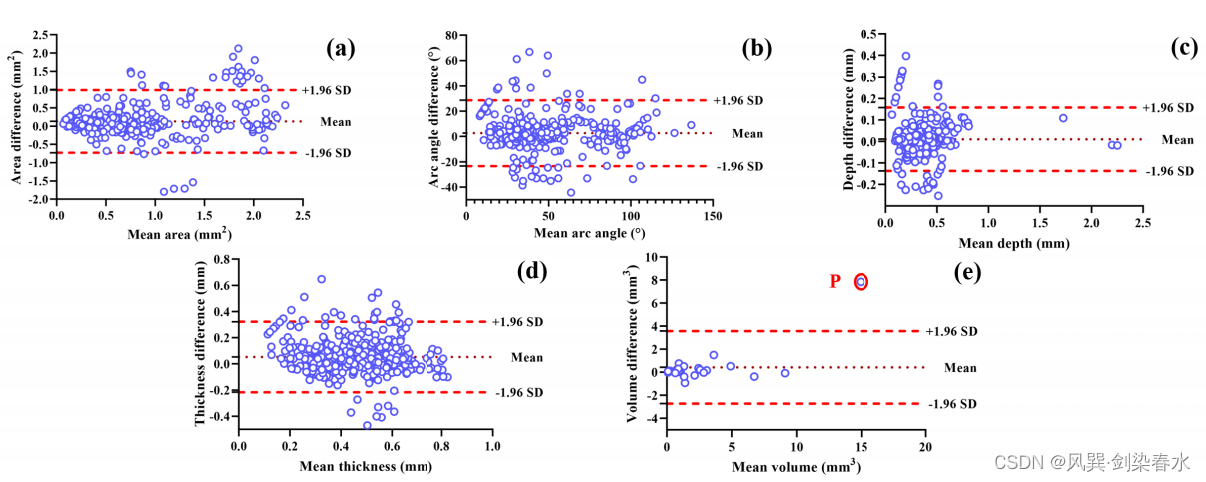
图源论文:Comprehensive Assessment of Coronary Calcification in Intravascular OCT Using a Spatial-Temporal Encoder-Decoder Network
1. Bland-Altman图简介
Bland-Altman分析主要运用到什么场景呢?比较两种方法测量的一致性。例如:测量脑出血的体积,医生手动测量会得到一组值,而基于深度学习的分割模型测量会得到另一组值,利用Bland-Altman分析可以评价模型与医生测量结果之间的一致性与偏差。简言之,衡量模型是否可靠,能不能用于临床实践。
此外,Bland-Altman图也可用于评估一种测量技术的可重复性,通过对一系列受试者使用单一方法进行重复测量进行比较。在这种情况下,Bland-Altman图还可以用来检查方法的可变性或精确度是否与被测量的特征的大小有关。
那么Bland-Altman图表达了什么呢?Bland-Altman图是散点图,设对 K K K 个样本的测量,医生测量值为 X = { x 1 , … , x K } X = \left\{ {{x_1}, \ldots ,{x_K}} \right\} X={x1,…,xK},模型测量值为 Y = { y 1 , … , y K } Y = \left\{ {{y_1}, \ldots ,{y_K}} \right\} Y={y1,…,yK},对于每一个样本,一般情况下,Bland-Altman图中的纵坐标为 x i {x_i} xi 与 y i {y_i} yi 的差值,横坐标为 x i {x_i} xi 与 y i {y_i} yi 差值的均值。
2. MedCalc操作指南
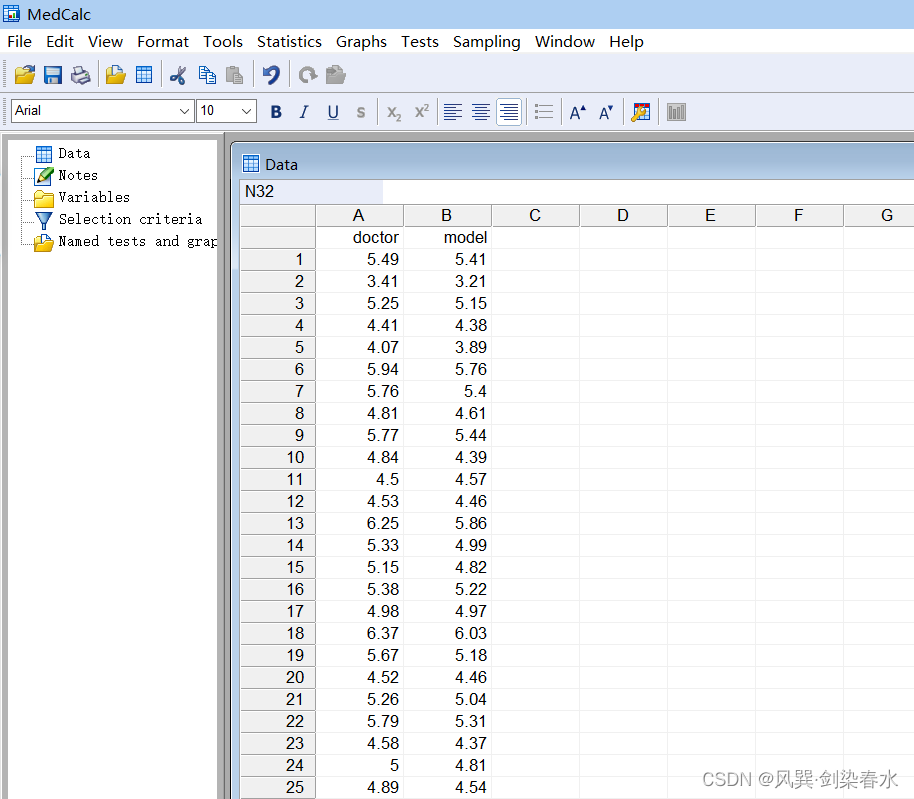
(1)数据录入:File→New 新建一个data,录入数据,类似于excel表格
(2)绘制Bland-Altman图:Statistics→Method comparison→Bland & Altman plot
出现以下对话框
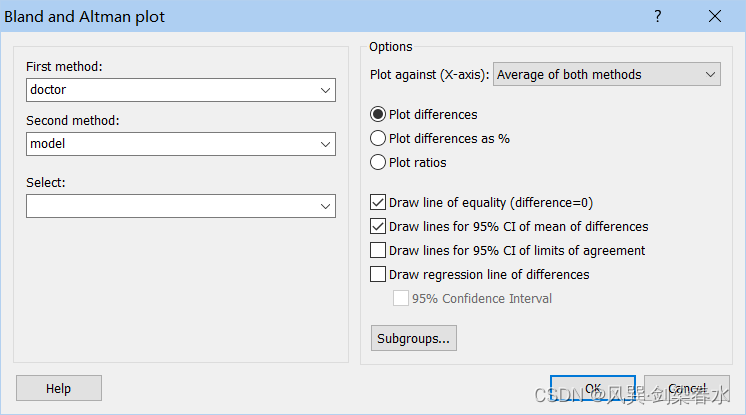
①First/Second method: 分别选择两组数据
②Plot against(X-axis): 横坐标x轴,一般选择Average of both methods
Average of both methods: 两组数据的平均值
First/Second method: 以其中一组数据为横坐标
Geometric mean of both methods: 两组数据的几何平均数
③纵坐标y轴:
Plot differences: 两组数据的差值
Plot difference as %: 两组数据差值占均值的百分比,当差异的可变性随着测量幅度的增加而增加时,此选项非常有用。
Plot ratios: 绘制两组数据的比值而非差值,当差异的可变性随着测量幅度的增加而增加时,该选项也很有用,然而,当First/Second method任何一种包含零值时,程序将给出警告。
④显示Options:
Draw line of equality (difference=0) : 绘制差值 d=0 的横线,用于检测系统差异
Draw lines for 95%CI of mean of difference: 绘制差值平均值的95%置信区间,平均差异的95% CI说明了系统性差异的大小。如果差值 d=0 的横线不在区间内,则存在显著的系统差异。
Draw lines for 95% CI of limits of agreement: 显示一致性上限和下限的95%置信区间的线条。
Draw regression line of differences: 绘制差值的回归线,并可以给出回归线 95% 置信区间(95% Confidence Interval)
选择好后,点击确定,得到Bland-Altman图如下:
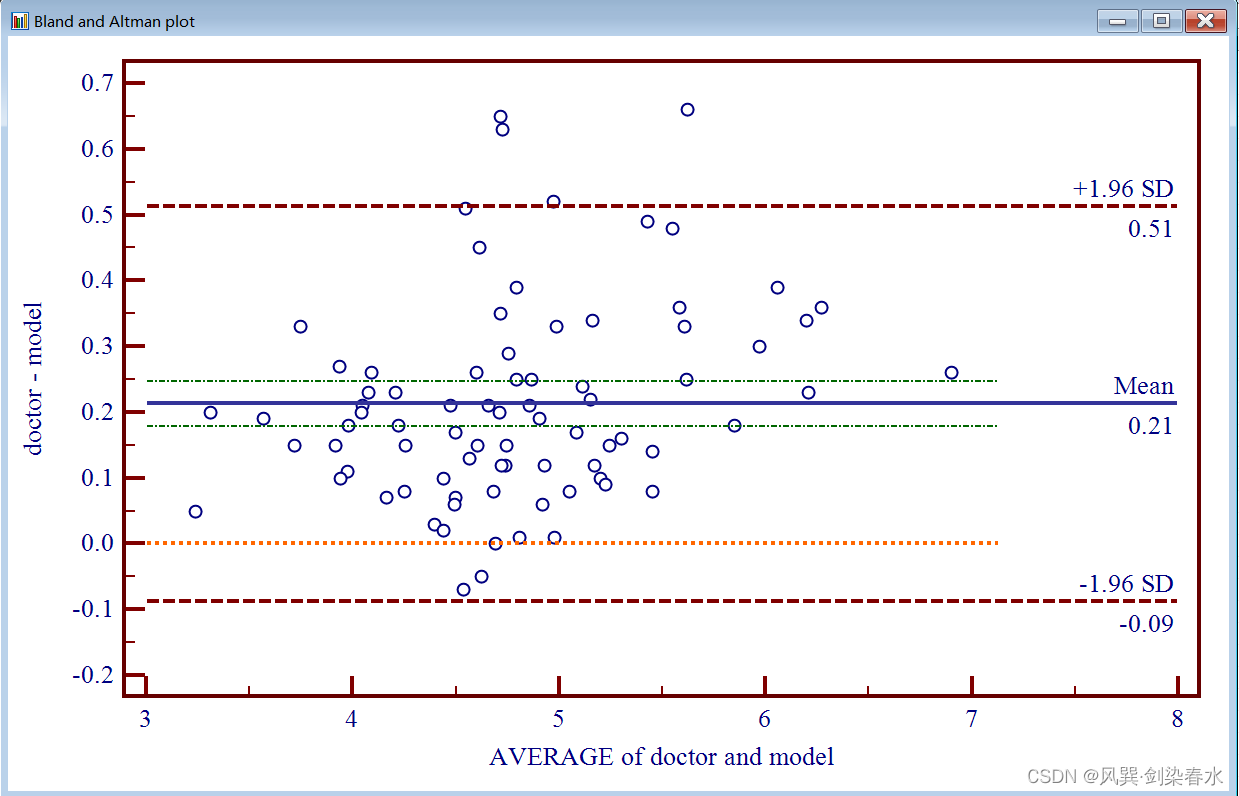
图中上下两条 棕色水平虚线 表示 95%一致性界限的上下限,中间的 蓝色水平实线 代表差值的平均值,橘黄色水平虚线 表示差值平均值为 0 的位置,绿色的虚点画线 为差值平均值的95%置信区间; 两种方法测量结果的一致程度越高,代表差值平均数的线( 蓝色实线 )就越接近代表差值平均数为 0 的线( 橘黄色虚线 )。
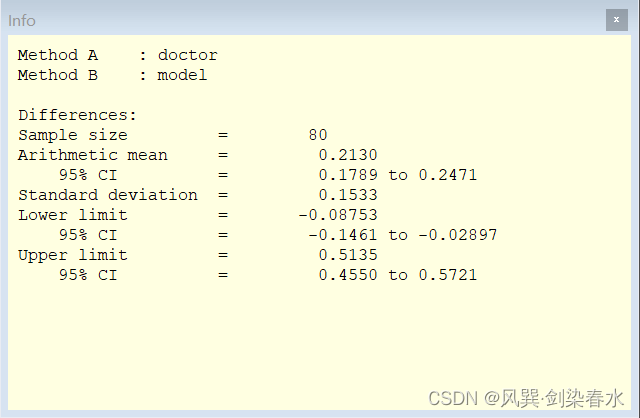
在Bland-Altman图上右键→info 可以查看详细数据信息
3. Python实现
当然了,Python也可以方便地完成Bland-Altman图绘制
import pandas as pd
import numpy as np
import seaborn as sns
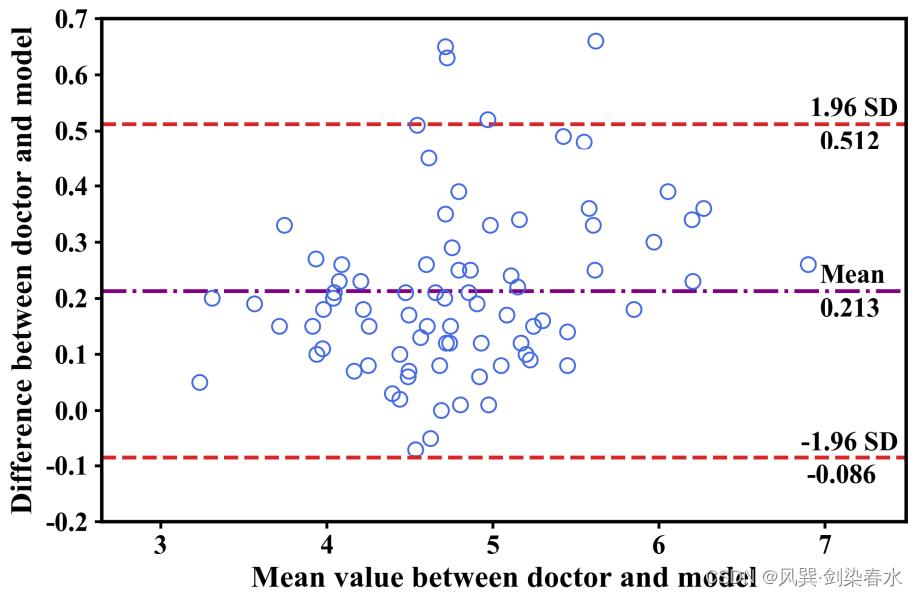
import matplotlib.pyplot as pltdef bland_altman_plot(data1, data2, *args, **kwargs):data1 = np.asarray(data1)data2 = np.asarray(data2)mean = np.mean([data1, data2], axis=0)  # data1与data2的均值diff = data1 - data2  # data1与data2的差值md = np.mean(diff)  # data1与data2差值的平均值sd = np.std(diff, axis=0)  # data1与data2差值的标准差plt.rcParams['font.sans-serif'] = ['Times New Roman']plt.rcParams['axes.facecolor'] = 'whitesmoke'plt.rcParams['axes.unicode_minus'] = Falsefig = plt.figure(figsize=(7.5, 5), dpi=300)ax = plt.axes()ax.set_facecolor('white')ax.set_xmargin(0.16)plt.axhline(md, color='purple', linestyle='-.', lw=2, zorder=1)plt.axhline(md + 1.96 * sd, color=sns.color_palette()[3], linestyle='--', lw=2, zorder=1)print('差值的均值为:%.3f (%.3f ~ %.3f)' % (md, md - 1.96 * sd, md + 1.96 * sd))plt.axhline(md - 1.96 * sd, color=sns.color_palette()[3], linestyle='--', lw=2)plt.scatter(mean, diff, *args, **kwargs, marker="o", s=60, color="", edgecolor="royalblue", alpha=1, zorder=2)plt.ylim(-0.2, 0.7)ax.spines['top'].set_linewidth(1.8)ax.spines['right'].set_linewidth(1.8)ax.spines['bottom'].set_linewidth(1.8)ax.spines['left'].set_linewidth(1.8)# 区间上界plt.text(max(mean) + 0.008, md + 1.96 * sd + 0.015, '1.96 SD', fontsize=14)plt.text(max(mean) + 0.070, md + 1.96 * sd - 0.045, '%.3f' % (md + 1.96 * sd), fontsize=14)# 均值线plt.text(max(mean) + 0.070, md + 0.015, 'Mean', fontsize=14)plt.text(max(mean) + 0.070, md - 0.045, '%.3f' % md, fontsize=14)# 区间下界plt.text(max(mean) - 0.045, md - 1.96 * sd + 0.015, '-1.96 SD', fontsize=14)plt.text(max(mean) - 0.010, md - 1.96 * sd - 0.045, '%.3f' % (md - 1.96 * sd), fontsize=14)plt.xlabel("Mean value between doctor and model", fontsize=16)  plt.ylabel("Difference between doctor and model", fontsize=16)plt.gcf().subplots_adjust(bottom=0.15)plt.tick_params(width=1.5, labelsize=14)  plt.show()data1 = [5.49, 3.41, 5.25, 4.41, 4.07, 5.94, 5.76, 4.81, 5.77, 4.84,4.50, 4.53, 6.25, 5.33, 5.15, 5.38, 4.98, 6.37, 5.67, 4.52,5.26, 5.79, 4.58, 5.00, 4.89, 4.80, 4.69, 4.80, 4.92, 5.52,4.03, 3.26, 4.99, 5.17, 3.91, 4.07, 4.96, 4.81, 3.99, 7.03,3.99, 5.74, 4.73, 5.04, 4.72, 5.23, 4.78, 4.58, 4.45, 4.22,4.95, 5.23, 4.63, 4.82, 4.90, 4.32, 3.79, 4.99, 4.29, 4.76,4.60, 4.20, 6.45, 4.15, 4.68, 4.99, 5.09, 5.23, 5.04, 4.31, 5.27, 4.33, 5.95, 3.66, 6.32, 4.49, 4.14, 5.32, 6.12, 4.19]data2 = [5.41, 3.21, 5.15, 4.38, 3.89, 5.76, 5.40, 4.61, 5.44, 4.39, 4.57, 4.46, 5.86, 4.99, 4.82, 5.22, 4.97, 6.03, 5.18, 4.46, 5.04, 5.31, 4.37, 4.81, 4.54, 4.29, 4.69, 4.68, 4.67, 5.38, 3.92, 3.21, 4.87, 5.00, 3.58, 3.80, 4.75, 4.80, 3.89, 6.77, 3.84, 5.49, 4.47, 4.39, 4.64, 5.11, 4.66, 4.41, 4.43, 3.96, 4.89, 4.99, 4.50, 4.67, 4.61, 4.09, 3.64, 4.60, 4.21, 4.55,4.65, 4.13, 6.09, 3.94, 4.53, 4.74, 5.01, 4.71, 4.41, 4.13, 5.18, 4.18, 5.29, 3.47, 6.09, 4.39, 3.94, 5.17, 5.82, 3.96]bland_altman_plot(data1, data2)
如下图所示:主打一个个性设置
