文章目录
- 1. 监控指标采集
- 1.1 zk版本高于3.6.0监控指标采集
- 1.2 zk版本低于3.6.0监控指标采集
- 1.3 配置promethues采集和大盘
- 2. 核心告警指标
- 3. 参考文章
探讨zk的监控数据采集方式以及需要关注的核心指标,便于日常生产进行监控和巡检。
1. 监控指标采集
- 3.6.0 版本后,原生支持开放指标接口供Prometheus采集。
- 如果低于3.6.0 版本,只能使用zookeeper-exporter进行采集
1.1 zk版本高于3.6.0监控指标采集
详细的可以参考 ZooKeeper Monitor Guide
具体操作如下
1, 调整zoo.cfg配置,增加配置
metricsProvider.className=org.apache.zookeeper.metrics.prometheus.PrometheusMetricsProvider
metricsProvider.httpPort=7000
metricsProvider.exportJvmInfo=true
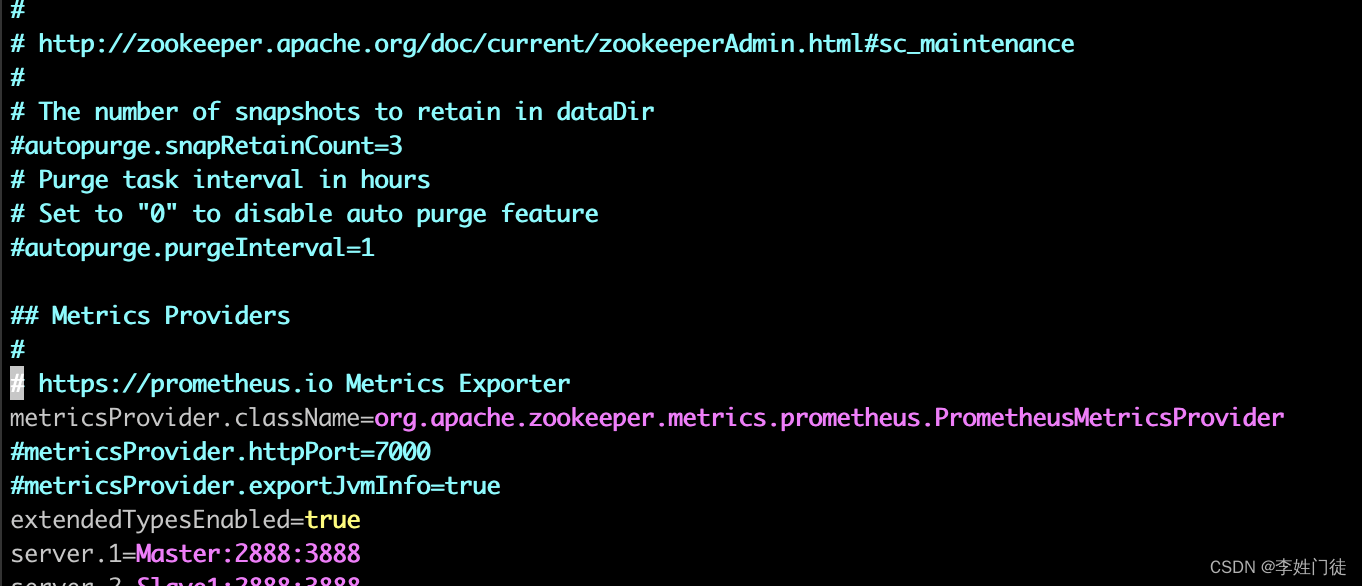
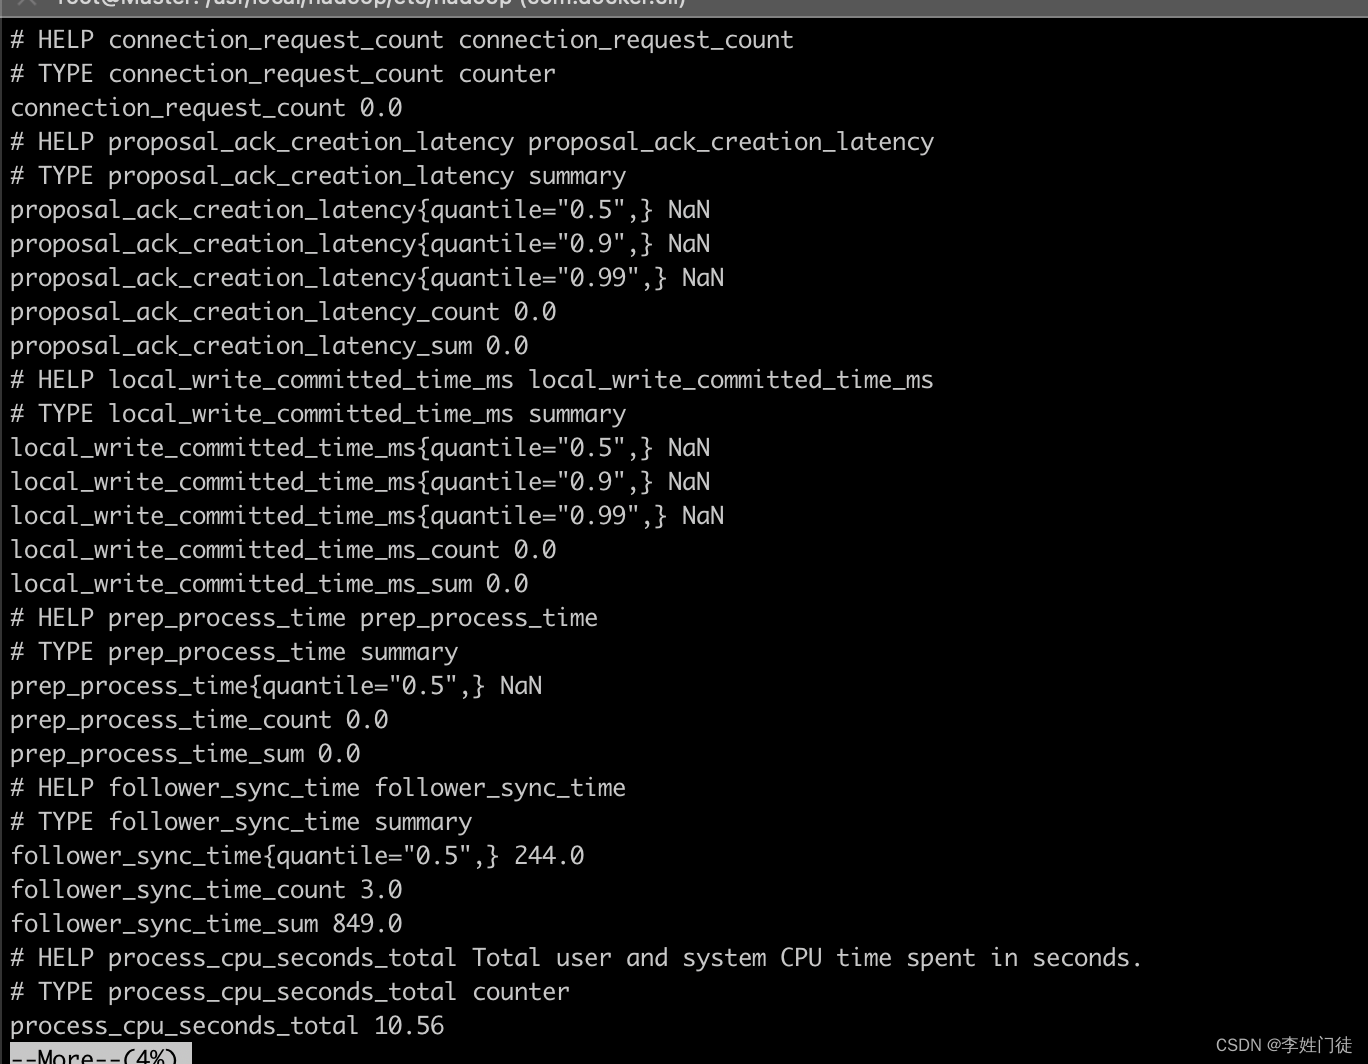
指标的暴露接口是7000,完成配置并重启zk后可以获取对应的指标。
curl localhost:7000/metrics
1.2 zk版本低于3.6.0监控指标采集
可以通过 zookeeper-exporter 下载zookeeper-exporter的安装包,并进行配置。
进程启动配置
./zookeeper-exporter -listen 0.0.0.0:7000 -zk-hosts Master:2181,Slave1:2181,Slave2:2181
更多使用方法可以参考 文档
指标的暴露接口是7000,完成配置并重启zk后可以获取对应的指标。
curl localhost:7000/metrics
1.3 配置promethues采集和大盘
完成指标采集后,可以通过prometheus配置监控、告警和大盘。
配置prometheus的指标采集任务
- job_name: zkstatic_configs:- targets: ['172.19.0.2:7000','172.19.0.3:7000','172.19.0.4:7000']
完成prometheus监控指标后,就可以配置grafana大盘,grafana的dashboard官网可以下载很多优秀的大盘进行借鉴,本文不再追溯。
2. 核心告警指标
在 ZooKeeper Monitor Guide中记录了zk的关键指标进行配置告警,可以参考。
groups:
- name: zk-alert-examplerules:- alert: ZooKeeper server is downexpr:  up == 0for: 1mlabels:severity: criticalannotations:summary: "Instance {{ $labels.instance }} ZooKeeper server is down"description: "{{ $labels.instance }} of job {{$labels.job}} ZooKeeper server is down: [{{ $value }}]."- alert: create too many znodesexpr: znode_count > 1000000for: 1mlabels:severity: warningannotations:summary: "Instance {{ $labels.instance }} create too many znodes"description: "{{ $labels.instance }} of job {{$labels.job}} create too many znodes: [{{ $value }}]."- alert: create too many connectionsexpr: num_alive_connections > 50 # suppose we use the default maxClientCnxns: 60for: 1mlabels:severity: warningannotations:summary: "Instance {{ $labels.instance }} create too many connections"description: "{{ $labels.instance }} of job {{$labels.job}} create too many connections: [{{ $value }}]."- alert: znode total occupied memory is too bigexpr: approximate_data_size /1024 /1024 > 1 * 1024 # more than 1024 MB(1 GB)for: 1mlabels:severity: warningannotations:summary: "Instance {{ $labels.instance }} znode total occupied memory is too big"description: "{{ $labels.instance }} of job {{$labels.job}} znode total occupied memory is too big: [{{ $value }}] MB."- alert: set too many watchexpr: watch_count > 10000for: 1mlabels:severity: warningannotations:summary: "Instance {{ $labels.instance }} set too many watch"description: "{{ $labels.instance }} of job {{$labels.job}} set too many watch: [{{ $value }}]."- alert: a leader election happensexpr: increase(election_time_count[5m]) > 0for: 1mlabels:severity: warningannotations:summary: "Instance {{ $labels.instance }} a leader election happens"description: "{{ $labels.instance }} of job {{$labels.job}} a leader election happens: [{{ $value }}]."- alert: open too many filesexpr: open_file_descriptor_count > 300for: 1mlabels:severity: warningannotations:summary: "Instance {{ $labels.instance }} open too many files"description: "{{ $labels.instance }} of job {{$labels.job}} open too many files: [{{ $value }}]."- alert: fsync time is too longexpr: rate(fsynctime_sum[1m]) > 100for: 1mlabels:severity: warningannotations:summary: "Instance {{ $labels.instance }} fsync time is too long"description: "{{ $labels.instance }} of job {{$labels.job}} fsync time is too long: [{{ $value }}]."- alert: take snapshot time is too longexpr: rate(snapshottime_sum[5m]) > 100for: 1mlabels:severity: warningannotations:summary: "Instance {{ $labels.instance }} take snapshot time is too long"description: "{{ $labels.instance }} of job {{$labels.job}} take snapshot time is too long: [{{ $value }}]."- alert: avg latency is too highexpr: avg_latency > 100for: 1mlabels:severity: warningannotations:summary: "Instance {{ $labels.instance }} avg latency is too high"description: "{{ $labels.instance }} of job {{$labels.job}} avg latency is too high: [{{ $value }}]."- alert: JvmMemoryFillingUpexpr: jvm_memory_bytes_used / jvm_memory_bytes_max{area="heap"} > 0.8for: 5mlabels:severity: warningannotations:summary: "JVM memory filling up (instance {{ $labels.instance }})"description: "JVM memory is filling up (> 80%)\n labels: {{ $labels }}  value = {{ $value }}\n"
3. 参考文章
- ZooKeeper Monitor Guide