数据预处理与线性回归(Linear regression)预测
数据集下载
# data文件夹中包含数据集文件
git https://github.com/LittleGlowRobot/machine_learning.git
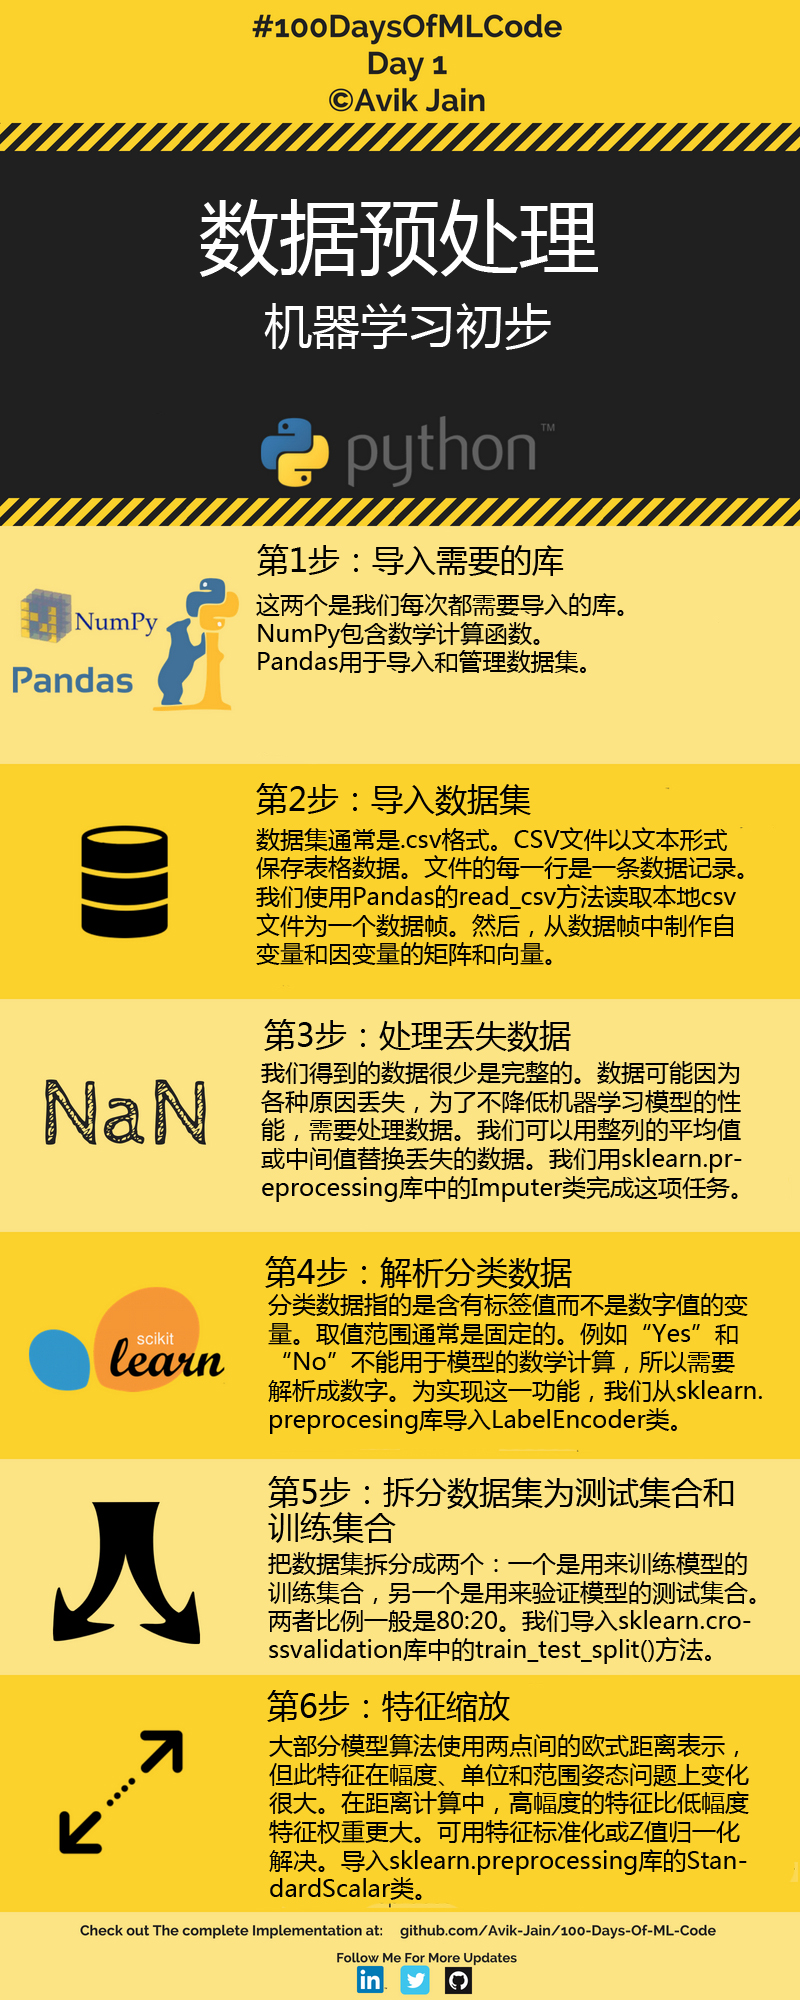
数据预处理主要步骤
参考github。
读取数据集
import numpy as np
import pandas as pd########### 数据预处理实践 ###########
dataset = pd.read_csv('data/Data.csv')
print(dataset)
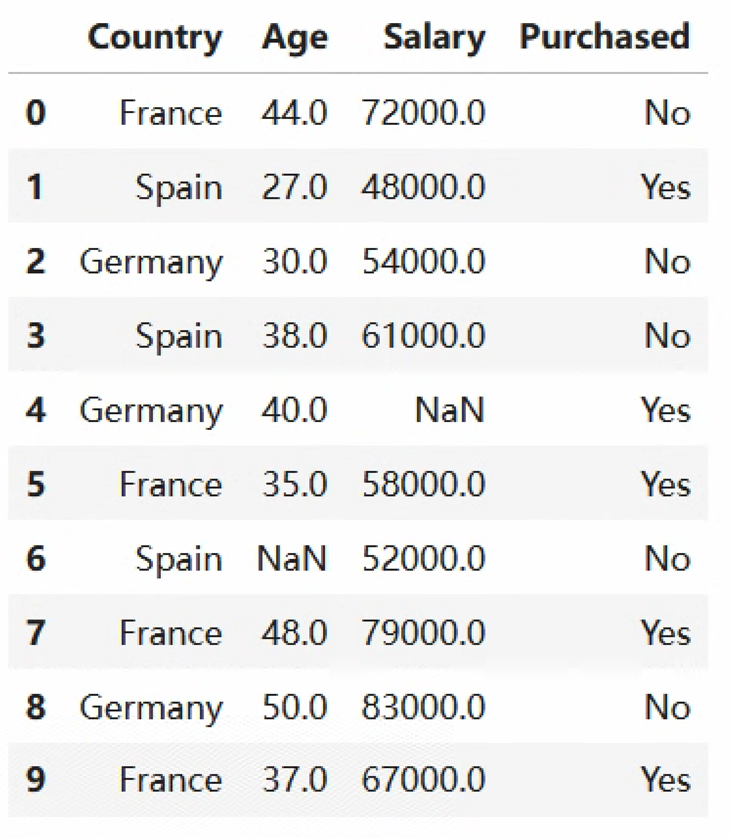
1. 数据预处理
X = dataset.loc[:, ['Country', 'Age', 'Salary']].values
print(X)Y = dataset.loc[:, 'Purchased'].values
print(Y)####### X #######
# [['France' 44.0 72000.0]
#  ['Spain' 27.0 48000.0]
#  ['Germany' 30.0 54000.0]
#  ['Spain' 38.0 61000.0]
#  ['Germany' 40.0 nan]
#  ['France' 35.0 58000.0]
#  ['Spain' nan 52000.0]
# ['France' 48.0 79000.0]
# ['Germany' 50.0 83000.0]
# ['France' 37.0 67000.0]]####### Y #######
# ['No' 'Yes' 'No' 'No' 'Yes' 'Yes' 'No' 'Yes' 'No' 'Yes']
2. 填充缺失值
from sklearn.impute import SimpleImputer
# 使用平均值填充缺失值
imputer = SimpleImputer(missing_values=np.nan, strategy='mean')# 重新填充
imputer = imputer.fit(X[:, 1:3])# 赋值
X[:, 1:3] = imputer.transform(X[:, 1:3])
print(X)####### X ######## [['France' 44.0 72000.0]
#  ['Spain' 27.0 48000.0]
#  ['Germany' 30.0 54000.0]
#  ['Spain' 38.0 61000.0]
#  ['Germany' 40.0 63777.77777777778]
#  ['France' 35.0 58000.0]
#  ['Spain' 38.77777777777778 52000.0]
#  ['France' 48.0 79000.0]
#  ['Germany' 50.0 83000.0]
# ['France' 37.0 67000.0]]
3. 解析分类数据
from sklearn.preprocessing import LabelEncoder, OneHotEncoder
from sklearn.compose import ColumnTransformer# 解析分类数据, 转换为数字表示类别
categories = ColumnTransformer([("", OneHotEncoder(), [0])], remainder='passthrough')X = categories.fit_transform(X)
label_encoder_Y = LabelEncoder()
Y = label_encoder_Y.fit_transform(Y)print(X)
# 0表示NO, 1表示YES####### X #######
# [[0.0 1.0 0.0 0.0 44.0 72000.0]
#  [1.0 0.0 0.0 1.0 27.0 48000.0]
#  [1.0 0.0 1.0 0.0 30.0 54000.0]
#  [1.0 0.0 0.0 1.0 38.0 61000.0]
#  [1.0 0.0 1.0 0.0 40.0 63777.77777777778]
#  [0.0 1.0 0.0 0.0 35.0 58000.0]
#  [1.0 0.0 0.0 1.0 38.77777777777778 52000.0]
#  [0.0 1.0 0.0 0.0 48.0 79000.0]
#  [1.0 0.0 1.0 0.0 50.0 83000.0]
# [0.0 1.0 0.0 0.0 37.0 67000.0]]print(Y)
####### Y #######
# [0 1 0 0 1 1 0 1 0 1]
4. 划分数据集
from sklearn.model_selection import train_test_split# 将数据集按80%:20%划分为训练数据集和测试数据集
X_train, X_test, Y_train, Y_test = train_test_split(X, Y, test_size=0.2, random_state=0)print(X_train)
# [[1.0 0.0 1.0 0.0 40.0 63777.77777777778]
# [0.0 1.0 0.0 0.0 37.0 67000.0]
# [1.0 0.0 0.0 1.0 27.0 48000.0]print(X_test)
# [1.0 0.0 0.0 1.0 38.77777777777778 52000.0]
# [0.0 1.0 0.0 0.0 48.0 79000.0]
# [1.0 0.0 0.0 1.0 38.0 61000.0]
# [0.0 1.0 0.0 0.0 44.0 72000.0]
# [0.0 1.0 0.0 0.0 35.0 58000.0]]
# [[1.0 0.0 1.0 0.0 30.0 54000.0]
# [1.0 0.0 1.0 0.0 50.0 83000.0]]print(Y_train)
# [1 1 1 0 1 0 0 1]print(Y_test)
# [0 0]
5. 特征缩放
from sklearn.preprocessing import StandardScaler# 特征缩放
standard_scaler_X = StandardScaler()
x_tarin = standard_scaler_X.fit_transform(X_train)
X_test = standard_scaler_X.transform(X_test)print(X_train)
# [[1.0 0.0 1.0 0.0 40.0 63777.77777777778]
#  [0.0 1.0 0.0 0.0 37.0 67000.0]
#  [1.0 0.0 0.0 1.0 27.0 48000.0]
#  [1.0 0.0 0.0 1.0 38.77777777777778 52000.0]
#  [0.0 1.0 0.0 0.0 48.0 79000.0]
#  [1.0 0.0 0.0 1.0 38.0 61000.0]
#  [0.0 1.0 0.0 0.0 44.0 72000.0]
#  [0.0 1.0 0.0 0.0 35.0 58000.0]]print(X_test)
# [[ 1.         -7.         22.66890466 -5.67954246 -7.80844702 -6.56578547]
#  [ 1.         -7.         22.66890466 -5.67954246 -7.70634099 -6.56578543]]
简单线性回归(Linear regression)实践
线性回归主要步骤
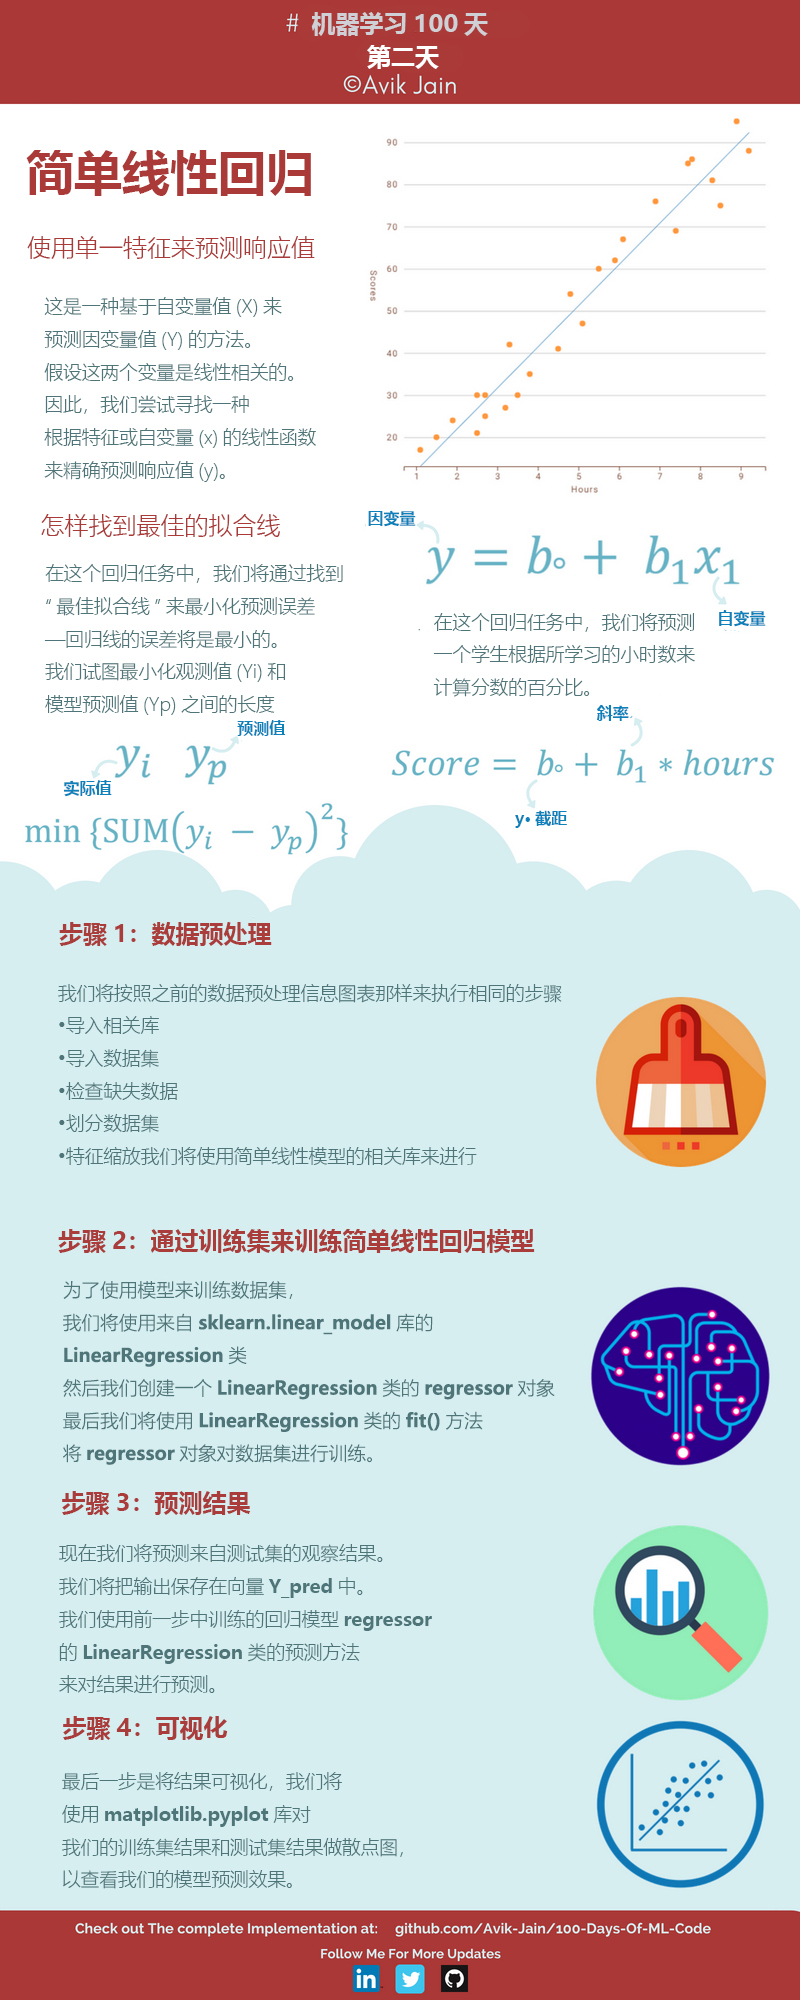 线性回归" />
代码实现Linear regression
import pandas as pd
import numpy as np
import matplotlib.pyplot as pltdataset_scores = pd.read_csv('data/studentscores.csv')
# 按Scores列降序排序数据
# dataset_scores_sorted = dataset_scores.sort_values(by='Scores', ascending=False)print(dataset_scores)
# Hours  Scores
# 0     2.5      21
# 1     5.1      47
# 2     3.2      27
# 3     8.5      75
# 4     3.5      30
# 5     1.5      20
# 6     9.2      88
# 7     5.5      60
# 8     8.3      81
# 9     2.7      25
# 10    7.7      85
# 11    5.9      62
# 12    4.5      41
# 13    3.3      42
# 14    1.1      17
# 15    8.9      95
# 16    2.5      30
# 17    1.9      24
# 18    6.1      67
# 19    7.4      69
# 20    2.7      30
# 21    4.8      54
# 22    3.8      35
# 23    6.9      76
# 24    7.8      86
# 25    2.1      93
# 26    2.2      93
# 27    2.5      93# 数据预处理, iloc基于行号和列号索引
X = dataset_scores.iloc[0:25, :1].values
Y = dataset_scores.iloc[0:25, -1:].values
print("X:\n",X)
print("Y:\n",Y)# X:
#  [[2.5]
#  [5.1]
#  [3.2]
#  [8.5]
#  [3.5]
#  [1.5]
#  [9.2]
#  [5.5]
#  [8.3]
#  [2.7]
#  [7.7]
#  [5.9]
#  [4.5]
#  [3.3]
#  [1.1]
#  [8.9]
#  [2.5]
#  [1.9]
#  [6.1]
#  [7.4]
#  [2.7]
#  [4.8]
#  [3.8]
#  [6.9]
#  [7.8]]# Y:
#  [[21]
#  [47]
#  [27]
#  [75]
#  [30]
#  [20]
#  [88]
#  [60]
#  [81]
#  [25]
#  [85]
#  [62]
#  [41]
#  [42]
#  [17]
#  [95]
#  [30]
#  [24]
#  [67]
#  [69]
#  [30]
#  [54]
#  [35]
#  [76]
#  [86]]# 划分训练集和测试集
from sklearn.model_selection import train_test_split
# 3/4训练集, 1/4测试集
X_train, X_test, Y_train, Y_test = train_test_split(X, Y, test_size=1/4, random_state=0)
print(X_train)
# [[7.8]
#  [6.9]
#  [1.1]
#  [5.1]
#  [7.7]
#  [3.3]
#  [8.3]
#  [9.2]
#  [6.1]
#  [3.5]
#  [2.7]
#  [5.5]
#  [2.7]
#  [8.5]
#  [2.5]
#  [4.8]
#  [8.9]
#  [4.5]]print(X_test)
# [[1.5]
#  [3.2]
#  [7.4]
#  [2.5]
#  [5.9]
#  [3.8]
#  [1.9]]print(Y_train)
# [[86]
#  [76]
#  [17]
#  [47]
#  [85]
#  [42]
#  [81]
#  [88]
#  [67]
#  [30]
#  [25]
#  [60]
#  [30]
#  [75]
#  [21]
#  [54]
#  [95]
#  [41]]print(Y_test)
# [[20]
#  [27]
#  [69]
#  [30]
#  [62]
#  [35]
#  [24]]# 训练线性回归模型
from sklearn.linear_model import LinearRegression
linear_regressor = LinearRegression()
linear_regressor = linear_regressor.fit(X_train, Y_train)# 使用测试集进行预测
Y_predict = linear_regressor.predict(X_test)
print(Y_predict)
# [[16.84472176]
#  [33.74557494]
#  [75.50062397]
#  [26.7864001 ]
#  [60.58810646]
#  [39.71058194]
#  [20.8213931 ]]# 训练集数据可视化
import matplotlib.pyplot as plt# 训练集数据可视化, 红色点
plt.scatter(X_train, Y_train, color='red')# 使用X_train训练集作为输入,线性模型预测结果
plt.plot(X_train, linear_regressor.predict(X_train), 'bo-')
plt.show()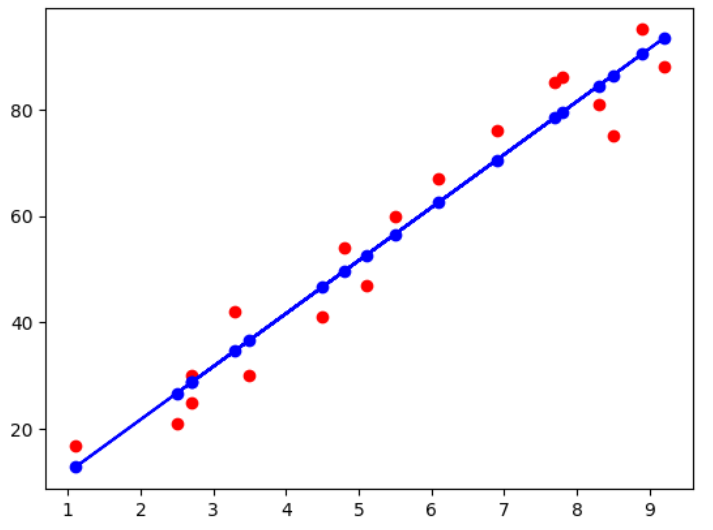
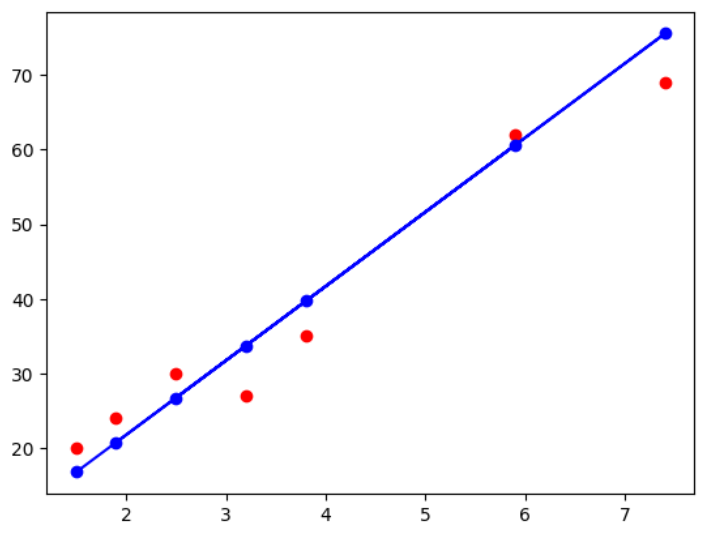
# 测试集数据可视化
plt.scatter(X_test, Y_test, color='red')# 使用X_test测试集作为输入,线性模型预测结果
plt.plot(X_test, Y_predict, 'bo-')
plt.show()
