在本练习中,您将实现K-means算法并将其用于图像压缩。
- 您将从一个样本数据集开始,该数据集将帮助您直观地了解K-means算法的工作原理。
- 之后,您将使用K-means算法进行图像压缩,将图像中出现的颜色数量减少到该图像中最常见的颜色。
文章目录
- 1-实现K-means
- 1.2计算质心意味着
- 2-样本数据集上的K-means
- 3-随机初始化
- 4-使用K-means进行图像压缩
- 4.1数据集加载图像
- 4.2图像像素上的K-Means
- 4.3压缩图像
import numpy as np
import matplotlib.pyplot as plt
from utils import *%matplotlib inline
1-实现K-means
K-means算法是一种自动将相似数据点聚类在一起的方法。
- 具体来说,你会得到一套训练{𝑥1,……,𝑥(𝑚)},并且您希望将数据分组为几个有凝聚力的“集群”。
- K-means是一个迭代过程
- 首先猜测初始质心,然后
- 通过优化此猜测
- 反复将示例指定给它们最近的质心
- 根据指定重新计算质心。
在伪码中,K-means算法如下:
# Initialize centroids
# K is the number of clusters
#初始化质心
#K是簇的数量
centroids = kMeans_init_centroids(X, K)for iter in range(iterations):# Cluster assignment step: # Assign each data point to the closest centroid. # idx[i] corresponds to the index of the centroid # assigned to example i#群集分配步骤:#将每个数据点指定给最近的质心。#idx[i]对应于质心的索引#分配给示例iidx = find_closest_centroids(X, centroids)# Move centroid step: # Compute means based on centroid assignments#移动质心步长:#基于质心分配计算均值centroids = compute_means(X, idx, K)
- 算法的内部循环重复执行两个步骤:
- (i) 分配每个训练示例𝑥(𝑖) 以及
- (ii)使用分配给每个质心的点重新计算每个质心的平均值。
- 这个𝐾-均值算法将总是收敛到质心的某个最终均值集。
- 然而,收敛解可能并不总是理想的,并且取决于质心的初始设置。
- 因此,在实践中,K-means算法通常在不同的随机初始化下运行几次。
- 从不同的随机初始化中在这些不同的解决方案之间进行选择的一种方法是选择具有最低成本函数值(失真)的解决方案。
在接下来的部分中,您将分别实现K-means算法的两个阶段。
- 您将从完成
find_closest_centroid开始,然后继续完成compute_centroids。
1.1寻找最接近的质心
在K-means算法的“聚类分配”阶段,该算法分配每个训练示例𝑥(𝑖)到其最近的质心,给定质心的当前位置。
练习1
您的任务是完成find_closest_centroids中的代码。
- 此函数获取数据矩阵X和质心内所有质心的位置。
- 它应该输出一个一维数组idx(与X具有相同数量的元素),该数组保存最近质心的索引({1,…,𝐾},𝐾是质心的总数)。
- 具体来说,对于每个例子𝑥(𝑖) 我们设置
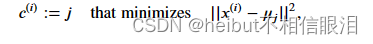
𝑐^(i)是最接近于其的质心的索引(对应于起始代码中的idx[i]),- 而u𝑗是𝑗的第一个质心的位置(值)。(存储在启动代码中的质心中)
如果你遇到了困难,你可以查看下面单元格后呈现的提示,以帮助你实现。
正确答案👇
def find_closest_centroids(X, centroids):# Set KK = centroids.shape[0]# You need to return the following variables correctlyidx = np.zeros(X.shape[0], dtype=int)### START CODE HERE ###for i in range(X.shape[0]):# Array to hold distance between X[i] and each centroids[j]distance = [] for j in range(centroids.shape[0]):norm_ij = np.linalg.norm(X[i]-centroids[j])distance.append(norm_ij)idx[i] = np.argmin(distance)### END CODE HERE ###return idx
自己写的答案👇
# UNQ_C1
# GRADED FUNCTION: find_closest_centroidsdef find_closest_centroids(X, centroids):"""Computes the centroid memberships for every exampleArgs:X (ndarray): (m, n) Input values      centroids (ndarray): k centroidsReturns:idx (array_like): (m,) closest centroids"""# Set KK = centroids.shape[0]# You need to return the following variables correctlyidx = np.zeros(X.shape[0], dtype=int)m=X.shape[0]### START CODE HERE ###for i in range(m):min = float('inf')for j in range(K):L=np.linalg.norm(X[i]-centroids[j])if L<min:min=Lidx[i]=j### END CODE HERE ###return idx
现在,让我们使用示例数据集检查您的实现
# Load an example dataset that we will be using
X = load_data()
下面的代码打印变量X中的前五个元素和变量的维度
print("First five elements of X are:\n", X[:5])
print('The shape of X is:', X.shape)
First five elements of X are:[[1.84207953 4.6075716 ][5.65858312 4.79996405][6.35257892 3.2908545 ][2.90401653 4.61220411][3.23197916 4.93989405]]
The shape of X is: (300, 2)
# Select an initial set of centroids (3 Centroids)
initial_centroids = np.array([[3,3], [6,2], [8,5]])# Find closest centroids using initial_centroids
idx = find_closest_centroids(X, initial_centroids)# Print closest centroids for the first three elements
print("First three elements in idx are:", idx[:3])# UNIT TEST
from public_tests import *find_closest_centroids_test(find_closest_centroids)
First three elements in idx are: [0 2 1]
All tests passed!
Expected Output:
First three elements in idx are [0 2 1]
1.2计算质心意味着
给定每个点到质心的分配,算法的第二阶段为每个质心重新计算分配给它的点的平均值。
练习2
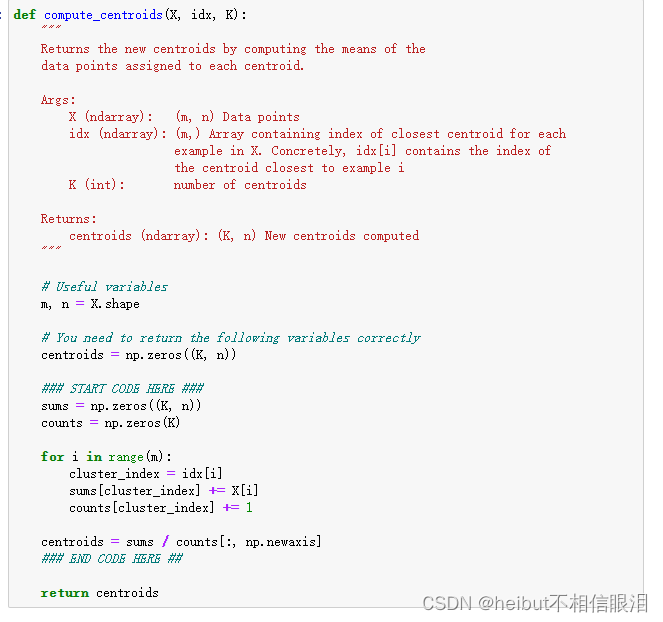
请完成下面的compute_centroids,以重新计算每个质心的值
- 具体来说,对于每个质心𝜇𝑘我们设置

- 𝐶𝑘是分配给质心的一组示例𝑘
- |𝐶𝑘|是集合中的示例数𝐶𝑘
具体来说,如果有两个例子𝑥3和𝑥5分配给质心𝑘=2,则应该更新𝜇2=1/2(𝑥3+𝑥5).
如果遇到问题,可以查看下面单元格后面的提示,以帮助您实现。
def compute_centroids(X, idx, K):"""Returns the new centroids by computing the means of the data points assigned to each centroid.Args:X (ndarray): (m, n) Data pointsidx (ndarray): (m,) Array containing index of closest centroid for each example in X. Concretely, idx[i] contains the index of the centroid closest to example iK (int): number of centroidsReturns:centroids (ndarray): (K, n) New centroids computed"""# Useful variablesm, n = X.shape# You need to return the following variables correctlycentroids = np.zeros((K, n))### START CODE HERE ###for k in range(K): points = X[idx == k]# Your code here to get a list of all data points in X assigned to centroid k centroids[k] = np.mean(points,axis=0)# Your code here to compute the mean of the points assigned### END CODE HERE ## return centroids
我写的且让chat修改过的👇
K = 3
centroids = compute_centroids(X, idx, K)print("The centroids are:", centroids)# UNIT TEST
compute_centroids_test(compute_centroids)
The centroids are: [[2.42830111 3.15792418][5.81350331 2.63365645][7.11938687 3.6166844 ]]
All tests passed!
Expected Output:
2.42830111 3.15792418
5.81350331 2.63365645
7.11938687 3.6166844
2-样本数据集上的K-means
在完成上面的两个函数(find_closest_centroids和compute_centroid)后,下一步是在玩具2D数据集上运行K-means算法,以帮助您了解K-means是如何工作的。
- 我们鼓励您看看下面的函数(run_kMeans),了解它是如何工作的。
- 请注意,该代码调用您在循环中实现的两个函数。
当您运行下面的代码时,它将生成一个可视化,在每次迭代中逐步了解算法的进度。
最后,您的图应该如图1所示。
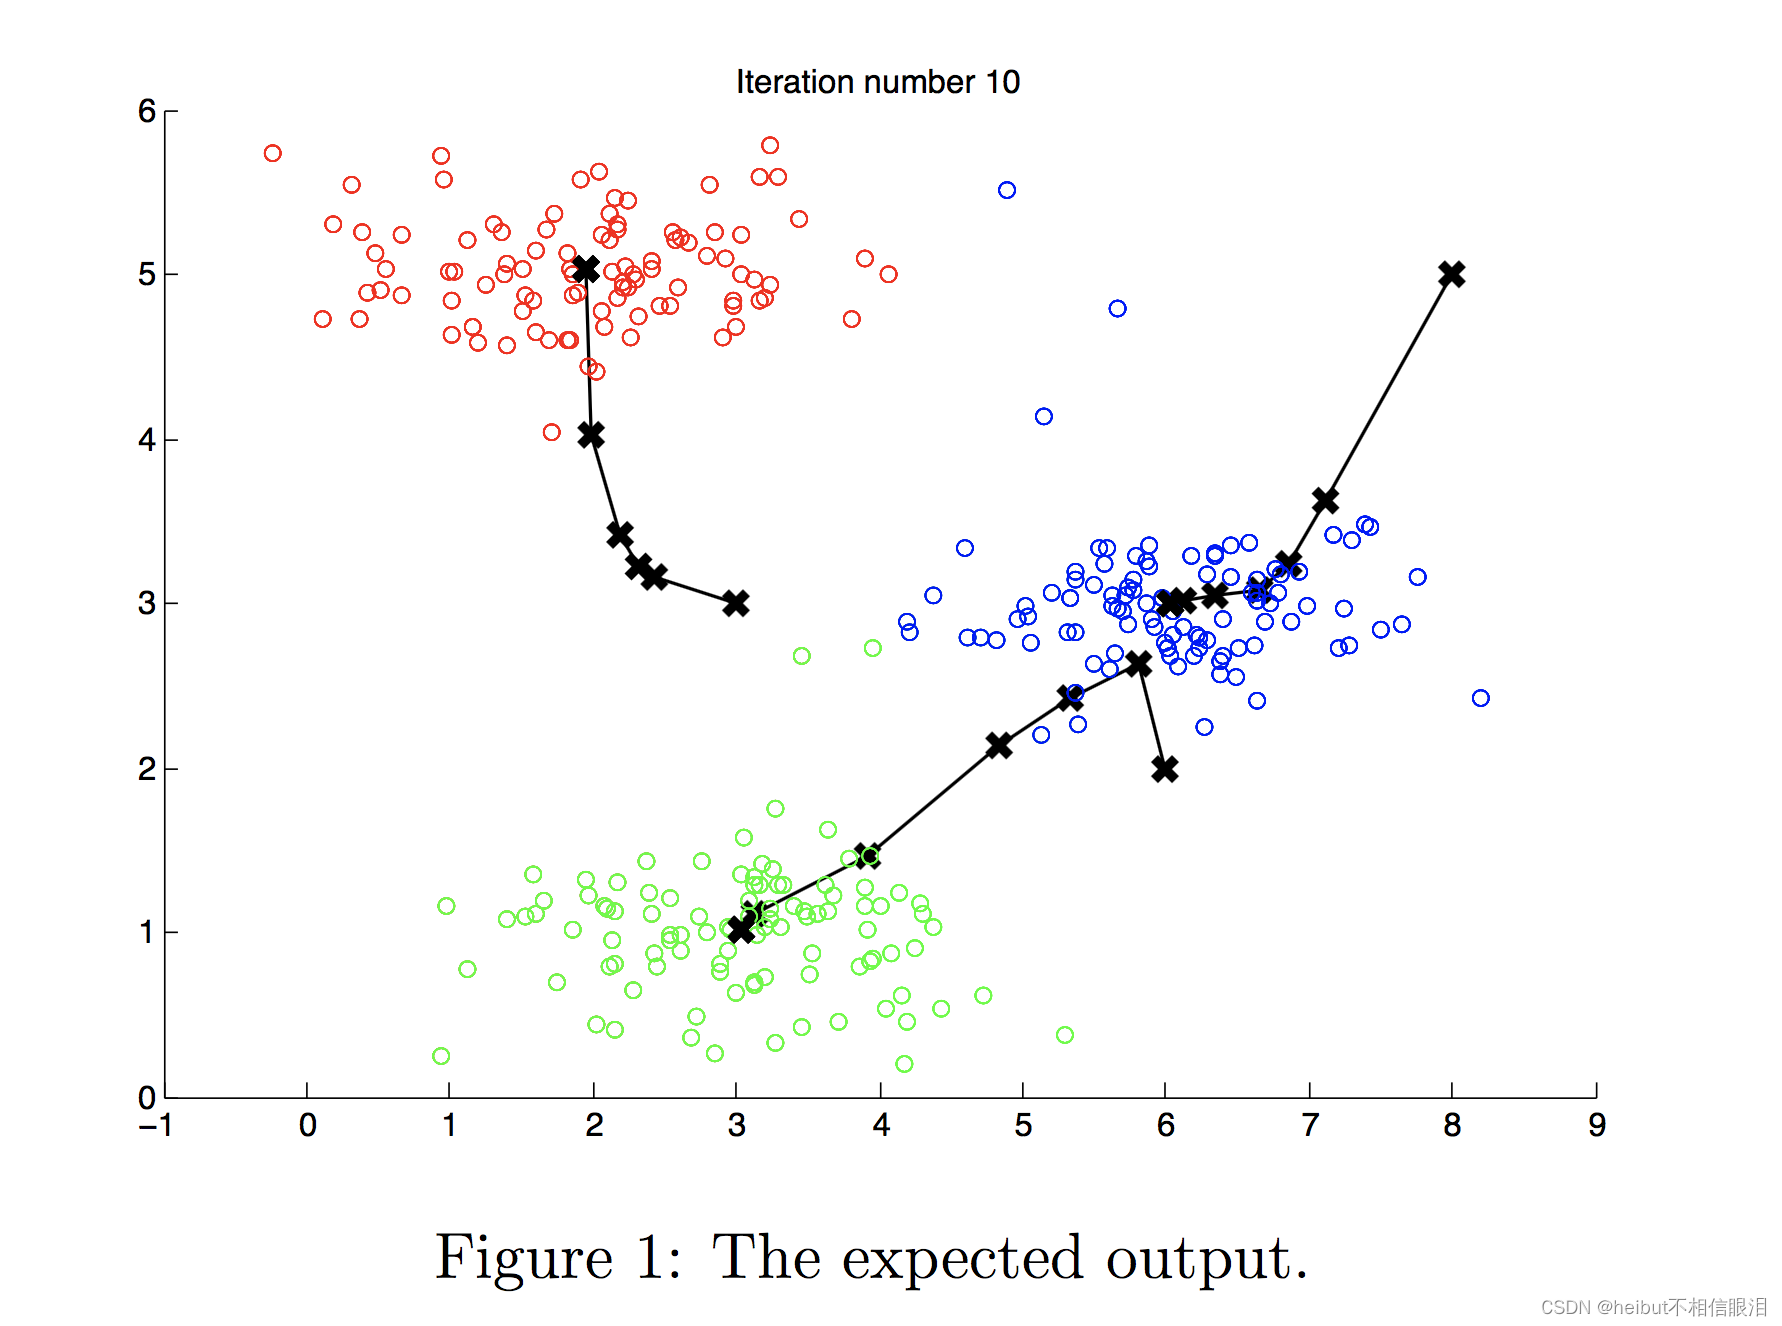
注意:您不需要为这个部分实现任何东西。只需运行下面提供的代码
# You do not need to implement anything for this partdef run_kMeans(X, initial_centroids, max_iters=10, plot_progress=False):"""Runs the K-Means algorithm on data matrix X, where each row of Xis a single example""""""在数据矩阵X上运行K-Means算法,其中X的每一行只是一个例子"""# Initialize valuesm, n = X.shapeK = initial_centroids.shape[0]centroids = initial_centroidsprevious_centroids = centroids idx = np.zeros(m)# Run K-Meansfor i in range(max_iters):#Output progressprint("K-Means iteration %d/%d" % (i, max_iters-1))# For each example in X, assign it to the closest centroididx = find_closest_centroids(X, centroids)# Optionally plot progressif plot_progress:plot_progress_kMeans(X, centroids, previous_centroids, idx, K, i)previous_centroids = centroids# Given the memberships, compute new centroidscentroids = compute_centroids(X, idx, K)plt.show() return centroids, idx
# Load an example dataset
X = load_data()# Set initial centroids
initial_centroids = np.array([[3,3],[6,2],[8,5]])
K = 3# Number of iterations
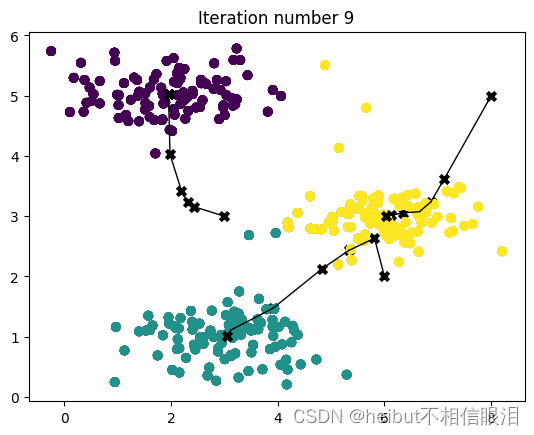
max_iters = 10centroids, idx = run_kMeans(X, initial_centroids, max_iters, plot_progress=True)
K-Means iteration 0/9
K-Means iteration 1/9
K-Means iteration 2/9
K-Means iteration 3/9
K-Means iteration 4/9
K-Means iteration 5/9
K-Means iteration 6/9
K-Means iteration 7/9
K-Means iteration 8/9
K-Means iteration 9/9
3-随机初始化
示例数据集的质心的初始分配经过设计,您将看到与图1中相同的图。在实践中,初始化质心的一个好策略是从训练集中随机选择示例。
在练习的这一部分中,您应该了解函数kMeans_int_centroids是如何实现的。
- 代码首先随机打乱示例的索引(使用
np.srandom.permutation())。 - 然后,它选择第一个𝐾 基于索引的随机排列的示例。
- 这允许随机选择示例,而不存在两次选择同一示例的风险。
注意:对于练习的这一部分,您不需要进行任何实现。
# You do not need to modify this partdef kMeans_init_centroids(X, K):"""This function initializes K centroids that are to be used in K-Means on the dataset XArgs:X (ndarray): Data points K (int): number of centroids/clustersReturns:centroids (ndarray): Initialized centroids"""# Randomly reorder the indices of examplesrandidx = np.random.permutation(X.shape[0])# Take the first K examples as centroidscentroids = X[randidx[:K]]return centroids
4-使用K-means进行图像压缩
在本练习中,您将把K-means应用于图像压缩。
- 在图像2的直接24位颜色表示中 ,每个像素表示为指定红色、绿色和蓝色强度值的三个8位无符号整数(范围从0到255)。这种编码通常被称为RGB编码。
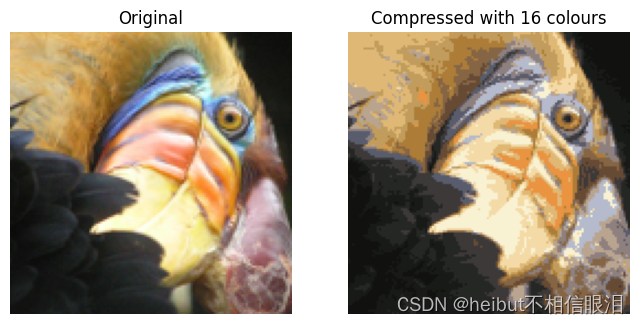
- 我们的图像包含数千种颜色,在这部分练习中,您将把颜色的数量减少到16种。
- 通过进行这种缩小,可以以有效的方式表示(压缩)照片。
- 具体来说,您只需要存储16种选定颜色的RGB值,对于图像中的每个像素,您现在只需要存储该位置的颜色索引(其中仅需要4位来表示16种可能性)。
在本部分中,您将使用K-means算法来选择将用于表示压缩图像的16种颜色。
- 具体来说,您将把原始图像中的每个像素都作为一个数据示例,并使用K-means算法来找到在三维RGB空间中对像素进行最佳分组(聚类)的16种颜色。
- 计算出图像上的簇质心后,将使用16种颜色替换原始图像中的像素。
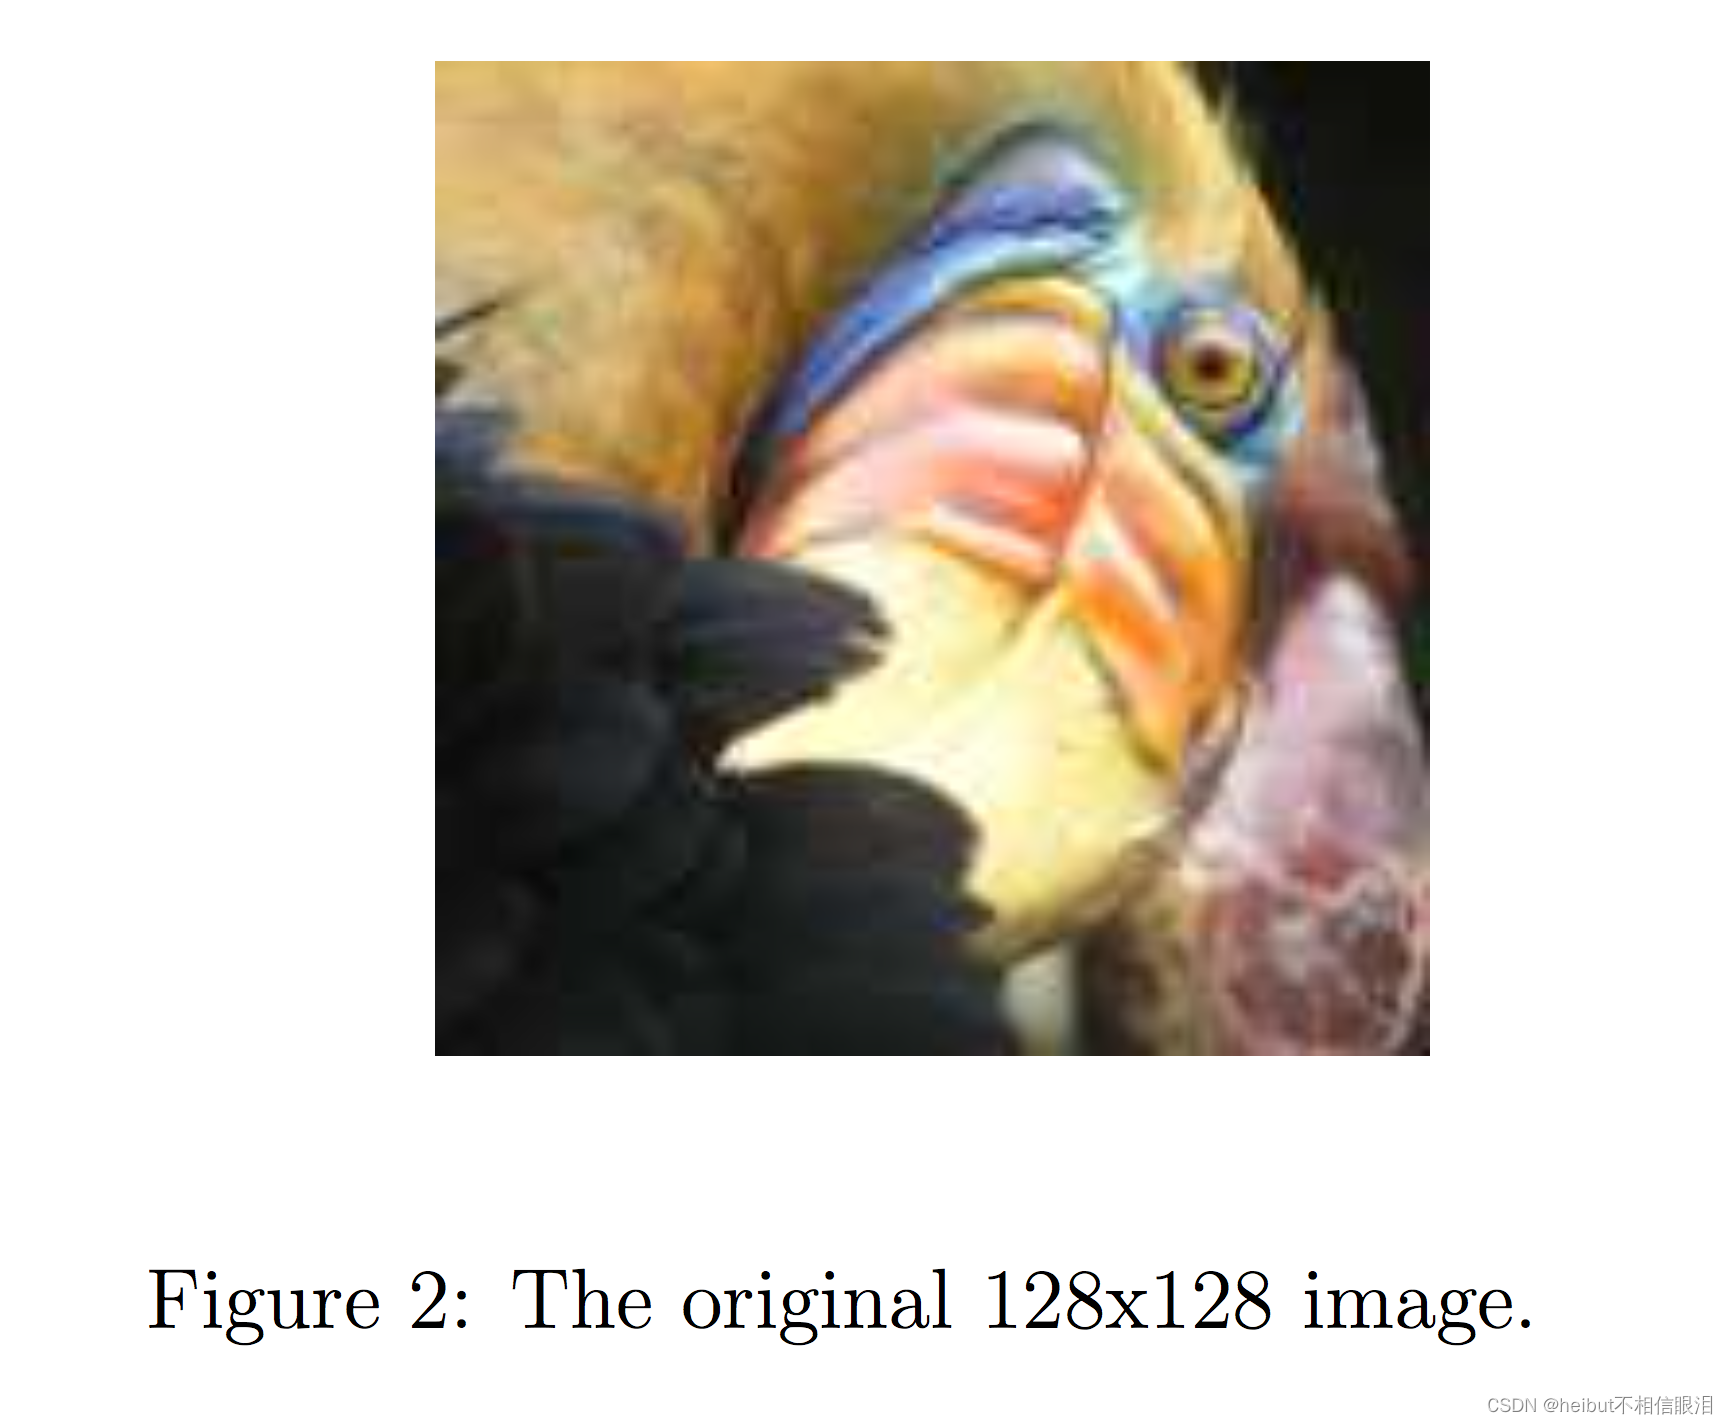
2.本练习中使用的照片属于Frank Wouters,经其许可使用。
4.1数据集加载图像
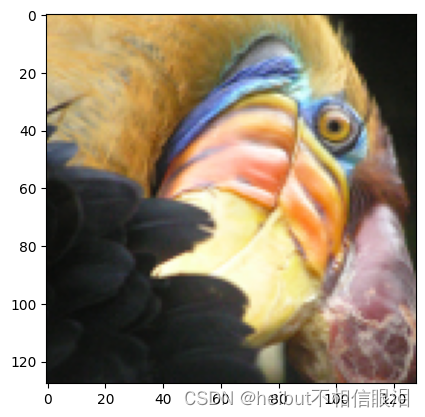
首先,您将使用matplotlib读取原始图像,如下所示。
# Load an image of a bird
original_img = plt.imread('bird_small.png')
可视化图像
您可以使用下面的代码可视化刚刚加载的图像。
# Visualizing the image
plt.imshow(original_img)
检查变量的尺寸
和往常一样,您将打印出变量的形状,以便更熟悉数据。
print("Shape of original_img is:", original_img.shape)
Shape of original_img is: (128, 128, 3)
如您所见,这将创建一个三维矩阵original_img,其中
- 前两个索引标识像素位置,第三个索引表示红色、绿色或蓝色。
例如,original_img[50,33,2]给出第50行和第33列像素的蓝色强度。
处理数据
要调用run_kMeans,首先需要将矩阵original_img转换为二维矩阵。
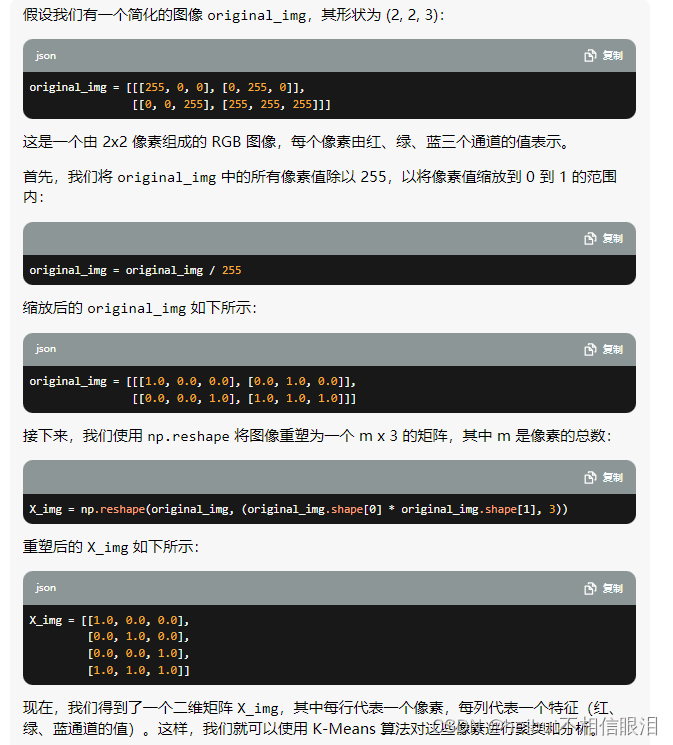
- 下面的代码重塑矩阵original_img以创建𝑚*3. 像素颜色矩阵(其中𝑚=16384=128×128)
# Divide by 255 so that all values are in the range 0 - 1
original_img = original_img / 255# Reshape the image into an m x 3 matrix where m = number of pixels
# (in this case m = 128 x 128 = 16384)
# Each row will contain the Red, Green and Blue pixel values
# This gives us our dataset matrix X_img that we will use K-Means on.
#将图像重塑为m x 3矩阵,其中m=像素数
#(在这种情况下,m=128 x 128=16384)
#每行将包含红色、绿色和蓝色像素值
#这给了我们数据集矩阵X_img,我们将对其使用K-Means。X_img = np.reshape(original_img, (original_img.shape[0] * original_img.shape[1], 3))
举例说明上述代码的作用👇
4.2图像像素上的K-Means
现在,运行下面的单元格对预处理的图像运行K-Means。
# Run your K-Means algorithm on this data
# You should try different values of K and max_iters here
K = 16
max_iters = 10               # Using the function you have implemented above.
initial_centroids = kMeans_init_centroids(X_img, K) # Run K-Means - this takes a couple of minutes
centroids, idx = run_kMeans(X_img, initial_centroids, max_iters)
K-Means iteration 0/9
K-Means iteration 1/9
K-Means iteration 2/9
K-Means iteration 3/9
K-Means iteration 4/9
K-Means iteration 5/9
K-Means iteration 6/9
K-Means iteration 7/9
K-Means iteration 8/9
K-Means iteration 9/9
print("Shape of idx:", idx.shape)
print("Closest centroid for the first five elements:", idx[:5])
4.3压缩图像
找到顶部后𝐾=16颜色来表示图像,现在可以使用find_closest_centroids函数将每个像素位置分配给其最近的质心。
- 这允许您使用每个像素的质心指定来表示原始图像。
- 请注意,您已经显著减少了描述图像所需的位数。
- 原始图像需要128×128中的每一个24位 像素位置,导致总大小为128×128×24=393216 位。
- 新的表示需要以16种颜色的字典形式的一些开销存储,每种颜色需要24位,但图像本身每个像素位置只需要4位。
- 因此,最终使用的位数为16×24+128×128×4=65920 这对应于将原始图像压缩大约6倍。
# Represent image in terms of indices
X_recovered = centroids[idx, :] # Reshape recovered image into proper dimensions
X_recovered = np.reshape(X_recovered, original_img.shape)
idx是索引,centroids是值,X_recovered是每一个元素对应的值。
最后,您可以通过仅基于质心指定重建图像来查看压缩的效果。
- 具体来说,您可以将每个像素位置替换为指定给它的质心的平均值。
- 图3显示了我们获得的重建。即使生成的图像保留了原始图像的大部分特征,我们也会看到一些压缩伪影。

# Display original image
fig, ax = plt.subplots(1,2, figsize=(8,8))
plt.axis('off')ax[0].imshow(original_img*255)
ax[0].set_title('Original')
ax[0].set_axis_off()# Display compressed image
ax[1].imshow(X_recovered*255)
ax[1].set_title('Compressed with %d colours'%K)
ax[1].set_axis_off()