概述
最常见的空间问题之一是找到距离我们当前位置最近的兴趣点 (POI)。假设有人很快就会耗尽汽油,他/她需要在为时已晚之前找到最近的加油站,解决这个问题的最佳解决方案是什么?当然,驾驶员可以检查地图来找到最近的加油站,但如果该地区有多个加油站,并且他/她需要快速确定哪个加油站是最近的,则可能会出现问题。最好的解决方案是用多边形内的点来表示每个 POI。所以在多边形内,最近的 POI 肯定是多边形内的点。这些多边形称为 Voronoi 区域。
数据采集
在这个项目中,我根据 POI 数据在地图上创建 Voronoi 区域。所有 POI 数据都是随机选择的,而街道网络数据则借助 OSMnx 包从 OpenStreetMap 下载。
创建 Voronoi 区域
目前使用 Python 构建 Voronoi 区域的最简单方法是使用 geovoronoi 包。 Geovoronoi 是一个用于在地理区域内创建和绘制 Voronoi 区域的软件包。至于地图可视化,我选择 folium 包。
首先,我首先在地图周围创建随机点。
gdf = gpd.GeoDataFrame()
gdf = gdf.append({'geometry': Point(106.644085,-6.305286)}, ignore_index=True)
gdf = gdf.append({'geometry': Point(106.653261,-6.301309)}, ignore_index=True)
gdf = gdf.append({'geometry': Point(106.637751,-6.284774)}, ignore_index=True)
gdf = gdf.append({'geometry': Point(106.665062,-6.284598)}, ignore_index=True)
gdf = gdf.append({'geometry': Point(106.627582,-6.283521)}, ignore_index=True)
gdf = gdf.append({'geometry': Point(106.641365,-6.276593)}, ignore_index=True)
gdf = gdf.append({'geometry': Point(106.625972,-6.303643)}, ignore_index=True)
下一步是确定 Voronoi 区域的覆盖范围并将其保存到地理数据框中。
area_max_lon = 106.670929
area_min_lon = 106.619602
area_max_lat = -6.275227
area_min_lat = -6.309795lat_point_list = [area_min_lat, area_max_lat,area_max_lat,area_min_lat]
lon_point_list = [area_min_lon, area_min_lon, area_max_lon, area_max_lon]polygon_geom = Polygon(zip(lon_point_list, lat_point_list))
boundary = gpd.GeoDataFrame()
boundary = boundary.append({'geometry': polygon_geom}, ignore_index=True)
不要忘记将 gdf 和边界数据帧转换为 Web 墨卡托投影。
gdf.crs = {'init' :'epsg:3395'}
boundary.crs = {'init' :'epsg:3395'}
将边界几何数据帧转换为多边形和 POI 数据帧的并集转换为坐标数组。
boundary_shape = cascaded_union(boundary.geometry)
coords = points_to_coords(gdf.geometry)>
计算 Voronoi 区域。
poly_shapes, pts, poly_to_pt_assignments = voronoi_regions_from_coords(coords, boundary_shape)在覆盖区域的边界内从 OpenStreetMap 创建图形。使用图表收集覆盖区域边界内的所有街道网络并将其保存到数据框中。
G = ox.graph_from_polygon(boundary_shape, network_type='all_private')
gdf_all_streets =  ox.graph_to_gdfs(G, nodes=False, edges=True,node_geometry=False, fill_edge_geometry=True)
创建新的数据框来收集每个 Voronoi 区域内的街道网络
gdf_streets_by_region = gpd.GeoDataFrame()
for x in range(len(poly_shapes)):gdf_streets = gpd.GeoDataFrame()gdf_streets['geometry'] = gdf_all_streets.intersection(poly_shapes[x])gdf_streets['voronoi_region'] = xgdf_streets = gdf_streets[gdf_streets['geometry'].astype(str) != 'LINESTRING EMPTY']gdf_streets_by_region = gdf_streets_by_region.append(gdf_streets)
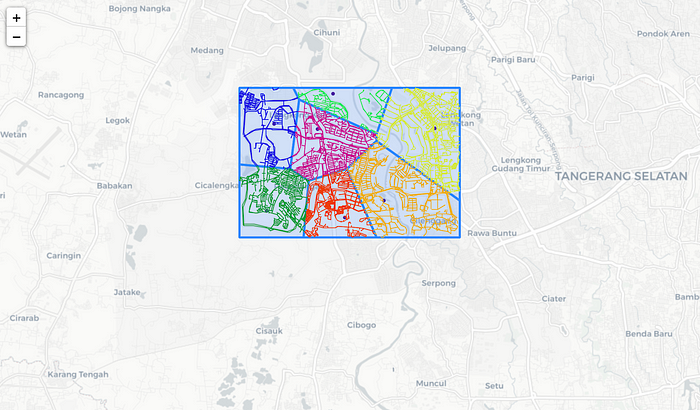
下面是地图上 Voronoi 区域的可视化。
结论
地图看起来很棒!
