定义和分类
聚类分析:一种数据归约技术,揭示一个数据集中观测值的子集。我们在机器学习中也详细介绍过聚类相关的知识:机器学习基础手册。
聚类簇(cluster):若干个观测值组成的群组,群组内观测值的相似度比群间相似度高。
可以分为:
1)层次聚类:每个观测值自成一个聚类簇,这些聚类簇每次两两合并,直到所有的聚类簇被聚成一个聚类簇为止。
2)划分聚类:首先指定聚类簇的数目k,然后观测值被随机分为k个聚类簇,再重新形成内聚性很强的聚类簇。
需要根据具体的问题和数据集特点选择适当的聚类算法。层次聚类适合于小型数据集(数百个或数千个数据点)或对聚类结果的可视化分析,而划分聚类适合于大规模数据集(数千个或数百万个以上的数据点)和对计算效率要求较高的场景。
15.1 聚类分析的一般步骤
1)选择合适的变量(最重要)
2)缩放数据:通常使用scale()函数均一化来缩小变量的变化范围
3)寻找异常点:outliers()函数筛选和删除异常单变量离群点或者使用围绕中心点的稳健聚类方法
4)计算距离:两个观测值之间最常用的是欧几里得距离;距离越大,异质性越大,观测值与自身之间的距离为0,可以使用dist()函数
5)选择聚类算法:层次聚类还是划分聚类
6)确定聚类簇的数目(k):
7)获得最终的聚类解决方案:k确定下来后就可以提取子群,形成最终聚类方案
8)结果可视化
9)解读聚类簇
10)验证结果
15.2 层次聚类分析
层次聚类可以分为以下几种:

15.2.1 语法及一般步骤
1)计算距离d:
x.scale <- scale(x)#建议先进行均一化
d <- dist(x,method = )#计算距离
x:数据集
method:默认为euclidean欧几里得距离,即两点之间的直线距离。还可选择”manhattan”:曼哈顿距离,即两点之间的城市街区距离(各维度差值的绝对值之和)。“maximum”:切比雪夫距离,即两点在各维度差值的绝对值中的最大值。“binary”:二进制距离,适用于处理二进制数据。如果两个数据点在相同位置上具有不同的值,则距离为1;如果两个数据点在相同位置上具有相同的值,则距离为0。“minkowski”:闵可夫斯基距离,可以通过设置额外参数p来指定参数值。当p=1时,闵可夫斯基距离等同于曼哈顿距离;当p=2时,闵可夫斯基距离等同于欧氏距离。“cosine”:余弦相似性,用于计算向量之间的夹角余弦,表示向量之间的相似性。“correlation”:相关性距离,用于计算向量之间的相关性距离,表示向量之间的相关性程度。
2)层次聚类:使用stats包中的基础函数hclust()来进行:
hclust(d,method = )#层次聚类d: 距离矩阵或相似性矩阵,用于表示待聚类的数据点之间的距离或相似性。可以使用dist()函数来计算距离矩阵或相似性矩阵。
method: 聚类算法的方法,用于指定聚类过程中的距离计算和合并策略。常见的方法包括”complete”(全联动)、“single”(单联动)、“average”(平均联动)、"centroid”(质心)和ward法,默认为”complete”。
3.1)可视化,方法一:使用ggdegrogram()函数绘制树状图:
library(ggplot2)
library(ggdendro)#该包需要安装
ggdendrogram(dendro, rotate = FALSE, size = 1, leaf_labels = FALSE)
dendro:dendrogram对象,表示树状图的层次结构。通常可以使用hclust()函数生成hclust对象,然后使用as.dendrogram()将其转换为dendrogram对象。
rotate:逻辑值,用于指定是否旋转树状图。默认为FALSE,表示不旋转。
size:数值,用于指定线条的宽度,控制树状图的密度。
leaf_labels:逻辑值,用于指定是否显示叶节点的标签。默认为FALSE,表示不显示。
3.2)可视化,方法二:使用factoextra包中的fviz_dend()函数绘制树状图:
更推荐!!更多参数设置参考??fviz_dend()
% 水平树形图:
fviz_dend(x,k = ,k_colors = ,color_labels_by_k = FALSE,type = "rectangle",rect_border=#通常与k_colors设置一样的颜色)%% 环形树形图:
fviz_dend(x,k = ,k_colors = ,color_labels_by_k = FALSE,type = "circular",%%% 分叉树形图:
fviz_dend(x,k = ,k_colors = ,color_labels_by_k = FALSE,type = "phylogenic",repel=TRUE15.2.2 举例
使用flexclust包中的nutrient数据集
1)首先看一下该数据集(记得先安装该包)
library(flexclust)## Warning: 程辑包'flexclust'是用R版本4.3.2 来建造的## 载入需要的程辑包:lattice##
## 载入程辑包:'lattice'## The following object is masked from 'package:corrgram':
##
## panel.fill## 载入需要的程辑包:modeltools## 载入需要的程辑包:stats4##
## 载入程辑包:'modeltools'## The following object is masked from 'package:car':
##
## Predictdata(nutrient,package = "flexclust")
nutrient## energy protein fat calcium iron
## BEEF BRAISED 340 20 28 9 2.6
## HAMBURGER 245 21 17 9 2.7
## BEEF ROAST 420 15 39 7 2.0
## BEEF STEAK 375 19 32 9 2.6
## BEEF CANNED 180 22 10 17 3.7
## CHICKEN BROILED 115 20 3 8 1.4
## CHICKEN CANNED 170 25 7 12 1.5
## BEEF HEART 160 26 5 14 5.9
## LAMB LEG ROAST 265 20 20 9 2.6
## LAMB SHOULDER ROAST 300 18 25 9 2.3
## SMOKED HAM 340 20 28 9 2.5
## PORK ROAST 340 19 29 9 2.5
## PORK SIMMERED 355 19 30 9 2.4
## BEEF TONGUE 205 18 14 7 2.5
## VEAL CUTLET 185 23 9 9 2.7
## BLUEFISH BAKED 135 22 4 25 0.6
## CLAMS RAW 70 11 1 82 6.0
## CLAMS CANNED 45 7 1 74 5.4
## CRABMEAT CANNED 90 14 2 38 0.8
## HADDOCK FRIED 135 16 5 15 0.5
## MACKEREL BROILED 200 19 13 5 1.0
## MACKEREL CANNED 155 16 9 157 1.8
## PERCH FRIED 195 16 11 14 1.3
## SALMON CANNED 120 17 5 159 0.7
## SARDINES CANNED 180 22 9 367 2.5
## TUNA CANNED 170 25 7 7 1.2
## SHRIMP CANNED 110 23 1 98 2.6该数据集包含了肉类、鱼类和禽类中营养成分的测量数据。共27个观测值。
2)均一化数据并求d值
row.names(nutrient) <- tolower(row.names(nutrient))#将行名小写
nutrient.scale <- scale(nutrient)
d <- dist(nutrient.scale,method = "euclidean")
3.1)层次聚类分析及可视化1
fit.average <- hclust(d,method = "average")
library(ggplot2)
library(ggdendro)
## Warning: 程辑包'ggdendro'是用R版本4.3.2 来建造的##
## 载入程辑包:'ggdendro'## The following object is masked from 'package:Hmisc':
##
## labelggdendrogram(fit.average, rotate = FALSE, size = 1, leaf_labels = FALSE)
3.2)层次聚类分析及可视化2
fit.average <- hclust(d,method = "average")
library(factoextra)
## Warning: 程辑包'factoextra'是用R版本4.3.2 来建造的## Welcome! Want to learn more? See two factoextra-related books at https://goo.gl/ve3WBafviz_dend(fit.average,k=4,cex = 0.8,horiz=TRUE,k_colors = c("tan2","skyblue","seagreen","plum3"),color_labels_by_k = FALSE,type = "rectangle",rect_border =c("tan2","skyblue","seagreen","plum3"),repel = TRUE,rect_lty = 0.5)## Warning: The `<scale>` argument of `guides()` cannot be `FALSE`. Use "none" instead as
## of ggplot2 3.3.4.
## ℹ The deprecated feature was likely used in the factoextra package.
## Please report the issue at <https://github.com/kassambara/factoextra/issues>.
## This warning is displayed once every 8 hours.
## Call `lifecycle::last_lifecycle_warnings()` to see where this warning was
## generated.
horiz=TRUE 变成水平的。
图片中的标签显示不全,可以通过设置cex的值来缩小标签,另外在图片导出时设置画布大小使得图片展示完全。
由于层次聚类一般不用提前计算k值,即分成几簇,所以计算k值放在划分聚类中学习。但层次聚类中使用fviz_dend()函数画图时,一般需要写k值,因此也可以计算k值后再画图。
15.3 划分聚类分析
观测值被分为K组并根据给定的规则重新划分内聚性最强的聚类簇。
分为K均值聚类和围绕中心点的划分(PAM,Partitioning Around Medoids)
15.3.1 K均值聚类(最常见)
-
15.3.1.1 语法
1)数据均一化,方法同前
2)求K值,使用NbClust()函数
library(NbClust)
library(factoextra)
nc <- NbClust(data, min.nc = 2, max.nc = 15, method = "kmeans")#data一般是均一化后的数据
fviz_nbclust(nc)#绘制聚类簇的柱状图
注意注意!!
method=kmeans是在这里的选项,而在层次聚类中则根据层次聚类来选填”complete”(全联动)、“single”(单联动)、“average”(平均联动)、“centroid”(质心)或ward法。
3)划分聚类
详见stats::kmeans
fit.km <- kmeans(df,centers,nstart=)df:要进行聚类分析的数据集。
centers:要创建的簇的数量,也称为聚类数目。
nstart:算法执行的不同初始配置的数量。默认为1。每个初始配置都可能产生不同的聚类结果,通过设置nstart大于1,可以增加找到全局最优解的机会。
4)可视化 factoextra包中的fviz_cluster()函数
library(factoextra)
fviz_cluster(fit.km,data=df)-
15.3.1.2 举例
用rattle包中的wine数据集来举例,需要安装rattle包
1)数据均一化,方法同前
library(rattle)## Warning: 程辑包'rattle'是用R版本4.3.2 来建造的## 载入需要的程辑包:bitops## Rattle: A free graphical interface for data science with R.
## XXXX 5.5.1 Copyright (c) 2006-2021 Togaware Pty Ltd.
## 键入'rattle()'去轻摇、晃动、翻滚你的数据。data(wine,package = "rattle")
print(str(wine))## 'data.frame': 178 obs. of 14 variables:
## $ Type : Factor w/ 3 levels "1","2","3": 1 1 1 1 1 1 1 1 1 1 ...
## $ Alcohol : num 14.2 13.2 13.2 14.4 13.2 ...
## $ Malic : num 1.71 1.78 2.36 1.95 2.59 1.76 1.87 2.15 1.64 1.35 ...
## $ Ash : num 2.43 2.14 2.67 2.5 2.87 2.45 2.45 2.61 2.17 2.27 ...
## $ Alcalinity : num 15.6 11.2 18.6 16.8 21 15.2 14.6 17.6 14 16 ...
## $ Magnesium : int 127 100 101 113 118 112 96 121 97 98 ...
## $ Phenols : num 2.8 2.65 2.8 3.85 2.8 3.27 2.5 2.6 2.8 2.98 ...
## $ Flavanoids : num 3.06 2.76 3.24 3.49 2.69 3.39 2.52 2.51 2.98 3.15 ...
## $ Nonflavanoids : num 0.28 0.26 0.3 0.24 0.39 0.34 0.3 0.31 0.29 0.22 ...
## $ Proanthocyanins: num 2.29 1.28 2.81 2.18 1.82 1.97 1.98 1.25 1.98 1.85 ...
## $ Color : num 5.64 4.38 5.68 7.8 4.32 6.75 5.25 5.05 5.2 7.22 ...
## $ Hue : num 1.04 1.05 1.03 0.86 1.04 1.05 1.02 1.06 1.08 1.01 ...
## $ Dilution : num 3.92 3.4 3.17 3.45 2.93 2.85 3.58 3.58 2.85 3.55 ...
## $ Proline : int 1065 1050 1185 1480 735 1450 1290 1295 1045 1045 ...
## NULLwine.scale <- scale(wine[-1])由于第一个变量type是factor格式,非num格式 因此剔除第一个变量。
2)求K值,使用NbClust()函数
library(NbClust)
library(factoextra)
nc <- NbClust(wine.scale, min.nc = 2, max.nc = 15, method = "kmeans")
## *** : The Hubert index is a graphical method of determining the number of clusters.
##                 In the plot of Hubert index, we seek a significant knee that corresponds to a
##                 significant increase of the value of the measure i.e the significant peak in Hubert
##                 index second differences plot.
##
## *** : The D index is a graphical method of determining the number of clusters.
##                 In the plot of D index, we seek a significant knee (the significant peak in Dindex
##                 second differences plot) that corresponds to a significant increase of the value of
##                 the measure.
##
## *******************************************************************
## * Among all indices:
## * 2 proposed 2 as the best number of clusters
## * 19 proposed 3 as the best number of clusters
## * 1 proposed 14 as the best number of clusters
## * 1 proposed 15 as the best number of clusters
##
##                    ***** Conclusion *****
##
## * According to the majority rule, the best number of clusters is  3
##
##
## *******************************************************************
根据结果显示:According to the majority rule, the best number of clusters is 3。
因此说明k=3。另外从图中也可看到,从3以后曲线变化平缓,也说明应选用聚簇类数目为3。
3)划分聚类和可视化
fit.km <- kmeans(wine.scale,3)
fviz_cluster(fit.km,data=wine.scale)
15.3.2 围绕中心点的划分(PAM)
k均值是基于均值,因此对异常点敏感。而围绕中心点相比而言显得更稳健。kmeans一般使用欧几里得距离,而PAM可以使用任意距离来计算。因此,PAM可以容纳混合数据类型,并且不仅限与连续型变量。
-
15.3.2.1 语法
1) 用cluster包中的pam()函数聚类
library(cluster)
fit.pam <- pam(df,k=,metric=,stand=TRUE/FALSE)
df:要进行聚类分析的数据框。
k:要创建的簇的数量。
metric:指定距离度量的方法。可以使用的选项包括:“euclidean”(欧几里德距离),“manhattan”(曼哈顿距离)等。默认为”euclidean”。
stand:一个逻辑值,指示是否对数据进行标准化处理。如果设置为TRUE,将对数据进行标准化处理(均值为0,标准差为1),默认为FALSE。
2) 可视化,方法如前
clusplot(fit.pam,main="")-
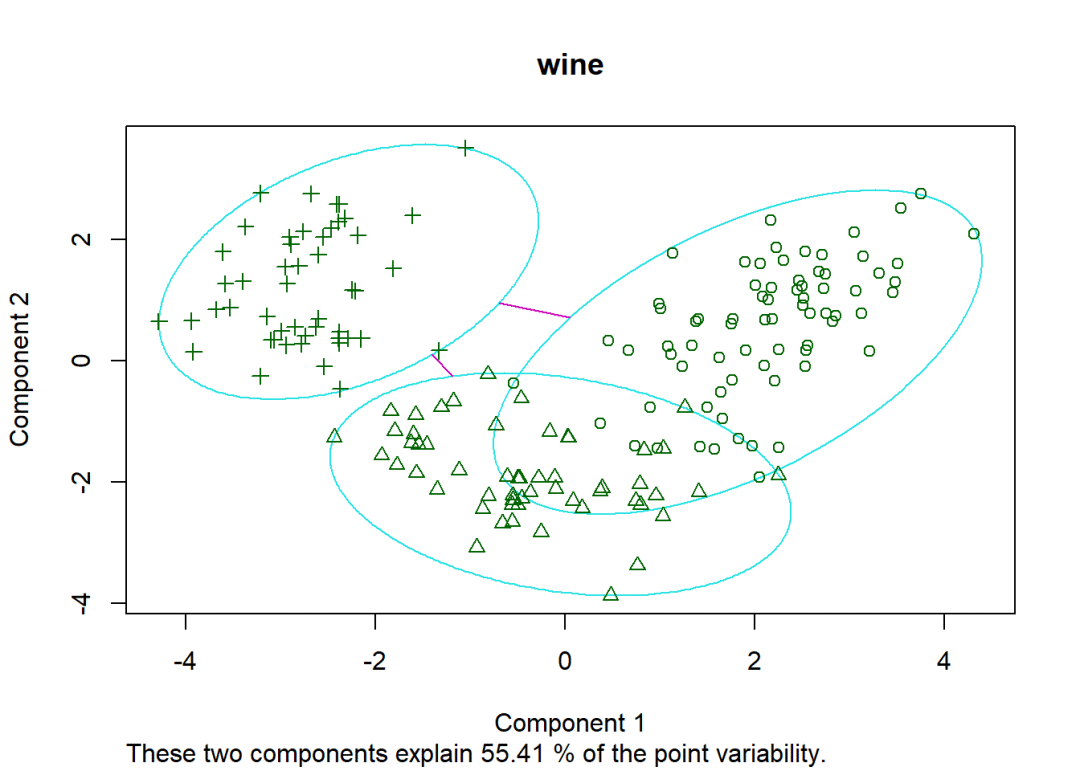
15.3.2.2 举例
依然用rattle包中的wine数据集举例
1)聚类
library(cluster)
library(rattle)
fit.pam <- pam(wine.scale,k=3)
clusplot(fit.pam,main="wine")
注意:这里的k=3是任意设置的,也可以设置为4。
完整教程请查看
R语言基础学习手册


