加载SVG和GIF
一、加载SVG
方法一:直接载入SVG文件,类似载入图片
缺点:无法进行进一步加工编辑
javascript">var marker1 = new maptalks.Marker(center.sub(0.009, 0),{'symbol' : {'markerFile' : '1.svg','markerWidth' : 28,'markerHeight' : 40,'markerDx' : 0,'markerDy' : 0,'markerOpacity': 1}}).addTo(layer);
方法二:载入SVG路径
缺点:无法实现复杂效果,如阴影和渐变色(矢量样式效果会失效)
只能手动替换path,不能解析基础形状代码。
javascript">var map = new maptalks.Map('map', {center: [-0.113049, 51.49856],zoom: 14,baseLayer: new maptalks.TileLayer('base', {urlTemplate: 'https://{s}.basemaps.cartocdn.com/light_all/{z}/{x}/{y}.png',subdomains: ['a', 'b', 'c', 'd'],attribution: '© <a href="http://osm.org">OpenStreetMap</a>  contributors, © <a href="https://carto.com/">CARTO</a> '})
});var layer = new maptalks.VectorLayer('vector').addTo(map);var tiger = new maptalks.Marker([-0.113049, 51.49856], {'symbol': {'markerType': 'path','markerPath': getTigerPath(),'markerPathWidth': 540,'markerPathHeight': 580,'markerFillPatternFile': 'fill-pattern.png',// 'markerLineColor' : 12,'markerWidth': 400,'markerHeight': 400,'markerDy': 200,'markerDx': 0}}
).addTo(layer);function getTigerPath() {return [ {path :"M57 124C56.2 124 55.4 123.851 54.6 123.553C53.8 123.255 53.1 122.857 52.5 122.361C37.9 109.543 27 97.6449 19.8 86.6673C12.6 75.6857 9 65.4255 9 55.8866C9 40.9822 13.826 29.1083 23.478 20.265C33.126 11.4217 44.3 7 57 7C69.7 7 80.874 11.4217 90.522 20.265C100.174 29.1083 105 40.9822 105 55.8866C105 65.4255 101.4 75.6857 94.2 86.6673C87 97.6449 76.1 109.543 61.5 122.361C60.9 122.857 60.2 123.255 59.4 123.553C58.6 123.851 57.8 124 57 124Z"},{transform: "translate(35,35)",path: "M39.1579 14.6842H22.8421V6.85263C23.4471 6.51098 23.9271 5.98496 24.2126 5.35158L40.7895 3.26316C41.6904 3.26316 42.4211 2.53254 42.4211 1.63158C42.4211 0.730621 41.6904 0 40.7895 0L23.7558 2.12105C23.1534 1.31734 22.2146 0.836021 21.2105 0.815789C19.8932 0.822316 18.709 1.62048 18.2084 2.83895L1.63158 4.89474C0.730621 4.89474 0 5.62536 0 6.52632C0 7.42727 0.730621 8.15789 1.63158 8.15789L18.6653 6.03684C18.9155 6.36414 19.2255 6.64085 19.5789 6.85263V14.6842H3.26316C1.46092 14.6842 0 16.1451 0 17.9474V40.7895C0 42.5917 1.46092 44.0526 3.26316 44.0526H39.1579C40.9601 44.0526 42.4211 42.5917 42.4211 40.7895V17.9474C42.4211 16.1451 40.9601 14.6842 39.1579 14.6842ZM19.5789 34.2632H6.52632V21.2105H19.5789V34.2632ZM35.8947 34.2632H22.8421V21.2105H35.8947V34.2632Z" , fill:"#fff"}];
}
二、加载GIF
由于Maptalks基于canvas,因此需要把gif对象作为maptalks.ui.UIMarker 单独添加到地图中操作
案例为VUE结合npm包,
记得用 npm install maptalks 引入依赖
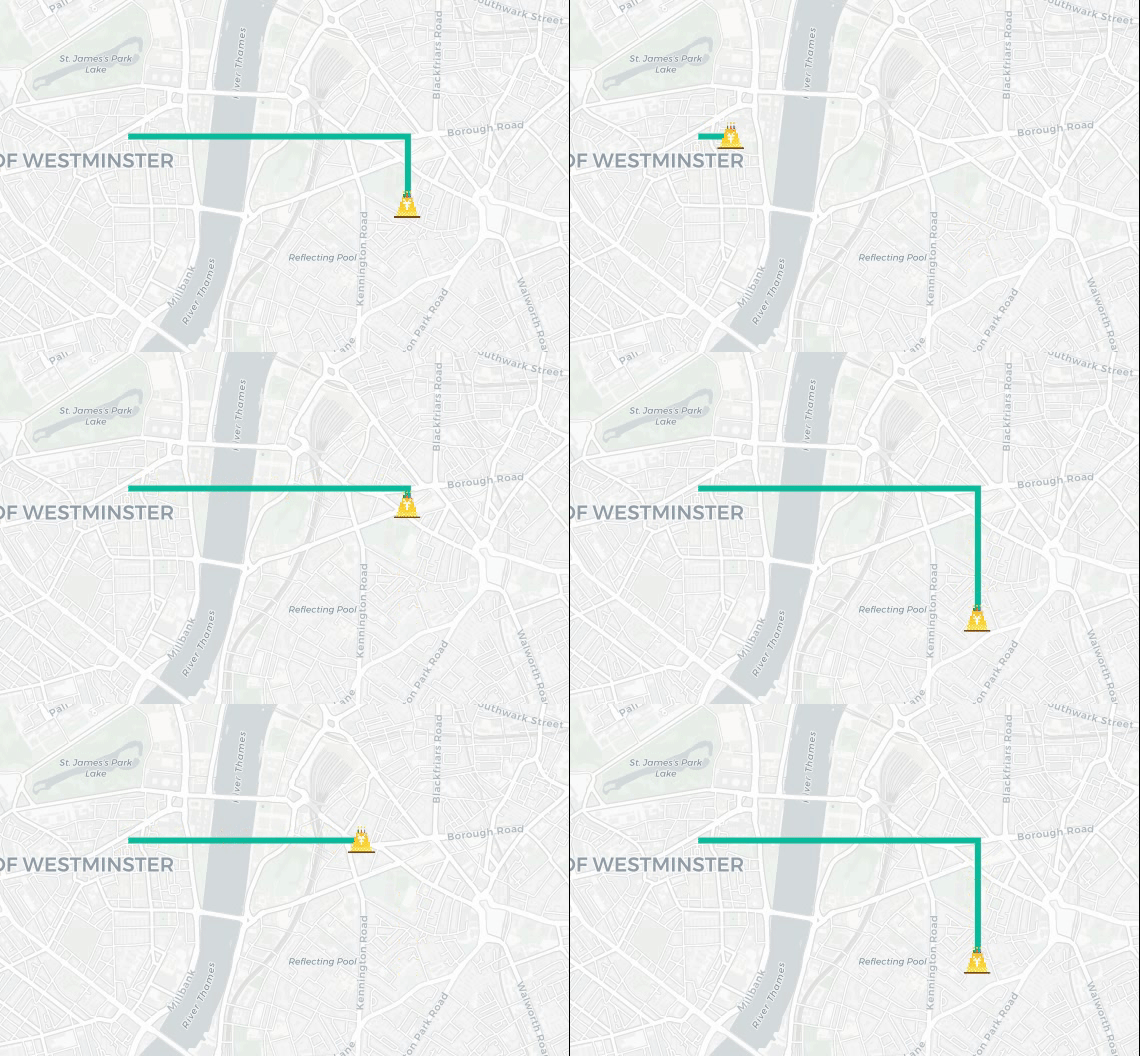
maptalksGIF_75">VUE+maptalks实现GIF可拖拽点

javascript">var map = new maptalks.Map('map', {center: [-0.113049, 51.498568],zoom: 14,baseLayer: new maptalks.TileLayer('base', {urlTemplate: 'https://{s}.basemaps.cartocdn.com/light_all/{z}/{x}/{y}.png',subdomains: ['a', 'b', 'c', 'd'],attribution: '© <a href="http://osm.org">OpenStreetMap</a> contributors, © <a href="https://carto.com/">CARTO</a>',}),});var point = {x: -0.113049,y: 51.498568};// 创建 UIMarkervar markerDiv = document.createElement('div');markerDiv.className = 'marker';var uiMarker = new maptalks.ui.UIMarker(point, {content: markerDiv,draggable: true}).addTo(map);
maptalksGIF_102">VUE+maptalks实现GIF跟随线条动画

javascript"><template><div class="container"><div id="map" class="map-container"></div><div class="pane"><a href="javascript:void(0);" @click="initAnimation">Start Animation</a><a href="javascript:void(0);" @click="removeLineAndMarker">Remove Line & Marker</a></div></div>
</template><script>import maptalks from 'maptalks';export default {name: 'MapAnimation',data() {return {map: null,vectorLayer: null,uiMarker: null,lineString: null,aniTimer: null,path: [{ x: -0.131049, y: 51.498568 },{ x: -0.107049, y: 51.498568 },{ x: -0.107049, y: 51.491568 }]};},mounted() {// 初始化地图this.initializeMap();},methods: {// 初始化地图initializeMap() {this.map = new maptalks.Map('map', {center: [-0.113049, 51.498568],zoom: 14,baseLayer: new maptalks.TileLayer('base', {urlTemplate: 'https://{s}.basemaps.cartocdn.com/light_all/{z}/{x}/{y}.png',subdomains: ['a', 'b', 'c', 'd'],attribution: '© <a href="http://osm.org">OpenStreetMap</a> contributors, © <a href="https://carto.com/">CARTO</a>'})});},// 启动动画initAnimation() {// 清除之前的点和线if (this.vectorLayer) {this.vectorLayer.remove();}if (this.uiMarker) {this.uiMarker.remove();}// 创建 LineString 对象this.lineString = new maptalks.LineString(this.path, {visible: false,arrowStyle: 'classic',arrowPlacement: 'vertex-last',symbol: {'lineColor': '#1bbc9b','lineWidth': 6}});// 创建线条图层并将线条添加到地图中this.vectorLayer = new maptalks.VectorLayer('vector', this.lineString).addTo(this.map);// 创建 UIMarkerconst markerDiv = document.createElement('div');markerDiv.className = 'marker';this.uiMarker = new maptalks.ui.UIMarker(this.path[0], {content: markerDiv}).addTo(this.map);// 播放动画this.replay();// 动画结束后回到起点并重新播放this.aniTimer = setInterval(() => {console.log("Animation restarted");this.replay(); // 自动重新播放}, 1600); // 延迟稍微大于动画时间,以确保动画播放完再重启},// 启动动画replay() {this.lineString.hide(); // 隐藏线条this.lineString.animateShow({duration: 1500, // 动画持续时间easing: 'out', // 动画缓动函数}, (frame, currentCoord) => {//核心要点:获得线当前位置currentCoord赋给uimarkerthis.uiMarker.setCoordinates(currentCoord); // 更新 UIMarker 的位置});},// 移除线条和 UIMarkerremoveLineAndMarker() {// 停止循环播放clearInterval(this.aniTimer);// 删除线条图层this.vectorLayer.remove();// 删除 UIMarkerthis.uiMarker.remove();}}};
</script>
以上代码的优化思路:不需要删除线图层,而是在外部初始化线图层后,使用.clear()方法移除对象,并使用.addGeometry()添加对象来实现循环/重置。
H5版本案例请参考地址:https://download.csdn.net/download/qq_35079107/90247851


![WINFORM - DevExpress -> DevExpress总结[安装、案例]](https://i-blog.csdnimg.cn/blog_migrate/736aabf1bc2a5fd8443599f626983597.png)

