Paper:可解释性之PDP来源之《Greedy Function Approximation: A Gradient Boosting Machine贪心函数逼近:梯度提升机器模型》翻译与解读
目录
《Greedy Function Approximation: A Gradient Boosting Machine贪心函数逼近:梯度提升机器模型》翻译与解读—PDP来源
Abstract
8. Interpretation解释
8.1. Relative importance of input variables
8.2. Partial dependence plots
《Greedy Function Approximation: A Gradient Boosting Machine贪心函数逼近:梯度提升机器模型》翻译与解读—PDP来源
| 来源地址 | https://projecteuclid.org/download/pdf_1/euclid.aos/1013203451 |
| 作者 | Jerome H. Friedman,Stanford University The Annals of Statistics 1999 REITZ LECTURE |
| 发布日期 | 2001年第29卷第5期 1189–1232 |
Abstract
| Function estimation/approximation is viewed from the perspective of numerical optimization in function space, rather than parameter space. A connection is made between stagewise additive expansions and steepest- descent minimization. A general gradient descent “boosting” paradigm is developed for additive expansions based on any fitting criterion. Specific algorithms are presented for least-squares, least absolute deviation, and Huber-M loss functions for regression, and multiclass logistic likelihood for classification. Special enhancements are derived for the particular case where the individual additive components are regression trees, and tools for interpreting such “TreeBoost” models are presented. Gradient boost- ing ofregression trees produces competitive, highly robust, interpretable procedures for both regression and classification, especially appropriate for mining less than clean data. Connections between this approach and the boosting methods ofFreund and Shapire and Friedman, Hastie and Tib- shirani are discussed. | 函数估计/逼近是从函数空间而非参数空间的数值优化的角度来看的。在逐级加性扩展和最陡下降最小化之间建立了联系。基于任意拟合准则,提出了可加性展开式的一般梯度下降“助推”范式。给出了用于回归的最小二乘、最小绝对偏差和 Huber-M 损失函数以及用于分类的多类逻辑似然的特定算法。针对单个可加性组件是回归树的特定情况得出了特殊的增强功能,并提供了用于解释此类“TreeBoost”模型的工具。回归树的梯度提升为回归和分类产生了具有竞争力的、高度稳健的、可解释的过程,特别适用于挖掘不太干净的数据。讨论了这种方法与 Freund 和 Shapire 以及 Friedman、Hastie 和 Tibbhirani 的增强方法之间的联系。 |
8. Interpretation解释
| In many applications it is useful to be able to interpret the derived approximation F(x). This involves gaining an understanding of those particular input variables that are most influential in contributing to its variation, and the nature of the dependence of F(x) on those influential inputs. To the extent that F(x) at least qualitatively reflects the nature of the target function F∗(x) (1), such tools can provide information concerning the underlying relationship between the inputs x and the output variable y. In this section, several tools are presented for interpreting TreeBoost approximations. Although they can be used for interpreting single decision trees, they tend to be more effective in the context of boosting (especially small) trees. These interpretative tools are illustrated on real data examples in Section 9. | 在许多应用中,能够解释导出的近似值 F(x) 是很有用的。 这涉及了解那些对其变化最有影响的特定输入变量,以及 F(x) 依赖于这些有影响的输入的性质。 如果F(x)至少定性地反映了目标函数F∗(x)(1),那么这些工具可以提供关于输入x和输出变量y之间潜在关系的信息。 在本节中,介绍了几种用于解释 TreeBoost 近似的工具。 尽管它们可用于解释单个决策树,但在增强(特别是小的)树的上下文中,它们往往更有效。 这些解释工具在第 9 节中的真实数据示例中进行了说明。 |
8.1. Relative importance of input variables
| Relative importance of input variables. Among the most useful descriptions of an approximation F(x) are the relative influences Ij, of the individual inputs xj, on the variation of F(x) over the joint input variable distribution. One such measure is | 输入变量的相对重要性。在对近似F(x)最有用的描述中,有单独输入xj对F(x)在联合输入变量分布上的变化的相对影响Ij。其中一个衡量标准是 |
8.2. Partial dependence plots
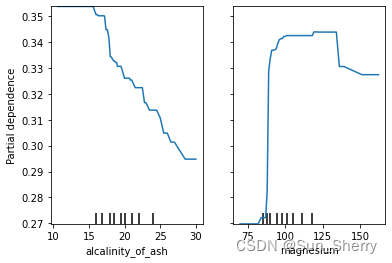
| Partial dependence plots. Visualization is one ofthe most powerful interpretational tools. Graphical renderings ofthe value of F(x) as a function of its arguments provides a comprehensive summary ofits dependence on the joint values ofthe input variables. Unfortunately, such visualization is limited to low-dimensional arguments. Functions ofa single real-valued variable x, F(x) can be plotted as a graph ofthe values of F(x) against each corresponding value of x. Functions ofa single categorical variable can be represented by a bar plot, each bar representing one ofits values, and the bar height the value ofthe function. Functions oftwo real-valued variables can be pictured using contour or perspective mesh plots. Functions ofa categorical variable and another variable (real or categorical) are best summarized by a sequence of(“trellis”) plots, each one showing the dependence of F(x) on the second variable, conditioned on the respective values ofthe first variable [Becker and Cleveland (1996)]. Viewing functions of higher-dimensional arguments is more difficult. It is therefore useful to be able to view the partial dependence of the approximation F(x) on selected small subsets ofthe input variables. Although a collection of such plots can seldom provide a comprehensive depiction ofthe approximation, it can often produce helpful clues, especially when F(x) is dominated by loworder interactions (Section 7). | 部分依赖图,可视化是最强大的解释工具之一。 F(x) 的值作为其参数的函数的图形渲染提供了它对输入变量联合值的依赖性的综合总结。不幸的是,这种可视化仅限于低维参数。单个实值变量 x,F(x) 的函数可以绘制为 F(x) 的值与 x 的每个对应值的关系图。单个分类变量的函数可以用条形图表示,每个条形代表它的一个值,条形高度代表函数的值。可以使用等高线或透视网格图来描绘两个实值变量的函数。一个分类变量和另一个变量(实数或分类)的函数最好用一系列(“格子”)图来概括,每个图都显示了 F(x) 对第二个变量的依赖性,条件是第一个变量的各自值 [Becker and Cleveland(1996)]。 观察高维参数的函数比较困难。因此,能够查看近似 F(x) 对输入变量的选定小子集的部分依赖性是很有用的。尽管此类图的集合很少能提供对近似值的全面描述,但它通常可以产生有用的线索,尤其是当 F(x) 由低阶交互作用支配时(第 7 节)。 |


