查看详细参数:https://blog.csdn.net/dianziagen/article/details/75385224
首先导入依赖:
1、 在Project目录下的build.gradle中添加如下所示的代码:
-
allprojects {repositories {google()jcenter()maven { url "https://jitpack.io" }}}
2、在app目录下的build.gradle中的dependencies闭包下添加如下代码:
implementation 'com.github.PhilJay:MPAndroidChart:v3.0.3'饼状图
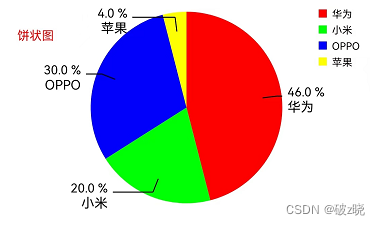
饼状图示例:
布局文件xml:
<!--饼状图--><com.github.mikephil.charting.charts.PieChartandroid:id="@+id/ma_pieChart"android:layout_width="match_parent"android:layout_height="200dp"/>
java代码
/*** 饼状图*/private void initPieChart() {ma_pieChart = findViewById(R.id.ma_pieChart);//创建描述信息Description desc = new Description();desc.setPosition(150,100);desc.setTextSize(12);desc.setTextColor(Color.RED);desc.setText("饼状图");// 饼状图设置 ma_pieChart.setDescription(desc);ma_pieChart.setExtraOffsets(50, 50, 50, 20);//设置pieChart图表上下左右的偏移,类似于外边距ma_pieChart.setHoleRadius(0f);//空心半径ma_pieChart.setTransparentCircleRadius(0f);//设置PieChart内部透明圆的半径(这里设置0fma_pieChart.setDragDecelerationFrictionCoef(0.95f);//设置pieChart图表转动阻力摩擦系数[0,1]ma_pieChart.setRotationAngle(0);//设置pieChart图表起始角度ma_pieChart.setHighlightPerTapEnabled(true);//设置piecahrt图表点击Item高亮是否可用ma_pieChart.setEntryLabelColor(Color.BLACK);//字体颜色ma_pieChart.setRotationEnabled(false);// 设置pieChart图表是否可以手动旋转// 饼状图触摸监听事件ma_pieChart.setOnChartValueSelectedListener(new OnChartValueSelectedListener() {/**选中饼状图区域**/@Overridepublic void onValueSelected(Entry e,Highlight h) {Log.e("*************", "开启");// 转换对象PieEntry pieEntry = (PieEntry) e;Toast.makeText(getApplicationContext(),pieEntry.getLabel(),Toast.LENGTH_SHORT).show();}/**未中饼状图区域**/@Overridepublic void onNothingSelected() {Log.e("*************", "关闭");}});// 数据ArrayList<PieEntry> pieEnters = new ArrayList();pieEnters.add(new PieEntry(46f,"华为"));pieEnters.add(new PieEntry(20f,"小米"));pieEnters.add(new PieEntry(30f,"OPPO"));pieEnters.add(new PieEntry(4f,"苹果"));PieDataSet dataSet = new PieDataSet(pieEnters,"");// 颜色ArrayList<Integer> colors = new ArrayList();colors.add(Color.RED);colors.add(Color.GREEN);colors.add(Color.BLUE);colors.add(Color.YELLOW);// 设置颜色值dataSet.setColors(colors);//数据连接线距图形片内部边界的距离,为百分数dataSet.setValueLinePart1OffsetPercentage(80f);//设置线的长度dataSet.setValueLinePart1Length(0.9f);dataSet.setValueLinePart2Length(0.9f);// 设置线的颜色dataSet.setValueLineColor(Color.BLACK);//设置文字和数据图外显示dataSet.setXValuePosition(PieDataSet.ValuePosition.OUTSIDE_SLICE);dataSet.setYValuePosition(PieDataSet.ValuePosition.OUTSIDE_SLICE);/**设置图例**/Legend legend = ma_pieChart.getLegend();legend.setVerticalAlignment(Legend.LegendVerticalAlignment.TOP);legend.setHorizontalAlignment(Legend.LegendHorizontalAlignment.RIGHT);legend.setOrientation(Legend.LegendOrientation.VERTICAL);legend.setDrawInside(false);legend.setXEntrySpace(7f);legend.setYEntrySpace(0f);legend.setYOffset(0f);/**设置数据**/PieData pieData = new PieData(dataSet);pieData.setDrawValues(true);pieData.setValueFormatter(new PercentFormatter());//显示百分比pieData.setValueTextColor(Color.BLACK);// 百分比字体颜色pieData.setValueTextSize(12f);// 百分比字体大小ma_pieChart.setData(pieData);ma_pieChart.animateX(1400,Easing.EasingOption.EaseInOutQuad);//X轴动画// ma_pieChart.animateY(1400,Easing.EasingOption.EaseInOutQuad);//Y轴动画ma_pieChart.invalidate();}柱状图
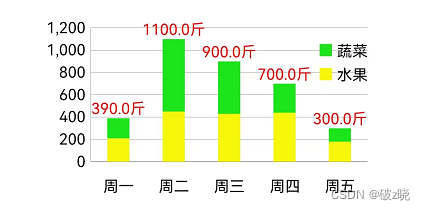
柱状图示例:
布局文件xml:
<!--柱状图--><com.github.mikephil.charting.charts.BarChartandroid:id="@+id/ma_barChart"android:layout_width="match_parent"android:layout_height="200dp"/>java代码:
/*** 柱状图*/private void initBarChart() {ma_barChart = findViewById(R.id.ma_barChart);ma_barChart.getDescription().setEnabled(false); // 不显示描述ma_barChart.setExtraOffsets(20,20,20,20); // 设置饼图的偏移量,类似于内边距 ,设置视图窗口大小ma_barChart.setDragEnabled(false);// 是否可以拖拽ma_barChart.setScaleEnabled(false);//是否可放大ma_barChart.setDrawGridBackground(false);//是否绘制网格线/**设置坐标轴**/// 设置x轴XAxis xAxis = ma_barChart.getXAxis();xAxis.setPosition(XAxis.XAxisPosition.BOTTOM); // 设置x轴显示在下方,默认在上方xAxis.setDrawGridLines(false); // 将此设置为true,绘制该轴的网格线。xAxis.setLabelCount(5); // 设置x轴上的标签个数xAxis.setTextSize(15f); // x轴上标签的大小final String labelName[] = {"周一","周二","周三","周四","周五"};// 设置x轴显示的值的格式xAxis.setValueFormatter(new IAxisValueFormatter() {@Overridepublic String getFormattedValue(float value,AxisBase axis) {if ((int) value < labelName.length) {return labelName[(int) value];} else {return "";}}});xAxis.setYOffset(15); // 设置标签对x轴的偏移量,垂直方向//ma_barChart.animateX(1400,Easing.EasingOption.EaseInSine);// X轴动画// 设置y轴,y轴有两条,分别为左和右YAxis yAxis_right = ma_barChart.getAxisRight();yAxis_right.setAxisMaximum(1200f); // 设置y轴的最大值yAxis_right.setAxisMinimum(0f); // 设置y轴的最小值yAxis_right.setEnabled(false); // 不显示右边的y轴YAxis yAxis_left = ma_barChart.getAxisLeft();yAxis_left.setAxisMaximum(1200f);yAxis_left.setAxisMinimum(0f);yAxis_left.setTextSize(15f); // 设置y轴的标签大小ma_barChart.animateY(1400,Easing.EasingOption.EaseInSine);// y轴动画/**设置图例**/Legend legend = ma_barChart.getLegend();legend.setFormSize(12f); // 图例的图形大小legend.setTextSize(15f); // 图例的文字大小legend.setDrawInside(true); // 设置图例在图中legend.setOrientation(Legend.LegendOrientation.VERTICAL); // 图例的方向为垂直legend.setHorizontalAlignment(Legend.LegendHorizontalAlignment.RIGHT); //显示位置,水平右对齐legend.setVerticalAlignment(Legend.LegendVerticalAlignment.TOP); // 显示位置,垂直上对齐// 设置水平与垂直方向的偏移量legend.setYOffset(10f);legend.setXOffset(10f);/**设置数据**/List<IBarDataSet> sets = new ArrayList<>();// 此处有两个DataSet,所以有两条柱子,BarEntry()中的x和y分别表示显示的位置和高度// x是横坐标,表示位置,y是纵坐标,表示高度List<BarEntry> barEntries1 = new ArrayList<>();barEntries1.add(new BarEntry(0, 390f));barEntries1.add(new BarEntry(1, 1100f));barEntries1.add(new BarEntry(2, 900f));barEntries1.add(new BarEntry(3, 700f));barEntries1.add(new BarEntry(4, 300f));BarDataSet barDataSet1 = new BarDataSet(barEntries1, "");barDataSet1.setValueTextColor(Color.RED); // 值的颜色barDataSet1.setValueTextSize(15f); // 值的大小barDataSet1.setColor(Color.parseColor("#1AE61A")); // 柱子的颜色barDataSet1.setLabel("蔬菜"); // 设置标签之后,图例的内容默认会以设置的标签显示// 设置柱子上数据显示的格式barDataSet1.setValueFormatter(new IValueFormatter() {@Overridepublic String getFormattedValue(float value,Entry entry,int dataSetIndex,ViewPortHandler viewPortHandler) {// 此处的value默认保存一位小数return value + "斤";}});sets.add(barDataSet1);List<BarEntry> barEntries2 = new ArrayList<>();barEntries2.add(new BarEntry(0, 210f));barEntries2.add(new BarEntry(1, 450f));barEntries2.add(new BarEntry(2, 430f));barEntries2.add(new BarEntry(3, 440f));barEntries2.add(new BarEntry(4, 180f));BarDataSet barDataSet2 = new BarDataSet(barEntries2, "");// 不显示第二根柱子上的值barDataSet2.setDrawValues(false); // 不显示值barDataSet2.setColor(Color.parseColor("#F7F709"));barDataSet2.setLabel("水果");sets.add(barDataSet2);BarData barData = new BarData(sets);barData.setBarWidth(0.4f); // 设置柱子的宽度ma_barChart.setData(barData);}折线图
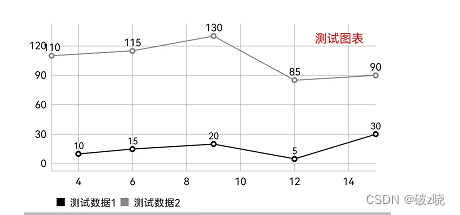
折线图示例:
布局文件xml:
<!--折线图--><com.github.mikephil.charting.charts.LineChartandroid:id="@+id/ma_lineChart"android:layout_width="match_parent"android:layout_height="200dp"/>java代码:
/*** 折线图* */private void initLineChart(){ma_lineChart = findViewById(R.id.ma_lineChart);//X轴所在位置 默认为上面ma_lineChart.getXAxis().setPosition(XAxis.XAxisPosition.BOTTOM);//隐藏右边的Y轴ma_lineChart.getAxisRight().setEnabled(false);//创建描述信息Description description =new Description();description.setPosition(1000,100);description.setText("测试图表");description.setTextColor(Color.RED);description.setTextSize(12);ma_lineChart.setDescription(description);//设置图表描述信息ma_lineChart.setNoDataText("没有数据熬");//没有数据时显示的文字ma_lineChart.setNoDataTextColor(Color.BLUE);//没有数据时显示文字的颜色ma_lineChart.setDrawGridBackground(false);//chart 绘图区后面的背景矩形将绘制ma_lineChart.setDrawBorders(false);//禁止绘制图表边框的线//ma_lineChart.setBorderColor(); //设置 chart 边框线的颜色。//ma_lineChart.setBorderWidth(); //设置 chart 边界线的宽度,单位 dp。//ma_lineChart.setLogEnabled(true);//打印日志/*** Entry 坐标点对象 构造函数 第一个参数为x点坐标 第二个为y点*/ArrayList<Entry> values1 = new ArrayList<>();ArrayList<Entry> values2 = new ArrayList<>();values1.add(new Entry(4,10));values1.add(new Entry(6,15));values1.add(new Entry(9,20));values1.add(new Entry(12,5));values1.add(new Entry(15,30));values2.add(new Entry(3,110));values2.add(new Entry(6,115));values2.add(new Entry(9,130));values2.add(new Entry(12,85));values2.add(new Entry(15,90));//LineDataSet每一个对象就是一条连接线LineDataSet set1;LineDataSet set2;//判断图表中原来是否有数据if (ma_lineChart.getData() != null &&ma_lineChart.getData().getDataSetCount() > 0) {//获取数据1set1 = (LineDataSet) ma_lineChart.getData().getDataSetByIndex(0);set1.setValues(values1);set2= (LineDataSet) ma_lineChart.getData().getDataSetByIndex(1);set2.setValues(values2);//刷新数据ma_lineChart.getData().notifyDataChanged();ma_lineChart.notifyDataSetChanged();} else {//设置数据1 参数1:数据源 参数2:图例名称set1 = new LineDataSet(values1,"测试数据1");set1.setColor(Color.BLACK);set1.setCircleColor(Color.BLACK);set1.setLineWidth(1f);//设置线宽set1.setCircleRadius(3f);//设置焦点圆心的大小set1.enableDashedHighlightLine(10f,5f,0f);//点击后的高亮线的显示样式set1.setHighlightLineWidth(2f);//设置点击交点后显示高亮线宽set1.setHighlightEnabled(true);//是否禁用点击高亮线set1.setHighLightColor(Color.RED);//设置点击交点后显示交高亮线的颜色set1.setValueTextSize(9f);//设置显示值的文字大小set1.setDrawFilled(false);//设置禁用范围背景填充//格式化显示数据final DecimalFormat mFormat = new DecimalFormat("###,###,##0");set1.setValueFormatter(new IValueFormatter() {@Overridepublic String getFormattedValue(float value,Entry entry,int dataSetIndex,ViewPortHandler viewPortHandler) {return mFormat.format(value);}});if (Utils.getSDKInt() >= 18) {set1.setFillAlpha(Color.argb(1,255,0,0));//设置范围背景填充} else {set1.setFillColor(Color.BLACK);}//设置数据2set2 = new LineDataSet(values2,"测试数据2");set2.setColor(Color.GRAY);set2.setCircleColor(Color.GRAY);set2.setLineWidth(1f);set2.setCircleRadius(3f);set2.setValueTextSize(10f);//保存LineDataSet集合ArrayList<ILineDataSet> dataSets = new ArrayList<>();dataSets.add(set1); // add the datasetsdataSets.add(set2);//创建LineData对象 属于LineChart折线图的数据集合LineData data = new LineData(dataSets);// 添加到图表中ma_lineChart.setData(data);//ma_lineChart.animateX(1400,Easing.EasingOption.EaseInOutSine);// y轴动画ma_lineChart.animateY(1400,Easing.EasingOption.EaseInOutSine);// y轴动画//绘制图表ma_lineChart.invalidate();}}
