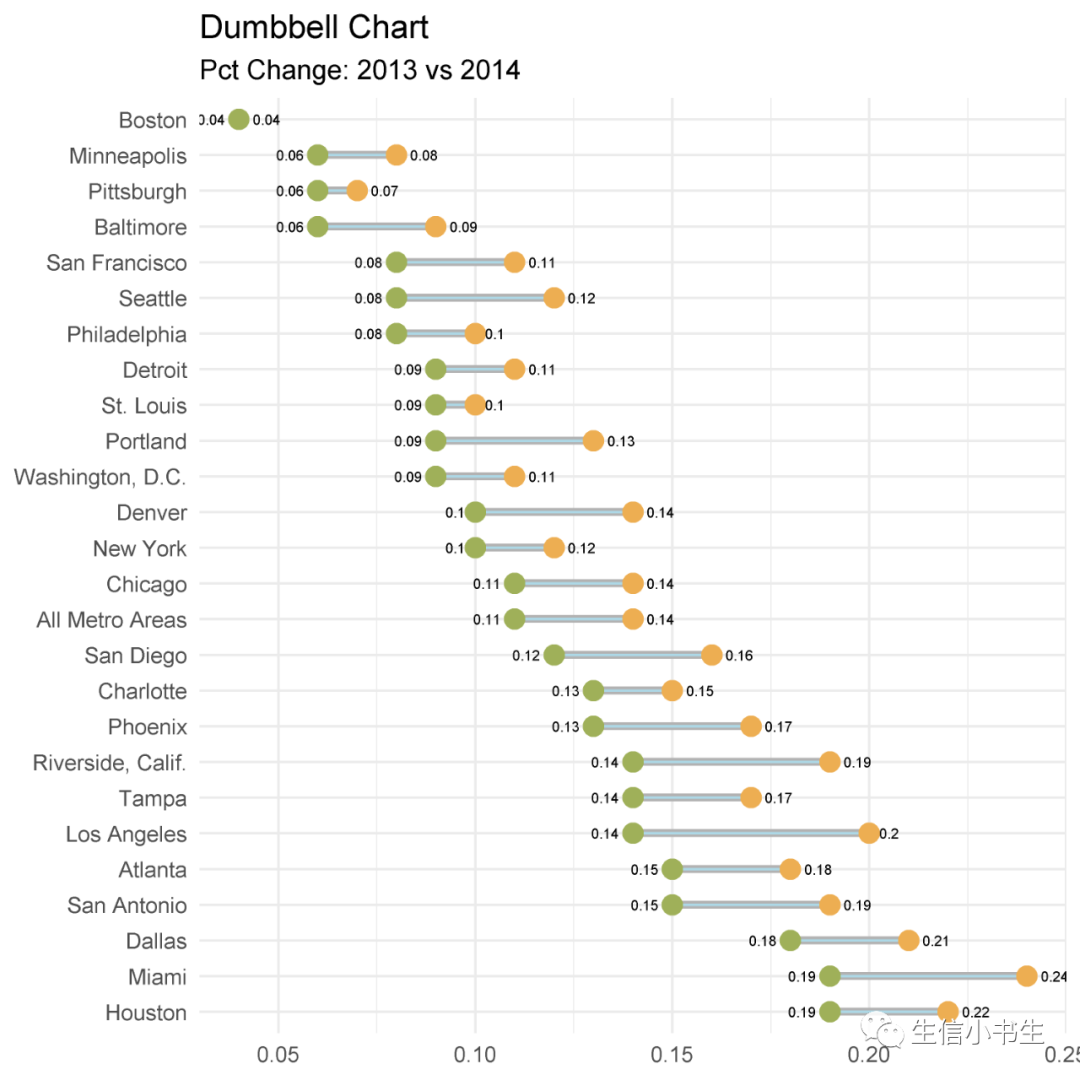
棒棒糖图与条形图类似。一般可以使用geom_point()和geom_segment()来画棒棒糖图。借用条形图的数据,我们这里用棒棒糖图来实现它。
library(ggplot2)
theme_set(theme_bw())ggplot(mtcars, aes(x=`car name`, y=mpg_z, label=mpg_z)棒棒糖图与条形图类似。一般可以使用geom_point()和geom_segment()来画棒棒糖图。借用条形图的数据,我们这里用棒棒糖图来实现它。
library(ggplot2)
theme_set(theme_bw())ggplot(mtcars, aes(x=`car name`, y=mpg_z, label=mpg_z)