中医说感冒可分为风热感冒、风寒感冒和暑湿感冒。感冒是因为受寒。这有科学依据或临床试验依据吗?
美国科学家富兰克林年轻时就患有严重的呼吸系统疾病。对,就是这个喜欢玩电,差点被电击的疯狂人士。

添加图片注释,不超过 140 字(可选)
因此,他对普通感冒及其成因非常感兴趣。他通过亲自去寒冷地方试验。驳斥了普遍的观念,即温度变化(尤其是暴露于冷空气中)使人们易于感冒。他认为不流通空气容易含有超标致病微生物,这容易导致呼吸系统疾病。另外他认为温差变化过大,导致人体免疫系统不稳定,容易被体内条件致病微生物感染或被外界微生物感染。
他对普通感冒及其成因非常感兴趣。他驳斥了普遍的观念,即温度变化(尤其是暴露于冷空气中)使人们易于感冒。他建议改为空气中有腐烂的物质。基于这种信念,富兰克林主张适当的通风是保持良好健康所必需的。
感冒不是因为冷。受凉使得免疫力降低(分配给免疫系统的能量少了),体温变低使得体内环境更加适合病毒和细菌生活,病毒等致病微生物再感染,最终导致感冒。
根据现代医学不断发展,人类发现某些鼻病毒或其他病毒在低温下更容易复制。受凉使得免疫力降低(分配给免疫系统的能量少了),体温变低使得体内环境更加适合病毒和细菌生活,病毒等致病微生物再感染,最终导致感冒。
证据链接
Temperature-dependent innate defense against the common cold virus limits viral replication at warm temperature in mouse airway cells
根据温差变化可以影响人体免疫力,从而致病原理,我早在七八年前写过一些简单模拟程序,源代码和可视化结果如下。这里只做抛砖引玉,希望知乎各位大神继续优化补充。
欢迎各位学习更多相关知识,python机器学习生物信息学,博主录制,2k超清

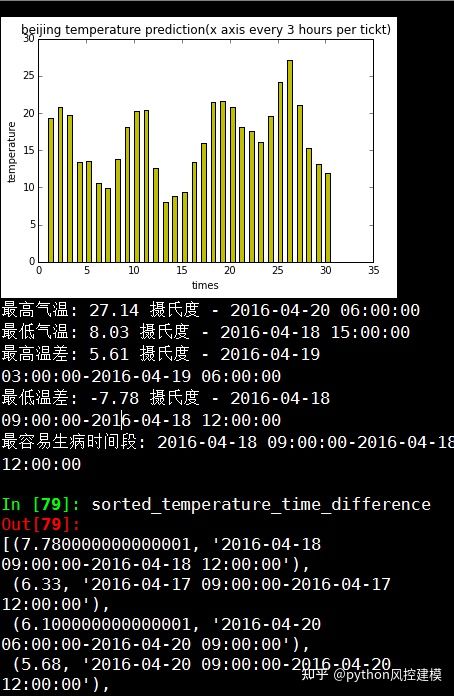
北京数据
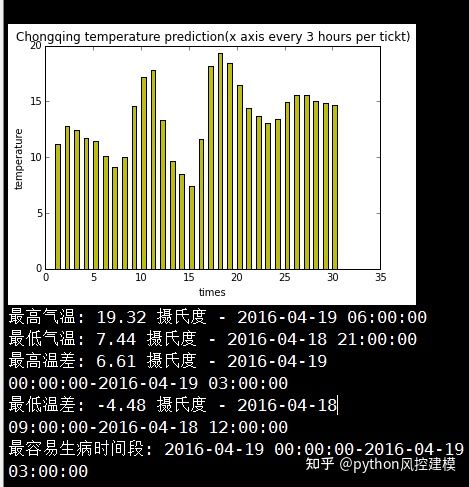
重庆数据
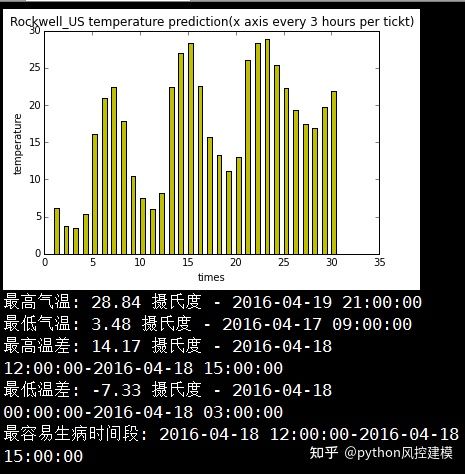
美国Rockwell

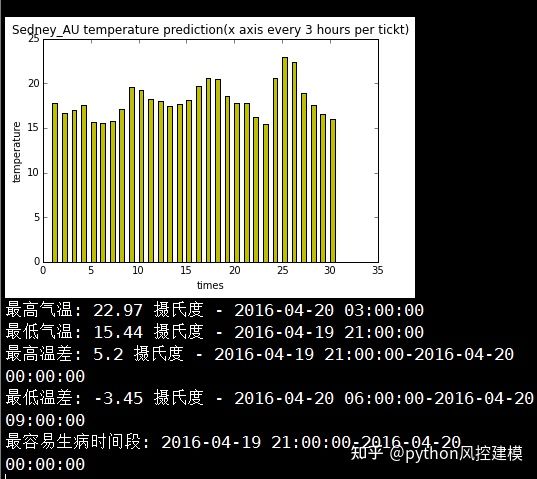
澳大利亚悉尼
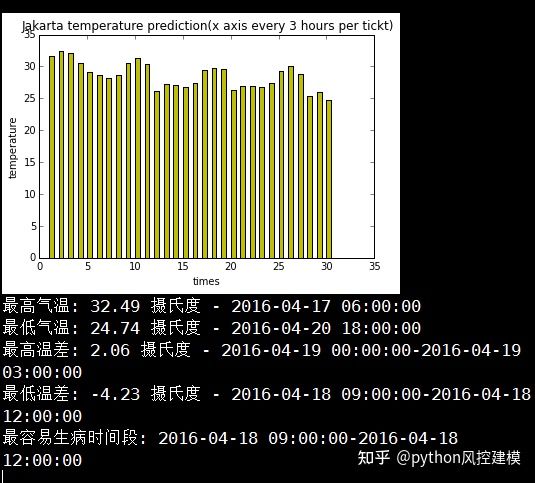
印尼雅加达
London 英国

# -*- coding: utf-8 -*-
#原创公众号pythonEducation
# quickWeather.py - Prints the current weather for a location from the command line.
"""
k(开尔文)=273.15+T(摄氏度) json返回的是开尔文温度
"""import json, requests,sys,pylab,numpy#城市名称
cityName="beijing"
#城市ID号
cityID="2038349"
#我的免费appID
appID="0383ae59663e14ab5a6855d5b6ad5d00"
#获取时间段数
cnt="30"
# Download the JSON data from OpenWeatherMap.org's API
url="http://api.openweathermap.org/data/2.5/forecast/city?id=%s&APPID=%s&cnt=%s"%(cityID,appID,cnt)
response = requests.get(url)
response.raise_for_status()# Load JSON data into a Python variable.
weatherData = json.loads(response.text)# Print weather descriptions.
#主要获取weatherData---weather---main和description信息
w = weatherData['list']
print('Current weather in %s:' % (cityName))temperature_list=[]
cnt_list=[]
time_list=[]
for i in range(int(cnt)):time=w[i]['dt_txt']print(time)main=w[i]['weather'][0]['main']description=w[i]['weather'][0]['description']temp=w[i]['main']['temp']temp_Chinese=temp-273.15temp_Chinese_round=round(temp_Chinese,2)temperature_list.append(temp_Chinese_round)cnt_list.append(i+1)time_list.append(str(time))print(main, '-',description,'-',temp_Chinese_round,"摄氏度")print()barwidth=0.5
pylab.bar(cnt_list,temperature_list,width=barwidth,color='y')
pylab.xlabel("times")
pylab.ylabel('temperature')
pylab.title("%s temperature prediction(x axis every 3 hours per tickt)"%cityName)
pylab.show()#计算最高气温和最低气温
list_temperature_time=zip(temperature_list,time_list)
dict_temperature_time=dict(list_temperature_time)
max_temp=max(dict_temperature_time.keys())
min_temp=min(dict_temperature_time.keys())
print("最高气温:",max_temp,'摄氏度','-',dict_temperature_time[max_temp])
print("最低气温:",min_temp,'摄氏度','-',dict_temperature_time[min_temp])#温差列表,用于统计哪天人最容易生病
temperature_difference_list=[]
for i in range(len(temperature_list)-1):temperature_difference=temperature_list[i+1]-temperature_list[i]temperature_difference_list.append(temperature_difference)time_difference_list=[]
for i in range(len(time_list)-1):time_difference=time_list[i]+'-'+time_list[i+1]time_difference_list.append(time_difference)list_temperature_time_difference=zip(temperature_difference_list,time_difference_list)
dict_temperature_time_difference=dict(list_temperature_time_difference)
max_temp_difference=max(dict_temperature_time_difference.keys())
min_temp_difference=min(dict_temperature_time_difference.keys())
print("最高温差:",round(max_temp_difference,2),'摄氏度','-',dict_temperature_time_difference[max_temp_difference])
print("最低温差:",round(min_temp_difference,2),'摄氏度','-',dict_temperature_time_difference[min_temp_difference])#最容易生病时间段,取温差绝对值最大的key
if abs(max_temp_difference)>abs(min_temp_difference):ill_likely_day=dict_temperature_time_difference[max_temp_difference]
else:ill_likely_day=dict_temperature_time_difference[min_temp_difference]
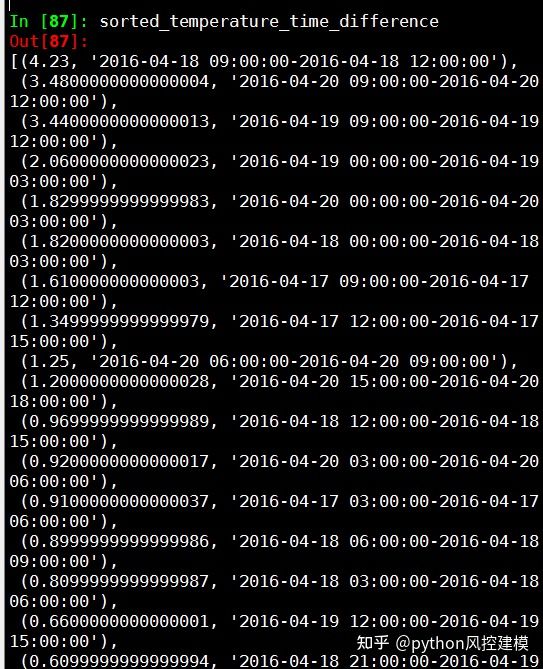
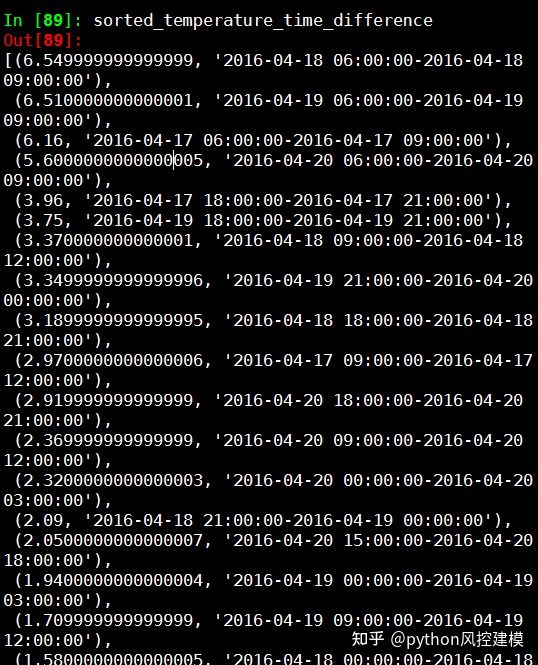
print("最容易生病时间段:",ill_likely_day)#统计温差又高到底排序的时间段
#温差绝对值列表
absolute_temperature_difference_list=[abs(i) for i in temperature_difference_list]
list_temperature_time_difference=zip(absolute_temperature_difference_list,time_difference_list)
dict_absolute_temperature_time_difference=dict(list_temperature_time_difference)
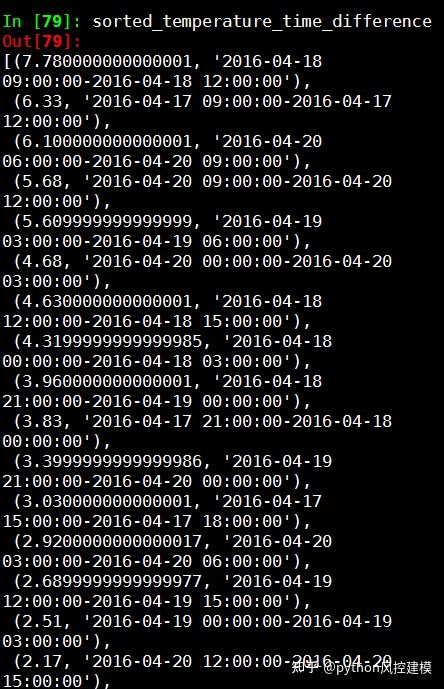
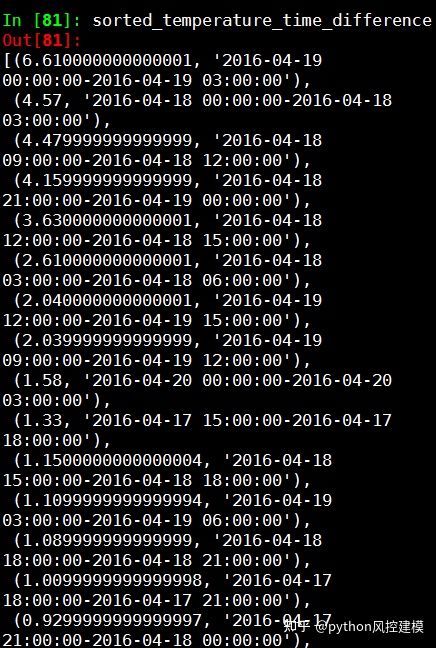
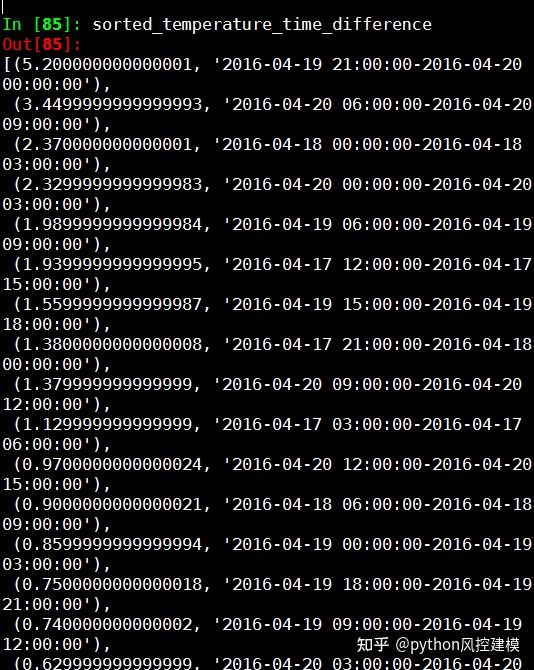
sorted_temperature_time_difference=sorted(dict_absolute_temperature_time_difference.items(),reverse=True)'''
# Compute location from command line arguments.
if len(sys.argv) < 2:print('Usage: quickWeather.py location')sys.exit()
location = ' '.join(sys.argv[1:])len(weatherData)
Out[21]: 5
for i in weatherData:print(i)
city #城市信息
cod #内部参数
cnt #预测天数
list #信息列表,主要获取weatherData---weather---main和description信息
message #内部参数weatherData
Out[23]:
{'city': {'coord': {'lat': 30.25, 'lon': 107.75},'country': 'CN','id': 1814905,'name': 'Chongqing Shi','population': 0,'sys': {'population': 0}},'cnt': 1,'cod': '200','list': [{'clouds': {'all': 44},'dt': 1460775600,'dt_txt': '2016-04-16 03:00:00','main': {'grnd_level': 937.55,'humidity': 98,'pressure': 937.55,'sea_level': 1025.81,'temp': 288.16,'temp_kf': 0.4,'temp_max': 288.16,'temp_min': 287.759},'rain': {'3h': 0.01},'sys': {'pod': 'd'},'weather': [{'description': 'light rain','icon': '10d','id': 500,'main': 'Rain'}],'wind': {'deg': 267.501, 'speed': 1.63}}],'message': 0.0109}#pylab.hist(temperature_list)
pylab.plot(cnt_list,temperature_list,'ro')
pylab.xlabel("times")
pylab.ylabel('temperature')
pylab.title("%s temperature prediction"%cityName)
pylab.show()
'''