🌮开发平台:jupyter lab
🍖运行环境:python3、TensorFlow2.x
----------------------------------------------- 2022.9.16 测验成功 ----------------------------------------------------------------
1. 时间序列预测:用电量预测 01 数据分析与建模
2. 时间序列预测:用电量预测 02 KNN(K邻近算法)
3. 时间序列预测:用电量预测 03 Linear(多元线性回归算法 & 数据未标准化)
4.时间序列预测:用电量预测 04 Std_Linear(多元线性回归算法 & 数据标准化)
5. 时间序列预测:用电量预测 05 BP神经网络
6.时间序列预测:用电量预测 06 长短期记忆网络LSTM
7. 时间序列预测:用电量预测 07 灰色预测算法
- 数据来源:Individual household electric power consumption Data Set(点击跳转数据集下载页面)
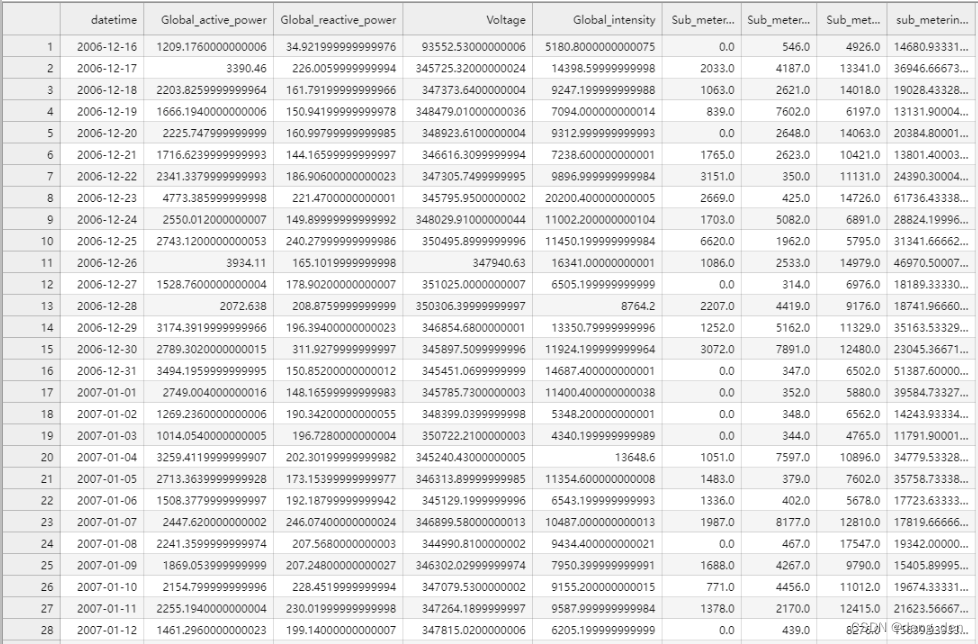
说明:根据上述列表中 1.时间序列预测:用电量预测 01 数据分析与建模 进行数据整理,得到household_power_consumption_days.csv文件,部分数据展示如下:
用电量预测 02 KNN(K邻近算法)
- 1.导包
- 2. 拆分数据集和训练集
- 3.构建模型,进行测试集数据预测
- 4.数据展示
- 4.1 以表格形式对比测试集原始目标数据和预测目标数据
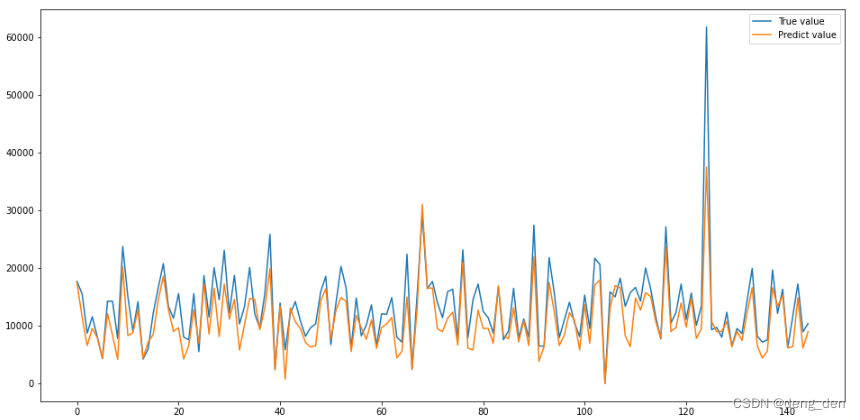
- 4.2 以可视化图的形式对比测试集原始目标数据和预测目标数据
- 5.拓展:评估参数
1.导包
### KNN
## 测试数据:表格的后150个数据为测试数据
import pandas as pd
import warnings
warnings.filterwarnings('ignore')
2. 拆分数据集和训练集
### 2.1 将日期变作index
dataset = pd.read_csv('../household_power_consumption_days.csv',engine='python',encoding='utf8')
dataset.head(15)### 2.2 防止后续需要用到原始数据逆标准化,得关键字
data = dataset.copy()
data.keys()
## Index(['datetime', 'Global_active_power','Global_reactive_power', 'Voltage','Global_intensity', 'Sub_metering_1', 'Sub_metering_2','Sub_metering_3', 'sub_metering_4'],dtype='object')### 2.3 定义自变量和因变量
## 定义自变量
x_keys = ['Global_active_power', 'Global_reactive_power', 'Voltage','Global_intensity', 'Sub_metering_1', 'Sub_metering_2','Sub_metering_3']
x = data[x_keys]
## 定义因变量
y_keys = ['sub_metering_4']
y = data[y_keys]### 2.4 导包,划分训练集和测试集
from sklearn.model_selection import train_test_split
##把数据集分为测试集和训练集
x_train,x_test,y_train,y_test = train_test_split(x,y,test_size=0.1)

3.构建模型,进行测试集数据预测
from sklearn.neighbors import KNeighborsClassifier
## n_neighbors=3最优参数可以自己去调
knnModel = KNeighborsClassifier(n_neighbors=3)
knnModel.fit(x_train,y_train.astype('int'))
knnModel.score(x_test,y_test.astype('int'))
# out:0.006896551724137931## 预测测试集数据
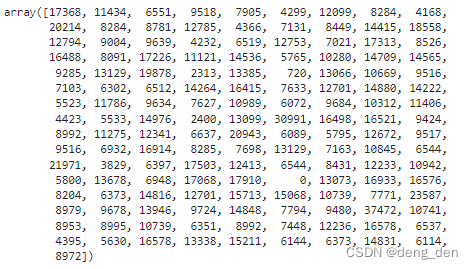
y_test_predict = knnModel.predict(x_test)
y_test_predict
# out: array([17368, 11434,  6551,  9518,  7905,  4299, 12099,  8284, ...,8972])
4.数据展示
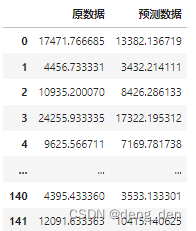
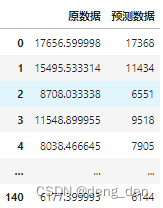
4.1 以表格形式对比测试集原始目标数据和预测目标数据
len(y_test),len(y_test_predict) #(145, 145)#将df中的数据转换为array格式
col=y_test.iloc[:,-1]
y_test=col.values
y_test  ## array([17656.5999984 , ... ,  8708.0333376])## 将array列合并成df表格
compare = pd.DataFrame({"原数据":y_test,"预测数据":y_test_predict})
compare
4.2 以可视化图的形式对比测试集原始目标数据和预测目标数据
import matplotlib.pyplot as plt
# 绘制 预测与真值结果
plt.figure(figsize=(16,8))
plt.plot(y_test, label="True value")
plt.plot(y_test_predict, label="Predict value")
plt.legend(loc='best')
plt.show()
5.拓展:评估参数
import math
def get_mse(records_real, records_predict):"""均方误差 估计值与真值 偏差"""if len(records_real) == len(records_predict):return sum([(x - y) ** 2 for x, y in zip(records_real, records_predict)]) / len(records_real)else:return Nonedef get_rmse(records_real, records_predict):"""均方根误差:是均方误差的算术平方根"""mse = get_mse(records_real, records_predict)if mse:return math.sqrt(mse)else:return Nonedef get_mae(records_real, records_predict):"""平均绝对误差"""if len(records_real) == len(records_predict):return sum([abs(x - y) for x, y in zip(records_real, records_predict)]) / len(records_real)else:return None## 以表格形式展示
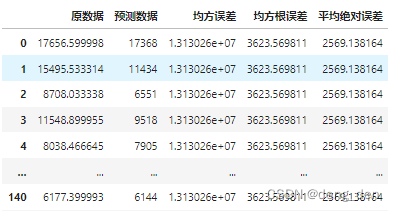
compare['均方误差'] = get_mse(y_test,y_test_predict)
compare['均方根误差'] = get_rmse(y_test,y_test_predict)
compare['平均绝对误差'] = get_mae(y_test,y_test_predict)
compare
