提示:文章写完后,目录可以自动生成,如何生成可参考右边的帮助文档
文章目录
- 前言
- 一、EEMD去噪
- 二、使用步骤
- 1.代码展示
- 2.function [spmax, spmin, flag]= extrema(in_data)
- 2.functi代码如下(示例):
- 结果展示
前言
提示:这里可以添加本文要记录的大概内容:
例如:随着人工智能的不断发展,机器学习这门技术也越来越重要,很多人都开启了学习机器学习,本文就介绍了机器学习的基础内容。
提示:以下是本篇文章正文内容,下面案例可供参考
一、EEMD去噪
EEMD方法的本质是一种叠加高斯白噪声的多次经验模式分解,利用了高斯白噪声具有频率均匀分布的统计特性,通过每次加入同等幅值的不同白噪声来改变信号的极值点特性,之后对多次EMD得到的相应IMF进行总体平均来抵消加入的白噪声,从而有效抑制模态混叠的产生。EEMD分解步骤如下:
(1)设定总体平均次数M;
(2)将一个具有标准正态分布的白噪声加到原始信号上,以产生多个新的信号: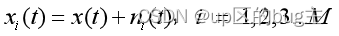
式中表示第i次加性白噪声序列,表示第i次试验的附加噪声信号;
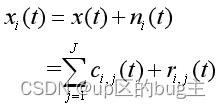
(3)对所得含噪声的信号分别进行EMD分解,得到各自和的形式:
式中,为第i次加入白噪声后分解得到的第j个imf;是残余函数;J的IMF数量;
(4)重复步骤(2)和步骤(3)进行M次,每次分解加入幅值不同的白噪声信号得到的集合为:
(5)利用不相关序列的统计平均值为零的原理, 将上述对应的进行集合平均运算,得到EEMD分解后最终的,即:
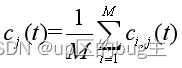
式中是EEMD分解的第j个IMF。
二、使用步骤
1.代码展示
代码如下(示例):
clc;
clear;
close all;
tic;
%% 产生仿真信号
fs=100; %数据采样率Hz
t=1:1/fs:4096*1/fs; %对数据进行采样
n = length(t); %数据的采样数目
f1 =0.25; %信号的频率
f2=0.005;x=8*sin(2*pi*f1*t+cos(2*pi*f2*t))+10*cos(0.43*t);x=x'; %产生原始信号,将其转置为列向量
nt=3*randn(n,1); %高斯白噪声生成
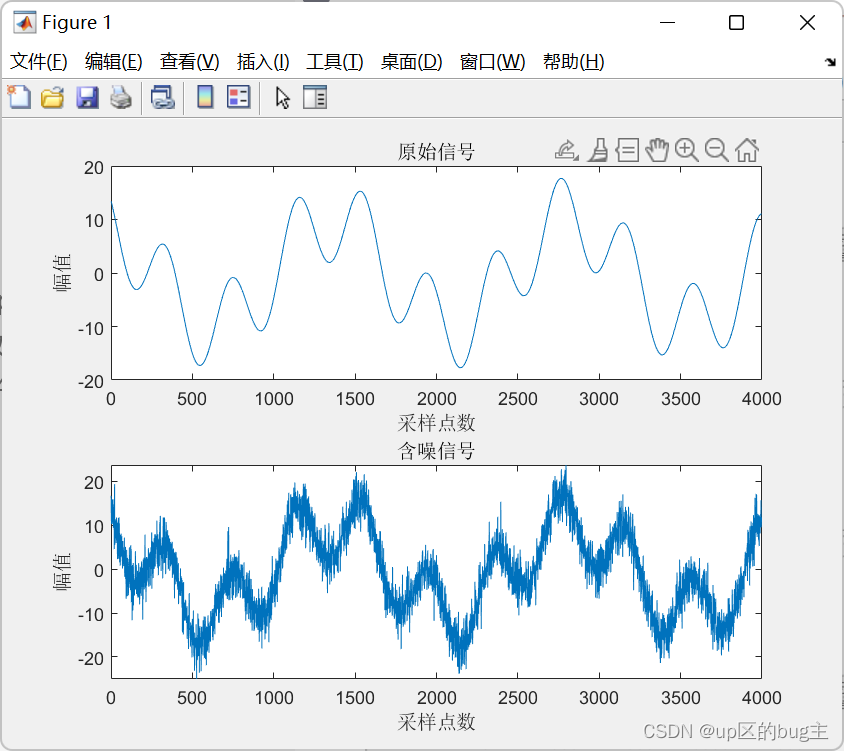
y=x+nt; %含噪信号figure(1);
subplot(2,1,1);plot(x);title('原始信号');xlabel('采样点数');ylabel('幅值');
subplot(2,1,2);plot(y);title('含噪信号');xlabel('采样点数');ylabel('幅值');
%% EEMD分解Nstd=0.2*std(y);
NE=30;
imf=eemd(y,Nstd,NE);
figure(2);
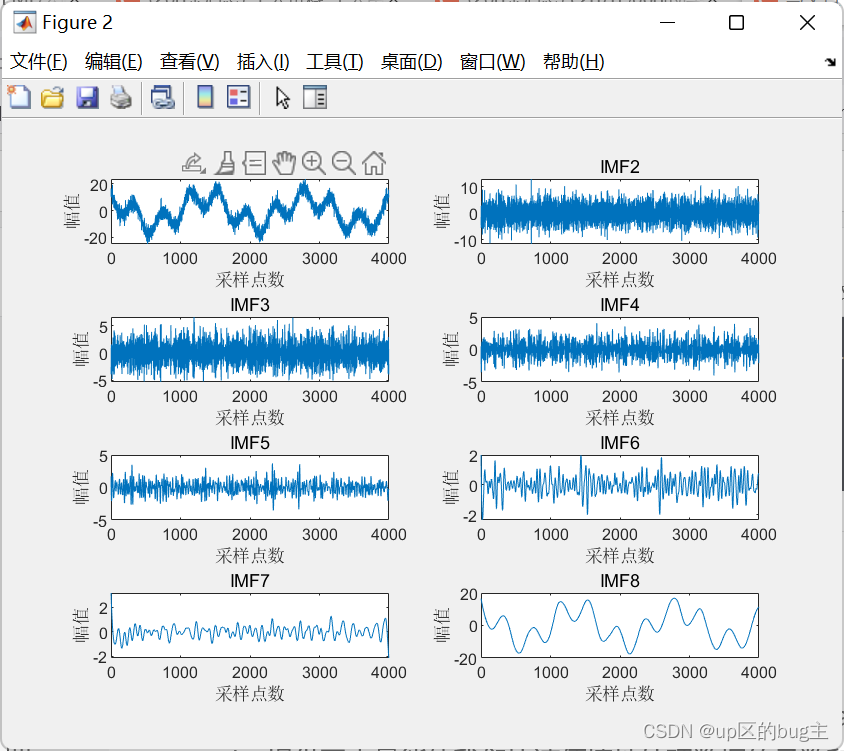
% IMF1是原始输入信号y,IMF2-IMF7是从高频到低频的IMF分量,IMF8是残余分量
subplot(4,2,1); plot(imf(:,1));title('IMF1');xlabel('采样点数');ylabel('幅值');
subplot(4,2,2); plot(imf(:,2));title('IMF2');xlabel('采样点数');ylabel('幅值');
subplot(4,2,3); plot(imf(:,3));title('IMF3');xlabel('采样点数');ylabel('幅值');
subplot(4,2,4); plot(imf(:,4));title('IMF4');xlabel('采样点数');ylabel('幅值');
subplot(4,2,5); plot(imf(:,5));title('IMF5');xlabel('采样点数');ylabel('幅值');
subplot(4,2,6); plot(imf(:,6));title('IMF6');xlabel('采样点数');ylabel('幅值');
subplot(4,2,7); plot(imf(:,7));title('IMF7');xlabel('采样点数');ylabel('幅值');
subplot(4,2,8); plot(imf(:,8));title('IMF8');xlabel('采样点数');ylabel('幅值');
imf=imf(:,2:8);
n=7;
r=zeros(1,n);
for i=1:n% 求相关系数r(1,i)=sum((y-mean(y)).*(imf(:,i)-mean(imf(:,i))),1)./sqrt(sum(((y-mean(y)).^2),1).*sum(((imf(:,i)-mean(imf(:,i))).^2),1));
end
% 求标准差
d=std(r);
[M,I] = max(r);
% 信号的重构
yt=imf(:,I);
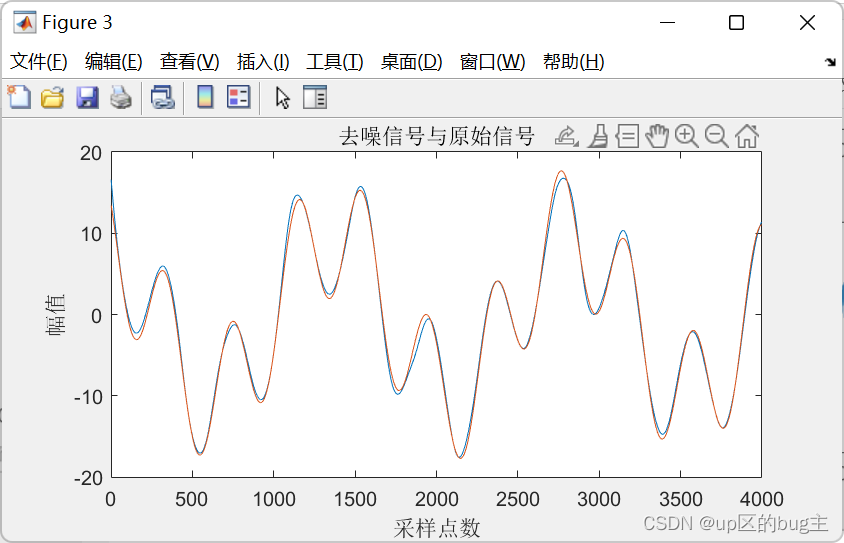
figure(3);
plot(yt);
hold on;
plot(x);
title('去噪信号与原始信号');xlabel('采样点数');ylabel('幅值');
toc;
% figure(1)
% width=400;%宽度,像素数
% height=250;%高度
% left=200;%距屏幕左下角水平距离
% bottem=100;%距屏幕左下角垂直距离
% set(gcf,'position',[left,bottem,width,height])
% plot(i,afz','-*','LineWidth',2)
% %xlim([0 100]);
% xlabel('故障宽度 e-3','FontSize',10.5);ylabel('幅值/(m/s^2)','FontSize',10.5)
% title('峰值');
2.function [spmax, spmin, flag]= extrema(in_data)
代码如下(示例):
% 这是一个用于显著性检验的实用程序.
%
%   function [spmax, spmin, flag]= extrema(in_data)
%
% INPUT:
%       in_data: Inputted data, a time series to be sifted(被筛选);
% OUTPUT:
%       spmax: The locations (col 1) of the maxima and its corresponding
%              values (col 2)
%       spmin: The locations (col 1) of the minima and its corresponding
%              values (col 2)
%
% References can be found in the "Reference" section.
%
% The code is prepared by Zhaohua Wu. For questions, please read the "Q&A" section or
% contact
%   zwu@fsu.edu
%
function [spmax, spmin, flag]= extrema(in_data)flag=1;
dsize=length(in_data);spmax(1,1) = 1;
spmax(1,2) = in_data(1);
jj=2;
kk=2;
while jj<dsizeif ( in_data(jj-1)<=in_data(jj) && in_data(jj)>=in_data(jj+1) )spmax(kk,1) = jj;spmax(kk,2) = in_data (jj);kk = kk+1;endjj=jj+1;
end
spmax(kk,1)=dsize;
spmax(kk,2)=in_data(dsize);if kk>=4slope1=(spmax(2,2)-spmax(3,2))/(spmax(2,1)-spmax(3,1));tmp1=slope1*(spmax(1,1)-spmax(2,1))+spmax(2,2);if tmp1>spmax(1,2)spmax(1,2)=tmp1;endslope2=(spmax(kk-1,2)-spmax(kk-2,2))/(spmax(kk-1,1)-spmax(kk-2,1));tmp2=slope2*(spmax(kk,1)-spmax(kk-1,1))+spmax(kk-1,2);if tmp2>spmax(kk,2)spmax(kk,2)=tmp2;end
elseflag=-1;
endmsize=size(in_data);
dsize=max(msize);
xsize=dsize/3;
xsize2=2*xsize;spmin(1,1) = 1;
spmin(1,2) = in_data(1);
jj=2;
kk=2;
while jj<dsizeif ( in_data(jj-1)>=in_data(jj) && in_data(jj)<=in_data(jj+1))spmin(kk,1) = jj;spmin(kk,2) = in_data (jj);kk = kk+1;endjj=jj+1;
end
spmin(kk,1)=dsize;
spmin(kk,2)=in_data(dsize);if kk>=4slope1=(spmin(2,2)-spmin(3,2))/(spmin(2,1)-spmin(3,1));tmp1=slope1*(spmin(1,1)-spmin(2,1))+spmin(2,2);if tmp1<spmin(1,2)spmin(1,2)=tmp1;endslope2=(spmin(kk-1,2)-spmin(kk-2,2))/(spmin(kk-1,1)-spmin(kk-2,1));tmp2=slope2*(spmin(kk,1)-spmin(kk-1,1))+spmin(kk-1,2);if tmp2<spmin(kk,2)spmin(kk,2)=tmp2;end
elseflag=-1;
endflag=1;
2.functi代码如下(示例):
function allmode=eemd(Y,Nstd,NE)
xsize=length(Y);
dd=1:1:xsize;
Ystd=std(Y);
Y=Y/Ystd;    %part2.evaluate TNM as total IMF number,ssign 0 to N*TNM2 matrix
TNM=fix(log2(xsize))-5;   % TNM=m
TNM2=TNM+2;
for kk=1:1:TNM2for ii=1:1:xsizeallmode(ii,kk)=0.0;  end
end%part3 Do EEMD -----EEMD loop start
for iii=1:1:NE %EEMD loop NE times EMD sum together%part4 --Add noise to original data,we have X1for i=1:xsizetemp=randn(1,1)*Nstd; % add a random noise to YX1(i)=Y(i)+temp;end%part4 --assign original data in the first columnfor jj=1:1:xsizemode(jj,1) = Y(jj); % assign Y to column 1of modeend%part5--give initial 0to xorigin and xendxorigin = X1;   % xend = xorigin; %%part6--start to find an IMF-----IMF loop startnmode = 1;while nmode <= TNMxstart = xend; %last loop value assign to new iteration loop%xstart -loop start dataiter = 1;      %loop index initial value%part7--sift 10 times to get IMF---sift loop startwhile iter<=10 [spmax, spmin, flag]=extrema(xstart); %call function extrema%the usage of spline ,please see part11.upper= spline(spmax(:,1),spmax(:,2),dd); %upper spline bound of this siftlower= spline(spmin(:,1),spmin(:,2),dd); %lower spline bound of this siftmean_ul = (upper + lower)/2;            %spline mean of upper and lowerxstart = xstart - mean_ul;              %extract spline mean from Xstartiter = iter +1;end%part8--subtract IMF from data ,then let the residual xend to start to find next IMFxend = xend - xstart;      nmode=nmode+1;              %part9--after sift 10 times,that xstart is this time IMFfor jj=1:1:xsizemode(jj,nmode) = xstart(jj);  end
end%part10--after gotten all(TNM) IMFs ,the residual xend is over all trend
% put them in the last columnfor jj=1:1:xsizemode(jj,nmode+1)=xend(jj);end%after part 10 ,original + TNM IMFs+overall trend ---those are all in modeallmode=allmode+mode;
end  %part3 Do EEMD -----EEMD loop end%part11--devide EEMD summation by NE,std be multiply back to data
allmode=allmode/NE;
allmode=allmode*Ystd;
结果展示
。