说明:此安装流程只适用于8.0.0以下的版本
1. ElasticSearch 部署
1.1 下载ElasticSearch的wget指令:
wget https://artifacts.elastic.co/downloads/elasticsearch/elasticsearch-7.13.4-linux-x86_64.tar.gz
1.2 解压安装包到指定目录
指定解压缩到 /usr/local 目录下
tar -zxvf elasticsearch-7.13.4-linux-x86_64.tar.gz -C /usr/local
1.3 修改配置文件
(1)elasticsearch.yml
#集群名称
cluster.name: es-application
#节点名称
node.name: node-1
#data文件路径
path.data: /usr/local/elasticsearch-7.13.4/data
#日志文件路径
path.logs: /usr/local/elasticsearch-7.13.4/logs
#ip
network.host: 192.168.126.139
#端口
http.port: 9200
#ssl验证
xpack.security.http.ssl:#设为false,关闭ssl验证,否则访问不到9200页面enabled: false  keystore.path: certs/http.p12
分别创建 path.data、path.logs 对应的 data、logs文件夹。
详细配置:
# ======================== Elasticsearch Configuration =========================## NOTE: Elasticsearch comes with reasonable defaults for most settings.# Before you set out to tweak and tune the configuration, make sure you# understand what are you trying to accomplish and the consequences.## The primary way of configuring a node is via this file. This template lists# the most important settings you may want to configure for a production cluster.## Please consult the documentation for further information on configuration options:# https://www.elastic.co/guide/en/elasticsearch/reference/index.html## ---------------------------------- 集群配置 -----------------------------------# ---------------------------------- Cluster -----------------------------------## Use a descriptive name for your cluster:##cluster.name: my-application## ------------------------------------ 节点 ------------------------------------# ------------------------------------ Node ------------------------------------## 为节点使用描述性名称:# Use a descriptive name for the node:##配置节点名#node.name: n1#node.name: n2#node.name: node-1## 将自定义属性添加到节点# Add custom attributes to the node:##node.attr.rack: r1## ----------------------------------- 路径 ------------------------------------# ----------------------------------- Paths ------------------------------------# 存储数据的目录路径(多个目录用逗号分隔)# Path to directory where to store the data (separate multiple locations by comma):##数据路径#path.data: /path/to/datapath.data: /path/to/data## Path to log files:##日志路径#path.logs: /path/to/logspath.logs: /path/to/logs## ----------------------------------- 内存 -----------------------------------# ----------------------------------- Memory -----------------------------------# 启动时锁定内存# Lock the memory on startup:##bootstrap.memory_lock: true# 确保堆大小设置为可用内存的一半左右,并且允许进程的所有者使用此限制。# Make sure that the heap size is set to about half the memory available# on the system and that the owner of the process is allowed to use this# limit.# 当系统交换内存时,Elasticsearch性能不佳。# Elasticsearch performs poorly when the system is swapping the memory.## ---------------------------------- 网络 -----------------------------------# ---------------------------------- Network -----------------------------------# 默认只能在本机使用,需要配置局域网ip(在内网环境中访问)# By default Elasticsearch is only accessible on localhost. Set a different# address here to expose this node on the network:##IP#network.host: 192.168.0.1network.host: 192.168.0.101## By default Elasticsearch listens for HTTP traffic on the first free port it# finds starting at 9200. Set a specific HTTP port here:##端口#http.port: 9200http.port: 9200# For more information, consult the network module documentation.## --------------------------------- 发现 ----------------------------------# --------------------------------- Discovery ----------------------------------# 在此节点启动时传递要执行查找的主机的初始列表:# 主机的默认列表为[“127.0.0.1”、“[::1]”# Pass an initial list of hosts to perform discovery when this node is started:# The default list of hosts is ["127.0.0.1", "[::1]"]##配置多个主机去发现#discovery.seed_主机:[“主机1”、“主机2”]#discovery.seed_hosts: ["192.168.1.1", "192.168.1.2"]#discovery.seed_hosts: ["host1", "host2"]## Bootstrap the cluster using an initial set of master-eligible nodes:#使用初始节点引导集群#cluster.initial_master_nodes: ["n1", "n2"]#cluster.initial_master_nodes: ["node-1", "node-2"]## For more information, consult the discovery and cluster formation module documentation.## ---------------------------------- 其他 -----------------------------------# ---------------------------------- Various -----------------------------------# 删除索引时需要显式名称# Require explicit names when deleting indices:##action.destructive_requires_name: true(2)limits.conf
vim /etc/security/limits.conf末尾追加以下内容:
* soft nofile 1048576
* hard nofile 1048576
es soft nofile 1048576
es hard nofile 1048576
es soft nproc 4096
es hard nproc 4096
(3)sysctl.conf
在 /etc/sysctl.conf 末尾追加:
kernel.printk=5
vm.max_map_count=655360
(4)使配置生效
执行以下命令,使 /etc/ 目录修改的配置生效:
sysctl -p1.4 创建新用户
# 创建用户
useradd es
# 设置密码
passwd es
# 赋予用户权限
chown -R es:es/usr/server/elasticsearch-8.5.2
1.5 启动elasticsearch
# 切换用户
su es
# 启动 -d表示后台启动
./bin/elasticsearch -d
1.6 访问
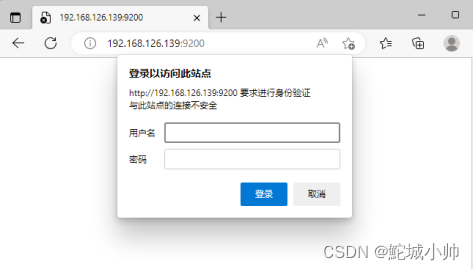
说明:8.0.0版本以下没有开启登录验证。
2. 安装 Kibana(es用户启动)
2.1 下载并安装Kibana:
(1)wget下载kibana
wget https://artifacts.elastic.co/downloads/kibana/kibana-8.5.2-linux-x86_64.tar.gz
(2)解压到安装目录
tar -zxvf kibana-8.5.2-linux-x86_64.tar.gz -C /usr/local/
2.2 创建用户并给文件加授权
(1)创建用户
useradd kibana
passwd kibana
(2)加授权
chown kibana /usr/local/kibana-8.5.2/ -R
说明:如果使用es用户来加权,当es用户启动时,相关的端口可能被占用,并导致5601端口无法释放被kibana使用。(elasticsearch和kibana使用不同的用户来授权)
2.3 修改配置文件
修改 config下的 kibana.yml
server.port: 5601server.host: "0.0.0.0"elasticsearch.hosts: ["http://0.0.0.0:9200"]i18n.locale: "zh-CN"详细配置
# 提供服务的端口# Kibana is served by a back end server. This setting specifies the port to use.#server.port: 5601# 提供服务的IP# Specifies the address to which the Kibana server will bind. IP addresses and host names are both valid values.# The default is 'localhost', which usually means remote machines will not be able to connect.# To allow connections from remote users, set this parameter to a non-loopback address.#server.host: "localhost"# 配置代理路径# Enables you to specify a path to mount Kibana at if you are running behind a proxy.# Use the `server.rewriteBasePath` setting to tell Kibana if it should remove the basePath# from requests it receives, and to prevent a deprecation warning at startup.# This setting cannot end in a slash.#server.basePath: ""# 指定Kibana是否应重写前缀为的请求,或要求它们由反向代理重写# Specifies whether Kibana should rewrite requests that are prefixed with# `server.basePath` or require that they are rewritten by your reverse proxy.# This setting was effectively always `false` before Kibana 6.3 and will# default to `true` starting in Kibana 7.0.#server.rewriteBasePath: false# 指定最终用户可以使用Kibana的公共URL。如果# 已配置“server.basePath”。此URL应以相同的basePath结尾。# Specifies the public URL at which Kibana is available for end users. If# `server.basePath` is configured this URL should end with the same basePath.#server.publicBaseUrl: ""# 传入服务器请求的最大负载大小(以字节为单位)。# The maximum payload size in bytes for incoming server requests.#server.maxPayload: 1048576# es服务的地址# The URLs of the Elasticsearch instances to use for all your queries.#elasticsearch.hosts: ["http://localhost:9200"]# Kibana在Elasticsearch中使用索引来存储保存的搜索、可视化和仪表盘。如果索引不存在,Kibana将创建一个新索引。# Kibana uses an index in Elasticsearch to store saved searches, visualizations and# dashboards. Kibana creates a new index if the index doesn't already exist.#kibana.index: ".kibana"# 加载默认应用# The default application to load.#kibana.defaultAppId: "home"# 如果es设置了账号和密码,在下面配置# If your Elasticsearch is protected with basic authentication, these settings provide# the username and password that the Kibana server uses to perform maintenance on the Kibana# index at startup. Your Kibana users still need to authenticate with Elasticsearch, which# is proxied through the Kibana server.# 账号#elasticsearch.username: "kibana_system"# 密码#elasticsearch.password: "pass"# 配置ssl证书和ssl密钥# Enables SSL and paths to the PEM-format SSL certificate and SSL key files, respectively.# These settings enable SSL for outgoing requests from the Kibana server to the browser.#server.ssl.enabled: false#server.ssl.certificate: /path/to/your/server.crt#server.ssl.key: /path/to/your/server.key# 这些文件用于向Elasticsearch验证Kibana的身份,并且在以下情况下是必需的# Optional settings that provide the paths to the PEM-format SSL certificate and key files.# These files are used to verify the identity of Kibana to Elasticsearch and are required when# xpack.security.http.ssl.client_authentication in Elasticsearch is set to required.#elasticsearch.ssl.certificate: /path/to/your/client.crt#elasticsearch.ssl.key: /path/to/your/client.key# 可选设置,允许您为证书指定PEM文件的路径# Optional setting that enables you to specify a path to the PEM file for the certificate# authority for your Elasticsearch instance.#elasticsearch.ssl.certificateAuthorities: [ "/path/to/your/CA.pem" ]#若要忽略SSL证书的有效性,请将此设置的值更改为“无”。# To disregard the validity of SSL certificates, change this setting's value to 'none'.#elasticsearch.ssl.verificationMode: full#等待Elasticsearch响应ping的时间(毫秒)。默认为的值# Time in milliseconds to wait for Elasticsearch to respond to pings. Defaults to the value of# the elasticsearch.requestTimeout setting.#elasticsearch.pingTimeout: 1500#等待后端或Elasticsearch响应的时间(毫秒)。此值#必须是正整数。# Time in milliseconds to wait for responses from the back end or Elasticsearch. This value# must be a positive integer.#elasticsearch.requestTimeout: 30000#要发送到Elasticsearch的Kibana客户端头列表。发送*否*客户端#标题,将此值设置为[](空列表)。# List of Kibana client-side headers to send to Elasticsearch. To send *no* client-side# headers, set this value to [] (an empty list).#elasticsearch.requestHeadersWhitelist: [ authorization ]#发送到Elasticsearch的标题名称和值。无法覆盖任何自定义标题#通过客户端头,而不考虑elasticsearch.requestHeadersWhitelist配置。# Header names and values that are sent to Elasticsearch. Any custom headers cannot be overwritten# by client-side headers, regardless of the elasticsearch.requestHeadersWhitelist configuration.#elasticsearch.customHeaders: {}#Elasticsearch等待碎片响应的时间(毫秒)。设置为0以禁用。#elasticsearch.shardTimeout:30000# Time in milliseconds for Elasticsearch to wait for responses from shards. Set to 0 to disable.#elasticsearch.shardTimeout: 30000#记录发送到Elasticsearch的查询。需要将logging.verbose设置为true# Logs queries sent to Elasticsearch. Requires logging.verbose set to true.#elasticsearch.logQueries: false#指定Kibana创建进程ID文件的路径# Specifies the path where Kibana creates the process ID file.#pid.file: /run/kibana/kibana.pid#允许您指定Kibana存储日志输出的文件# Enables you to specify a file where Kibana stores log output.#logging.dest: stdout#将此设置的值设置为true以抑制所有日志记录输出。# Set the value of this setting to true to suppress all logging output.#logging.silent: false#将此设置的值设置为true以抑制除错误消息以外的所有日志输出。# Set the value of this setting to true to suppress all logging output other than error messages.#logging.quiet: false#将此设置的值设置为true以记录所有事件,包括系统使用信息以及所有的请求。# Set the value of this setting to true to log all events, including system usage information# and all requests.#logging.verbose: false#设置采样系统和进程性能的间隔(以毫秒为单位)# Set the interval in milliseconds to sample system and process performance# metrics. Minimum is 100ms. Defaults to 5000.#ops.interval: 5000#指定用于所有可本地化字符串、日期和数字格式的区域设置。#支持的语言如下:英语-en,默认情况下为中文-zh-CN。# Specifies locale to be used for all localizable strings, dates and number formats.# Supported languages are the following: English - en , by default , Chinese - zh-CN .#i18n.locale: "en"2.4 切换用户,启动服务
nohup ./bin/kibana &
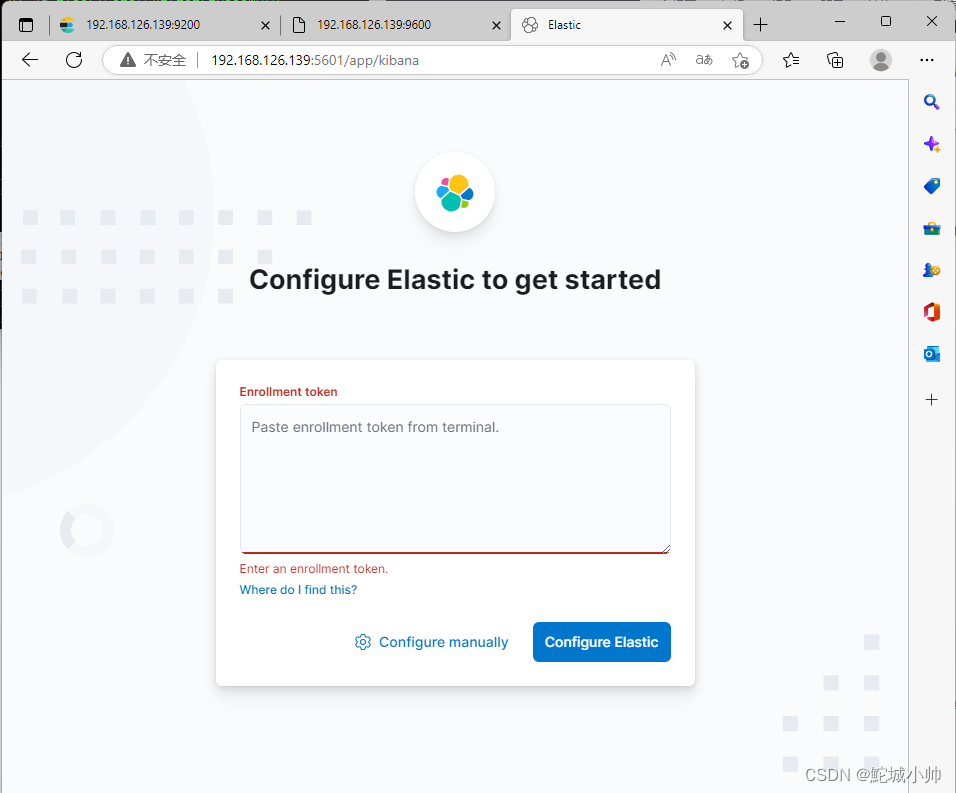
2.5 测试
浏览器输入 ip:5601
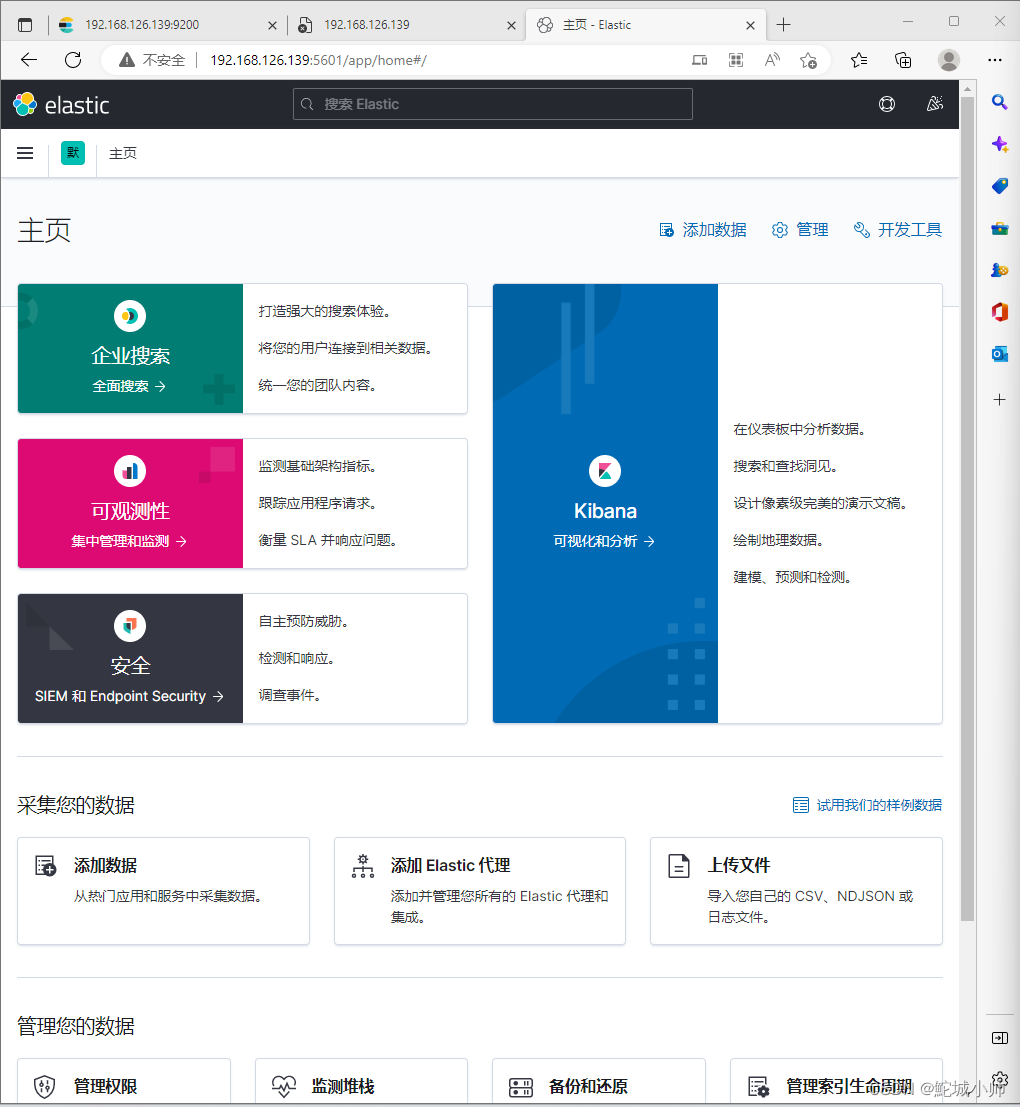
说明:8.x.x 版本需要获取token,进行登录验证
3. 安装 logstash
3.1 下载 logstash
wget https://artifacts.elastic.co/downloads/logstash/logstash-8.5.2-linux-x86_64.tar.gz
3.2 解压到安装目录
tar -zxvf logstash-8.5.2-linux-x86_64.tar.gz -C /usr/local/3.4 修改配置
(1)修改 config/logstash-sample.conf
input {tcp{mode => "server"host => "0.0.0.0"type => "elk1"port => 9601codec => json}tcp{mode => "server"host => "0.0.0.0"type => "elk2"port => 9602codec => json}}output {if [type]=="elk1" {elasticsearch {action => "index"hosts => "**.**.**.**:9200"index => "elk1"codec =>"json"} }if [type]=="elk2" {elasticsearch {action => "index"hosts => "**.**.**.**:9200"index => "elk2"codec =>"json"}}}(2)修改 config/logstash.yml
api.http.host: 192.168.126.139
api.http.port: 9600-9700pipeline.workers: 1
pipeline.batch.size: 1
(3)修改 config/pipelines.yml
- pipeline.id: testpipeline.workers: 1pipeline.batch.size: 1config.string: "input { generator {} } filter { sleep { time => 1 } } output { stdout { codec => dots } }"- pipeline.id: another_testqueue.type: persistedpath.config: "/tmp/logstash/*.config"
(4)详细配置
#可以使用分层形式进行设置
# Settings file in YAML
#
# Settings can be specified either in hierarchical form, e.g.:#通道
#   pipeline:#批次
#     batch:#大小
#       size: 125#延时
#       delay: 5
#
# Or as flat keys:
#   #一行一行的配置属性值
#   pipeline.batch.size: 125
#   pipeline.batch.delay: 5
## ------------  节点标识 ------------
# ------------  Node identity ------------
#
# Use a descriptive name for the node:
# 节点名称
# node.name: test
# 如果省略,节点名称将默认为计算机的主机名
# If omitted the node name will default to the machine's host name
#
# ------------ 数据路径 ------------------
# ------------ Data path ------------------
#
#logstash及其插件应该使用哪个目录对于任何持续的需求。默认为LOGSTASH_HOME/data
# Which directory should be used by logstash and its plugins
# for any persistent needs. Defaults to LOGSTASH_HOME/data
#
# path.data:
#
# ------------ 管道设置 --------------
# ------------ Pipeline Settings --------------
# 管道的ID。
# The ID of the pipeline.# 管道id:main
# pipeline.id: main# 设置并行执行过滤器+输出的工作人员数量 管道阶段。
# Set the number of workers that will, in parallel, execute the filters+outputs
# stage of the pipeline.# 这默认为主机的CPU核心数。
# This defaults to the number of the host's CPU cores.# 管道工人:2名
# pipeline.workers: 2# 在发送到筛选器+工作者之前,要从输入中检索多少事件
# How many events to retrieve from inputs before sending to filters+workers# 管道.批次.尺寸:125
# pipeline.batch.size: 125# 轮询下一个事件时等待的时间(毫秒)
# How long to wait in milliseconds while polling for the next event# 在将较小的批次分配到过滤器+输出之前
# before dispatching an undersized batch to filters+outputs# 管道.批次.延迟:50
# pipeline.batch.delay: 50# 在停机期间强制Logstash退出记忆中的事件
# 默认情况下,logstash将拒绝退出,直到所有已将接收到的事件推送到输出。
# Force Logstash to exit during shutdown even if there are still inflight
# events in memory. By default, logstash will refuse to quit until all
# received events have been pushed to the outputs.# 警告:启用此选项可能会导致关机期间数据丢失
# WARNING: enabling this can lead to data loss during shutdown
# pipeline.unsafe_shutdown: false# 设置管道事件顺序。选项有“自动”(默认)、“真”或“假”。
# Set the pipeline event ordering. Options are "auto" (the default), "true" or "false".
# "auto" will  automatically enable ordering if the 'pipeline.workers' setting
# is also set to '1'.
# "true" will enforce ordering on the pipeline and prevent logstash from starting
# if there are multiple workers.
# "false" will disable any extra processing necessary for preserving ordering.
#
pipeline.ordered: auto
#
# ------------ Pipeline Configuration Settings --------------
# ------------ 管道配置设置 --------------
#
# Where to fetch the pipeline configuration for the main pipeline
# 从何处获取主管道的管道配置
# path.config:
# 主管道的管道配置字符串
# Pipeline configuration string for the main pipeline
#
# config.string:
# 启动时,测试配置是否有效并退出(干运行)
# At startup, test if the configuration is valid and exit (dry run)
#
# config.test_and_exit: false# 定期检查配置是否已更改并重新加载管道这也可以通过SIGHUP信号手动触发
# Periodically check if the configuration has changed and reload the pipeline
# This can also be triggered manually through the SIGHUP signal
#
# config.reload.automatic: false
#
# 不建议以这种方式设置间隔,在以后的版本中可能会更改
# How often to check if the pipeline configuration has changed (in seconds)
# Note that the unit value (s) is required. Values without a qualifier (e.g. 60)
# are treated as nanoseconds.
# Setting the interval this way is not recommended and might change in later versions.
#
# config.reload.interval: 3s# 将完全编译的配置显示为调试日志消息
# Show fully compiled configuration as debug log message
# NOTE: --log.level must be 'debug'
# 注意:--log.level必须为“调试”
# 是否启动debugger模式
# config.debug: false
#
# 启用时,处理中字符串中的转义字符,如\n和\“
# When enabled, process escaped characters such as \n and \" in strings in the
# pipeline configuration files.
#
# config.support_escapes: false
#
# ------------HTTP API设置 -------------
# ------------ HTTP API Settings -------------
# Define settings related to the HTTP API here.
#
# 默认情况下启用HTTP API。它可以被禁用,但功能依赖于它不会按预期工作。
# The HTTP API is enabled by default. It can be disabled, but features that rely
# on it will not work as intended.
# http.enabled: true
# 默认情况下,HTTP API仅绑定到主机的本地环回接口,确保网络的其余部分无法访问它。因为API
# 既不包括身份验证,也不包括授权,并且尚未加固或删除测试用作可公开访问的API,绑定到可公开访问的IP应尽可能避免。
# By default, the HTTP API is bound to only the host's local loopback interface,
# ensuring that it is not accessible to the rest of the network. Because the API
# includes neither authentication nor authorization and has not been hardened or
# tested for use as a publicly-reachable API, binding to publicly accessible IPs
# should be avoided where possible.
# IP
# http.host: 127.0.0.1
#
# The HTTP API web server will listen on an available port from the given range.
# Values can be specified as a single port (e.g., `9600`), or an inclusive range
# of ports (e.g., `9600-9700`).
# 端口
# http.port: 9600-9700
#
# ------------ 模块设置 ---------------
# ------------ Module Settings ---------------
#在这里定义模块。模块定义必须定义为数组。
#查看这一点的简单方法是在每个'name'前面加上一个'-',并保留
#与之关联的`name`下的所有关联变量,以及
#在下一个上面,像这样:
# Define modules here.  Modules definitions must be defined as an array.
# The simple way to see this is to prepend each `name` with a `-`, and keep
# all associated variables under the `name` they are associated with, and
# above the next, like this:
#
# modules:
#   - name: MODULE_NAME
#     var.PLUGINTYPE1.PLUGINNAME1.KEY1: VALUE
#     var.PLUGINTYPE1.PLUGINNAME1.KEY2: VALUE
#     var.PLUGINTYPE2.PLUGINNAME1.KEY1: VALUE
#     var.PLUGINTYPE3.PLUGINNAME3.KEY1: VALUE
#
# Module variable names must be in the format of
#
# var.PLUGIN_TYPE.PLUGIN_NAME.KEY
#
# modules:
#
# ------------ 云设置 ---------------
# ------------ Cloud Settings ---------------
# Define Elastic Cloud settings here.
# cloud.id的格式为base64值,例如dXMtZWFzdC0xLmF3cy5mb3VuZC5pbyRub3RhcmVhbCRpZGVudGlmaWVy
# Format of cloud.id is a base64 value e.g. dXMtZWFzdC0xLmF3cy5mb3VuZC5pbyRub3RhcmVhbCRpZGVudGlmaWVy
# and it may have an label prefix e.g. staging:dXMtZ...
# 它可能有一个标签前缀,例如staging:dXMtZ。。。
# This will overwrite 'var.elasticsearch.hosts' and 'var.kibana.host'
# cloud.id: <identifier>
#
# Format of cloud.auth is: <user>:<pass>
# This is optional
# 如果提供,这将覆盖“var.elasticsearch.username”和“var.elasticsearch.password”
# If supplied this will overwrite 'var.elasticsearch.username' and 'var.elasticsearch.password'
# If supplied this will overwrite 'var.kibana.username' and 'var.kibana.password'
# cloud.auth: elastic:<password>
#
# ------------ 队列设置 --------------
# ------------ Queuing Settings --------------
# 可以配置在硬盘或者内存中执行,默认为内存
# Internal queuing model, "memory" for legacy in-memory based queuing and
# "persisted" for disk-based acked queueing. Defaults is memory
#
# queue.type: memory
#
# 如果类型(queue.type)使用硬盘,此路径(path.queue:)则为数据文件的目录
# If using queue.type: persisted, the directory path where the data files will be stored.
# Default is path.data/queue
#
# path.queue:
#
# If using queue.type: persisted, the page data files size. The queue data consists of
# append-only data files separated into pages. Default is 64mb
# 仅追加分隔为页面的数据文件。默认值为64mb
# queue.page_capacity: 64mb
# 如果使用queue.type:persistend,则为队列中未读事件的最大数量。
# If using queue.type: persisted, the maximum number of unread events in the queue.
# Default is 0 (unlimited)
#
# queue.max_events: 0
#
#
# If using queue.type: persisted, the total capacity of the queue in number of bytes.
# If you would like more unacked events to be buffered in Logstash, you can increase the
# capacity using this setting. Please make sure your disk drive has capacity greater than
# the size specified here. If both max_bytes and max_events are specified, Logstash will pick
# whichever criteria is reached first
# Default is 1024mb or 1gb
# 队列容量
# queue.max_bytes: 1024mb
#
# If using queue.type: persisted, the maximum number of acked events before forcing a checkpoint
# Default is 1024, 0 for unlimited
# 强制检查点之前已确认的最大事件数
# queue.checkpoint.acks: 1024
#
# If using queue.type: persisted, the maximum number of written events before forcing a checkpoint
# Default is 1024, 0 for unlimited
# 则为强制检查点之前写入的最大事件数 默认值为1024,0表示无限制
# queue.checkpoint.writes: 1024
#
# If using queue.type: persisted, the interval in milliseconds when a checkpoint is forced on the head page
# Default is 1000, 0 for no periodic checkpoint.
# 如果使用queue.type:persisted,则在头页上强制设置检查点的间隔(以毫秒为单位)默认值为1000,0表示无定期检查点。
# queue.checkpoint.interval: 1000
#
# ------------ 死信队列设置 --------------
# ------------ Dead-Letter Queue Settings --------------
# Flag to turn on dead-letter queue.
# 死信队列。启用:false
# dead_letter_queue.enable: false
# 如果使用死信队列。enable:true,每个死信队列的最大大小。条目
# If using dead_letter_queue.enable: true, the maximum size of each dead letter queue. Entries
# 如果将死信队列的大小增加到超出此设置,则将删除
# will be dropped if they would increase the size of the dead letter queue beyond this setting.
# #默认值为1024mb
# Default is 1024mb
# 死信队列。最大字节数:1024mb
# dead_letter_queue.max_bytes: 1024mb
# 如果使用dead_letter_queue.enable:true,如果没有符合DLQ条件的其他事件,则间隔(以毫秒为单位)
# 创建后,将写入死信队列文件。这里的值越低,意味着队列文件越多、越小
# 可以写入,而较大的值将在“写入”死信队列的项目之间引入更多延迟,并且
# 当项目不经常写入时,死信队列输入可以读取。
# 默认值为5000。
# If using dead_letter_queue.enable: true, the interval in milliseconds where if no further events eligible for the DLQ
# have been created, a dead letter queue file will be written. A low value here will mean that more, smaller, queue files
# may be written, while a larger value will introduce more latency between items being "written" to the dead letter queue, and
# being available to be read by the dead_letter_queue input when items are are written infrequently.
# Default is 5000.
# 死信队列。刷新间隔:5000
# dead_letter_queue.flush_interval: 5000
# 如果使用dead_letter_queue.enable:true,则为存储数据文件的目录路径。
# If using dead_letter_queue.enable: true, the directory path where the data files will be stored.
# Default is path.data/dead_letter_queue
#
# path.dead_letter_queue:
#
# ------------- 指标设置 --------------
# ------------ Metrics Settings --------------
#
# Bind address for the metrics REST endpoint
# IP
# http.host: "127.0.0.1"
#
# Bind port for the metrics REST endpoint, this option also accept a range
# (9600-9700) and logstash will pick up the first available ports.
# 端口
# http.port: 9600-9700
#
# ------------ 调试设置 --------------
# ------------ Debugging Settings --------------
# 启动模式
# Options for log.level:
#   * fatal
#   * error
#   * warn
#   * info (default)
#   * debug
#   * trace
# 日志级别
# log.level: info
# path.logs:
#
# ------------ 其他设置 --------------
# ------------ Other Settings --------------
# 在哪里可以找到自定义插件
# Where to find custom plugins
# path.plugins: []
#
# 在单独的日志文件中输出每个管道的日志行的标志。每个日志文件名都包含pipeline.name默认值为false
# Flag to output log lines of each pipeline in its separate log file. Each log filename contains the pipeline.name
# Default is false
# pipeline.separate_logs: false
#
# X-Pack设置(不适用于OSS构建)
# ------------ X-Pack Settings (not applicable for OSS build)--------------
# X-Pack监控
# X-Pack Monitoring
# https://www.elastic.co/guide/en/logstash/current/monitoring-logstash.html
#xpack.monitoring.enabled: false
#xpack.monitoring.elasticsearch.username: logstash_system
#xpack.monitoring.elasticsearch.password: password
#xpack.monitoring.elasticsearch.proxy: ["http://proxy:port"]
#xpack.monitoring.elasticsearch.hosts: ["https://es1:9200", "https://es2:9200"]
# 主机+用户名/密码设置的替代方法是使用
# an alternative to hosts + username/password settings is to use cloud_id/cloud_auth
#xpack.monitoring.elasticsearch.cloud_id: monitoring_cluster_id:xxxxxxxxxx
#xpack.monitoring.elasticsearch.cloud_auth: logstash_system:password
# 另一种身份验证方法是使用Elasticsearch API密钥
# another authentication alternative is to use an Elasticsearch API key
#xpack.monitoring.elasticsearch.api_key: "id:api_key"
#xpack.monitoring.elasticsearch.ssl.certificate_authority: [ "/path/to/ca.crt" ]
#xpack.monitoring.elasticsearch.ssl.truststore.path: path/to/file
#xpack.monitoring.elasticsearch.ssl.truststore.password: password
#xpack.monitoring.elasticsearch.ssl.keystore.path: /path/to/file
#xpack.monitoring.elasticsearch.ssl.keystore.password: password
#xpack.monitoring.elasticsearch.ssl.verification_mode: certificate
#xpack.monitoring.elasticsearch.sniffing: false
#xpack.monitoring.collection.interval: 10s
#xpack.monitoring.collection.pipeline.details.enabled: true
# X-Pack管理
# X-Pack Management
# https://www.elastic.co/guide/en/logstash/current/logstash-centralized-pipeline-management.html
#xpack.management.enabled: false
#xpack.management.pipeline.id: ["main", "apache_logs"]
#xpack.management.elasticsearch.username: logstash_admin_user
#xpack.management.elasticsearch.password: password
#xpack.management.elasticsearch.proxy: ["http://proxy:port"]
#xpack.management.elasticsearch.hosts: ["https://es1:9200", "https://es2:9200"]
# 主机+用户名/密码设置的替代方法是使用
# an alternative to hosts + username/password settings is to use cloud_id/cloud_auth
#xpack.management.elasticsearch.cloud_id: management_cluster_id:xxxxxxxxxx
#xpack.management.elasticsearch.cloud_auth: logstash_admin_user:password
# 另一种身份验证方法是使用Elasticsearch API密钥
# another authentication alternative is to use an Elasticsearch API key
#xpack.management.elasticsearch.api_key: "id:api_key"
#xpack.management.elasticsearch.ssl.certificate_authority: [ "/path/to/ca.crt" ]
#xpack.management.elasticsearch.ssl.truststore.path: /path/to/file
#xpack.management.elasticsearch.ssl.truststore.password: password
#xpack.management.elasticsearch.ssl.keystore.path: /path/to/file
#xpack.management.elasticsearch.ssl.keystore.password: password
#xpack.management.elasticsearch.ssl.verification_mode: certificate
#xpack.management.elasticsearch.sniffing: false
#xpack.management.logstash.poll_interval: 5s
3.5 启动
后台启动命令:
./bin/logstash -d 如果启动后,报以下错误提示:
Logstash - java.lang.IllegalStateException: Logstash stopped processing because of an err使用 -e 进行启动
./bin/logstash -e ""
#或
./logstash -e "input { stdin {} }  output {stdout {} }"
3.6 测试成功
[root@linkhot04 bin]# ./logstash -e ""
Using bundled JDK: /usr/local/logstash-8.5.2/jdk
Sending Logstash logs to /usr/local/logstash-8.5.2/logs which is now configured via log4j2.properties
[2022-12-13T11:22:29,450][INFO ][logstash.runner          ] Log4j configuration path used is: /usr/local/logstash-8.5.2/config/log4j2.properties
[2022-12-13T11:22:29,459][INFO ][logstash.runner          ] Starting Logstash {"logstash.version"=>"8.5.2", "jruby.version"=>"jruby 9.3.8.0 (2.6.8) 2022-09-13 98d69c9461 OpenJDK 64-Bit Server VM 17.0.5+8 on 17.0.5+8 +indy +jit [x86_64-linux]"}
[2022-12-13T11:22:29,463][INFO ][logstash.runner          ] JVM bootstrap flags: [-Xms1g, -Xmx1g, -Djava.awt.headless=true, -Dfile.encoding=UTF-8, -Djruby.compile.invokedynamic=true, -Djruby.jit.threshold=0, -XX:+HeapDumpOnOutOfMemoryError, -Djava.security.egd=file:/dev/urandom, -Dlog4j2.isThreadContextMapInheritable=true, -Djruby.regexp.interruptible=true, -Djdk.io.File.enableADS=true, --add-exports=jdk.compiler/com.sun.tools.javac.api=ALL-UNNAMED, --add-exports=jdk.compiler/com.sun.tools.javac.file=ALL-UNNAMED, --add-exports=jdk.compiler/com.sun.tools.javac.parser=ALL-UNNAMED, --add-exports=jdk.compiler/com.sun.tools.javac.tree=ALL-UNNAMED, --add-exports=jdk.compiler/com.sun.tools.javac.util=ALL-UNNAMED, --add-opens=java.base/java.security=ALL-UNNAMED, --add-opens=java.base/java.io=ALL-UNNAMED, --add-opens=java.base/java.nio.channels=ALL-UNNAMED, --add-opens=java.base/sun.nio.ch=ALL-UNNAMED, --add-opens=java.management/sun.management=ALL-UNNAMED]
[2022-12-13T11:22:30,109][WARN ][logstash.config.source.multilocal] Ignoring the 'pipelines.yml' file because modules or command line options are specified
[2022-12-13T11:22:35,472][INFO ][logstash.agent           ] Successfully started Logstash API endpoint {:port=>9600, :ssl_enabled=>false}
[2022-12-13T11:22:36,319][INFO ][org.reflections.Reflections] Reflections took 295 ms to scan 1 urls, producing 125 keys and 438 values
[2022-12-13T11:22:37,889][INFO ][logstash.javapipeline    ] Pipeline `main` is configured with `pipeline.ecs_compatibility: v8` setting. All plugins in this pipeline will default to `ecs_compatibility => v8` unless explicitly configured otherwise.
[2022-12-13T11:22:39,545][WARN ][logstash.javapipeline    ][main] 'pipeline.ordered' is enabled and is likely less efficient, consider disabling if preserving event order is not necessary
[2022-12-13T11:22:39,934][INFO ][logstash.javapipeline    ][main] Starting pipeline {:pipeline_id=>"main", "pipeline.workers"=>1, "pipeline.batch.size"=>1, "pipeline.batch.delay"=>50, "pipeline.max_inflight"=>1, "pipeline.sources"=>["config string"], :thread=>"#<Thread:0x27e1005e run>"}
[2022-12-13T11:22:41,459][INFO ][logstash.javapipeline    ][main] Pipeline Java execution initialization time {"seconds"=>1.5}
[2022-12-13T11:22:41,855][INFO ][logstash.javapipeline    ][main] Pipeline started {"pipeline.id"=>"main"}
The stdin plugin is now waiting for input:
[2022-12-13T11:22:41,990][INFO ][logstash.agent           ] Pipelines running {:count=>1, :running_pipelines=>[:main], :non_running_pipelines=>[]}
#输入以下内容进行测试
hello world
{"@version" => "1","message" => "hello world","@timestamp" => 2022-12-13T03:23:13.417075053Z,"event" => {"original" => "hello world"},"type" => "stdin","host" => {"hostname" => "linkhot04"}
}
3.7 从配置文件启动
(1)配置 新建 logstash.conf
cd logstash-7.13.4/configvi logstash.conf输入内容如下:
input{ tcp {	 mode => "server"		 host => "0.0.0.0" #我这里是本地		 port => 9061 #开放这个端口进行采集		 codec => json_lines # 编解码器 有的版本需要独自安装	 }
}output{elasticsearch{ #es地址	 hosts=>["127.0.0.1:9200"]	 # 在es里产生的index的名称	 index => "springboot-study-%{+YYYY.MM.dd}"	 }	 stdout{codec => rubydebug}
}
说明:input表示输入日志的服务,output是同步到es的服务地址
(2)创建启动脚本
cd /home/es/elk/logstash-7.13.4/binvi start-logstash.sh输入如下内容:
./logstash -f ../config/logstash.conf保存 : wq!
赋权 chmod u+x start-logstash.sh
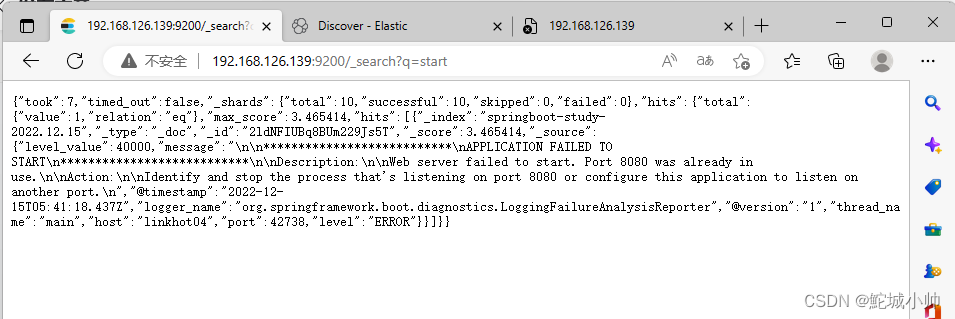
3.8 验证是否推送到ElasticSearch
访问:
192.168.126.139:9200/_search?q=start
3.9 kibana 查看应用日志
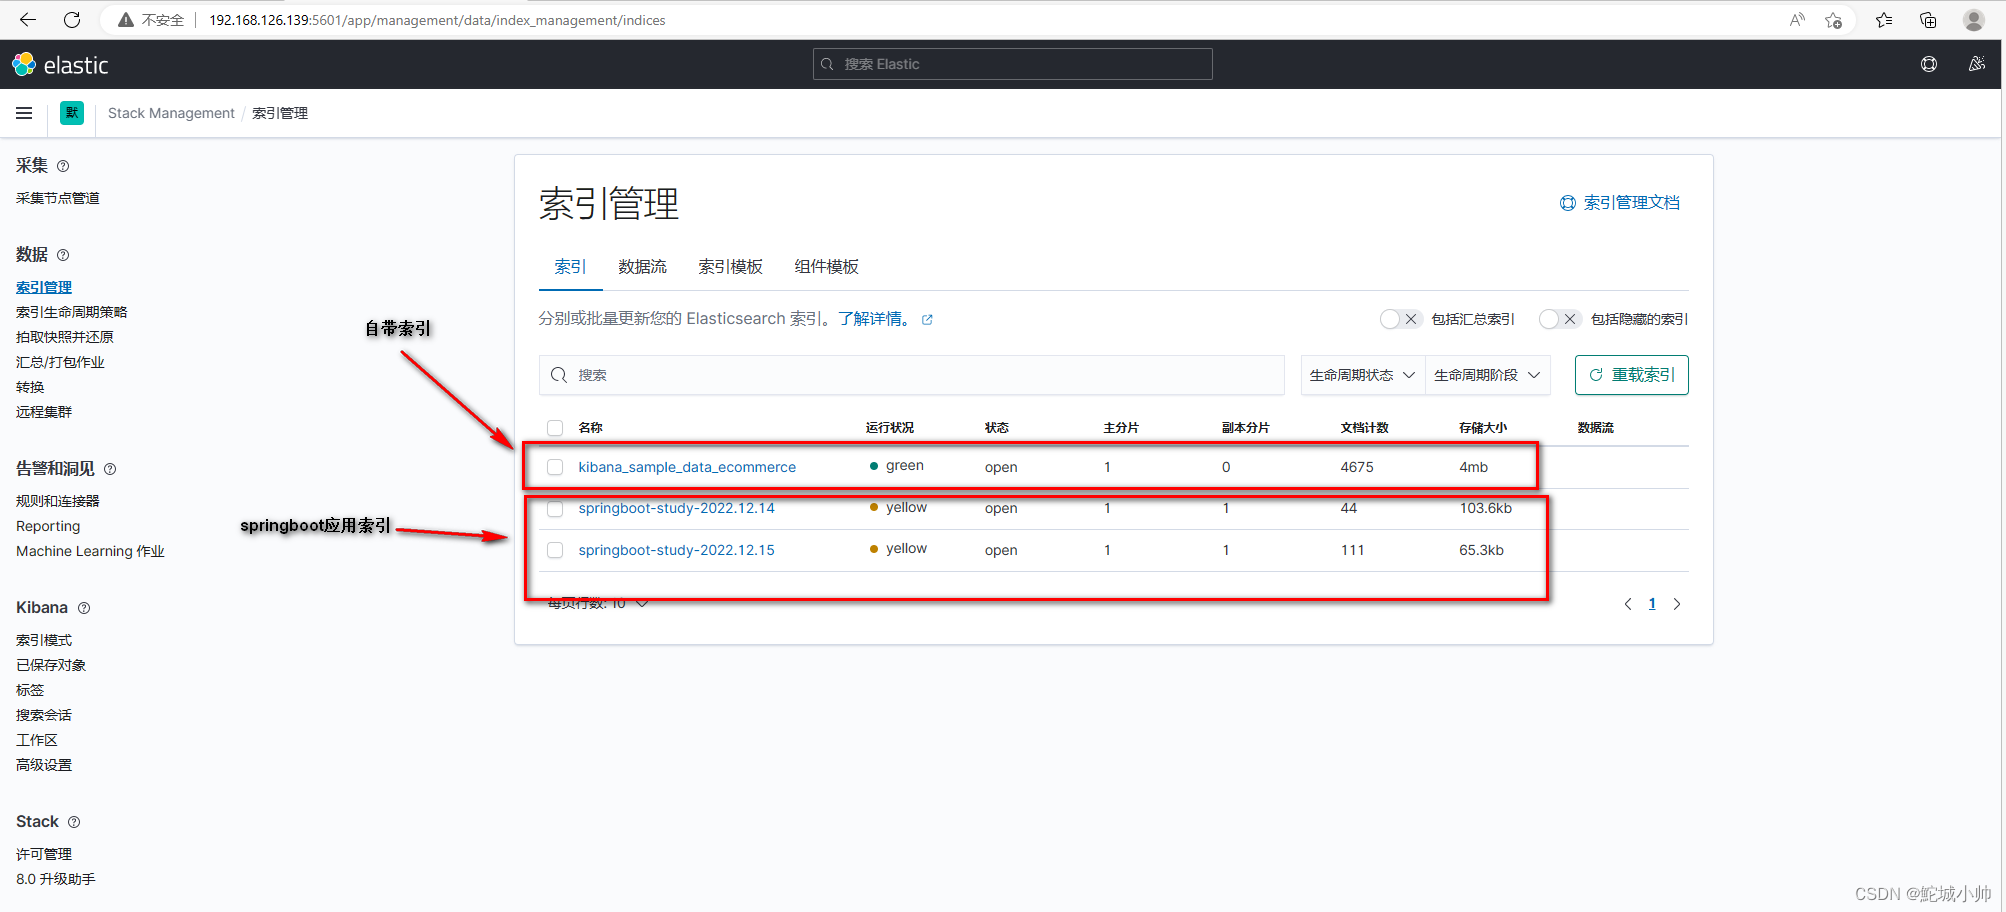
(1)索引查看
(2)索引模式介绍
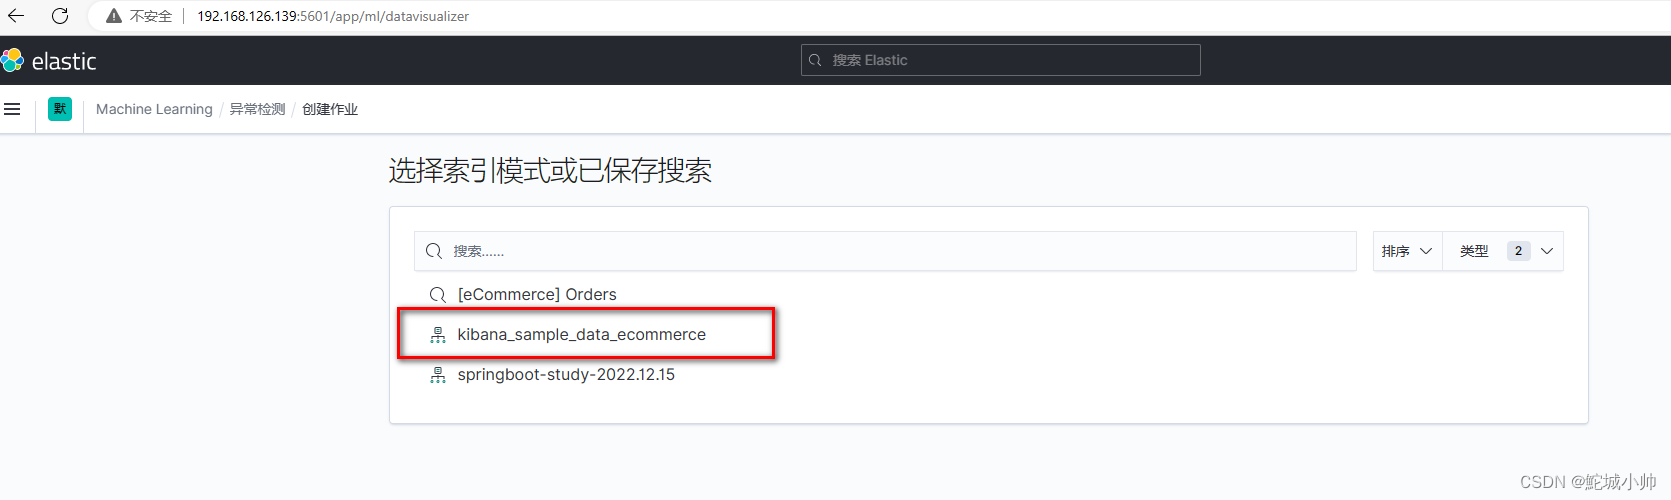
此页面默认只有kibana_sample_data_ecommerce这一索引,这是kibana自带的。而我们也收到了springboot应用推送的 logs,但如果想要对logs进行查看、过滤、筛选,还需要为它创建索引模式,然后再通过设定的字段进行过滤。
(3)创建索引模式
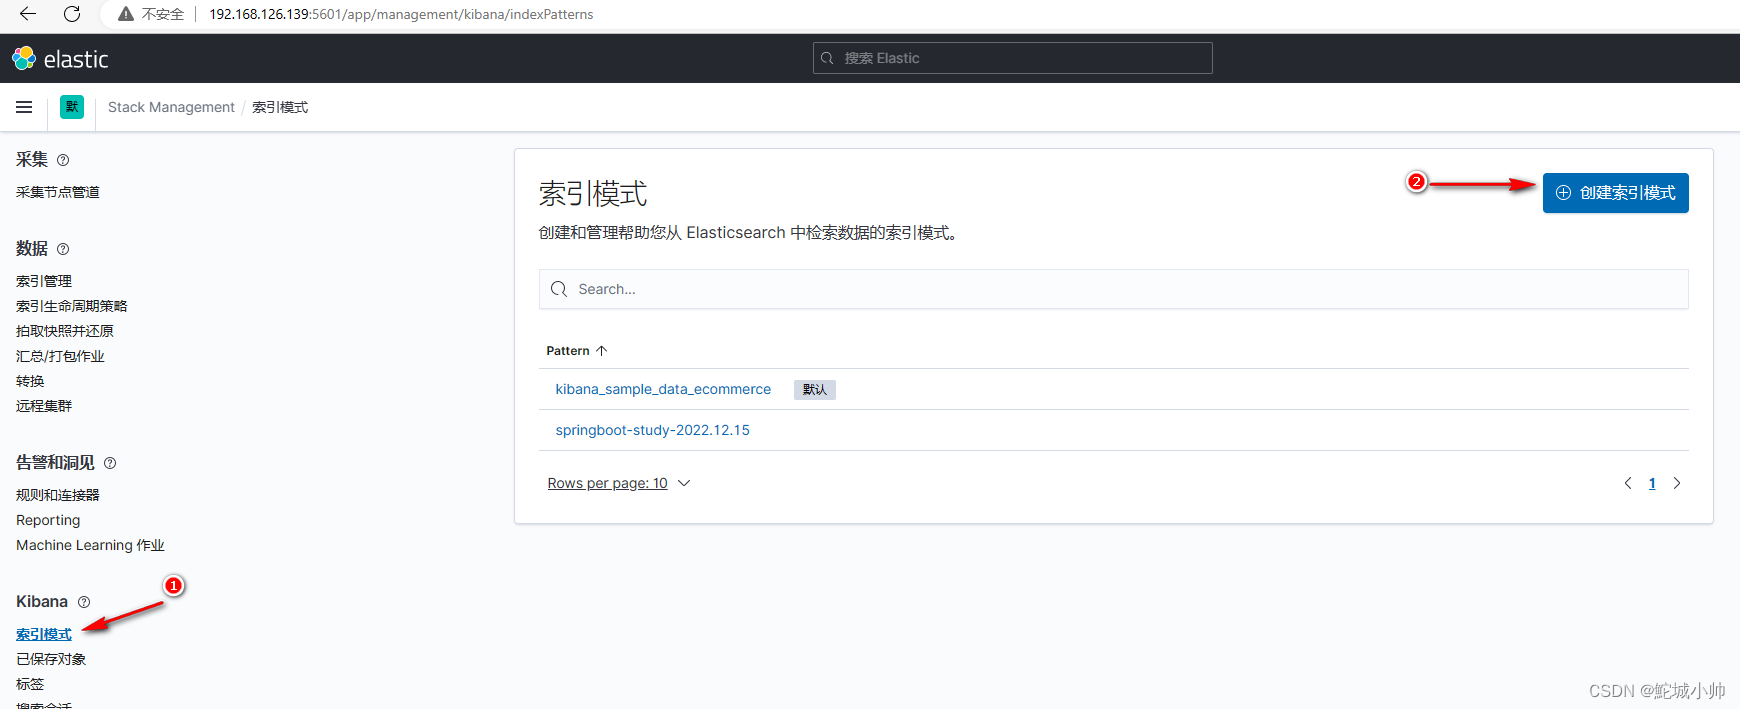
点击“索引模式” -> 点击”创建索引模式“。
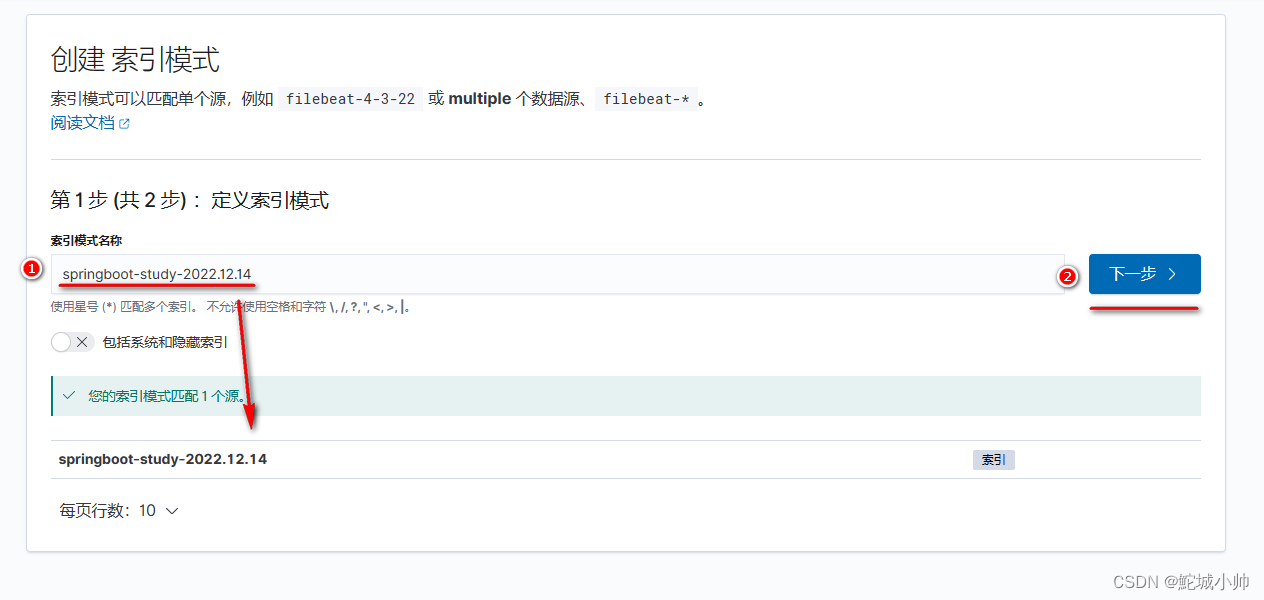
输入索引模式名称,该名称用来匹配索引。点击”下一步“,
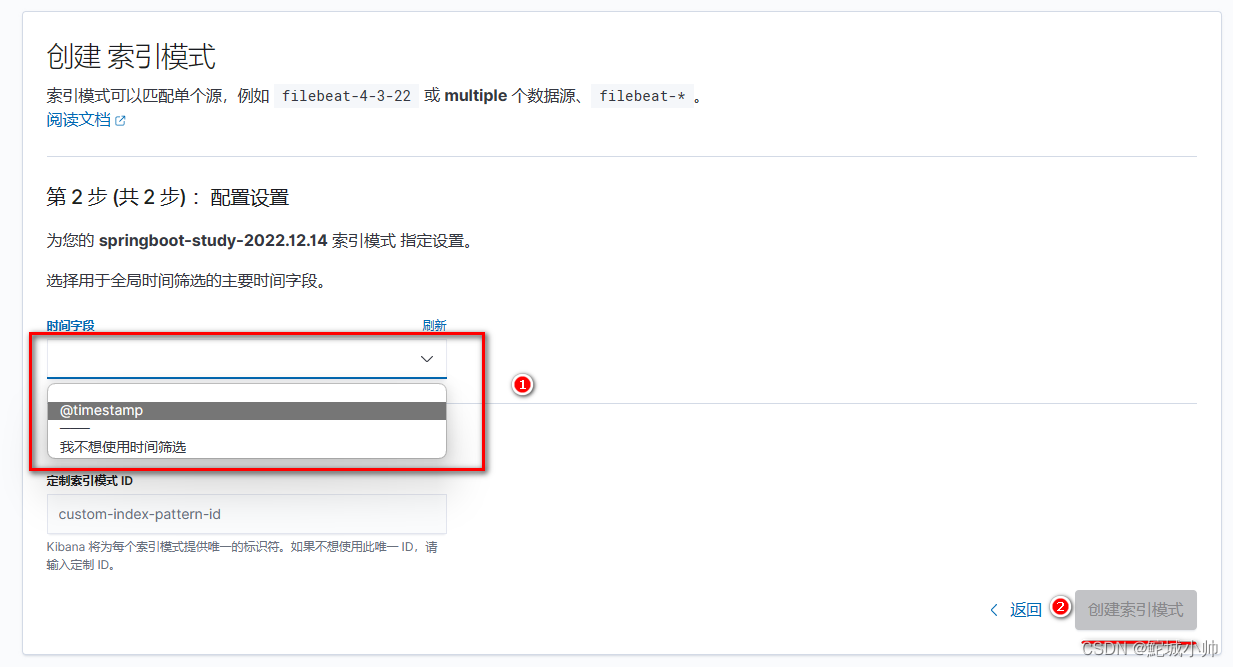
选择时间字段的设定, @timestamp 表示使用时间筛选。然后点击“创建索引模式”,

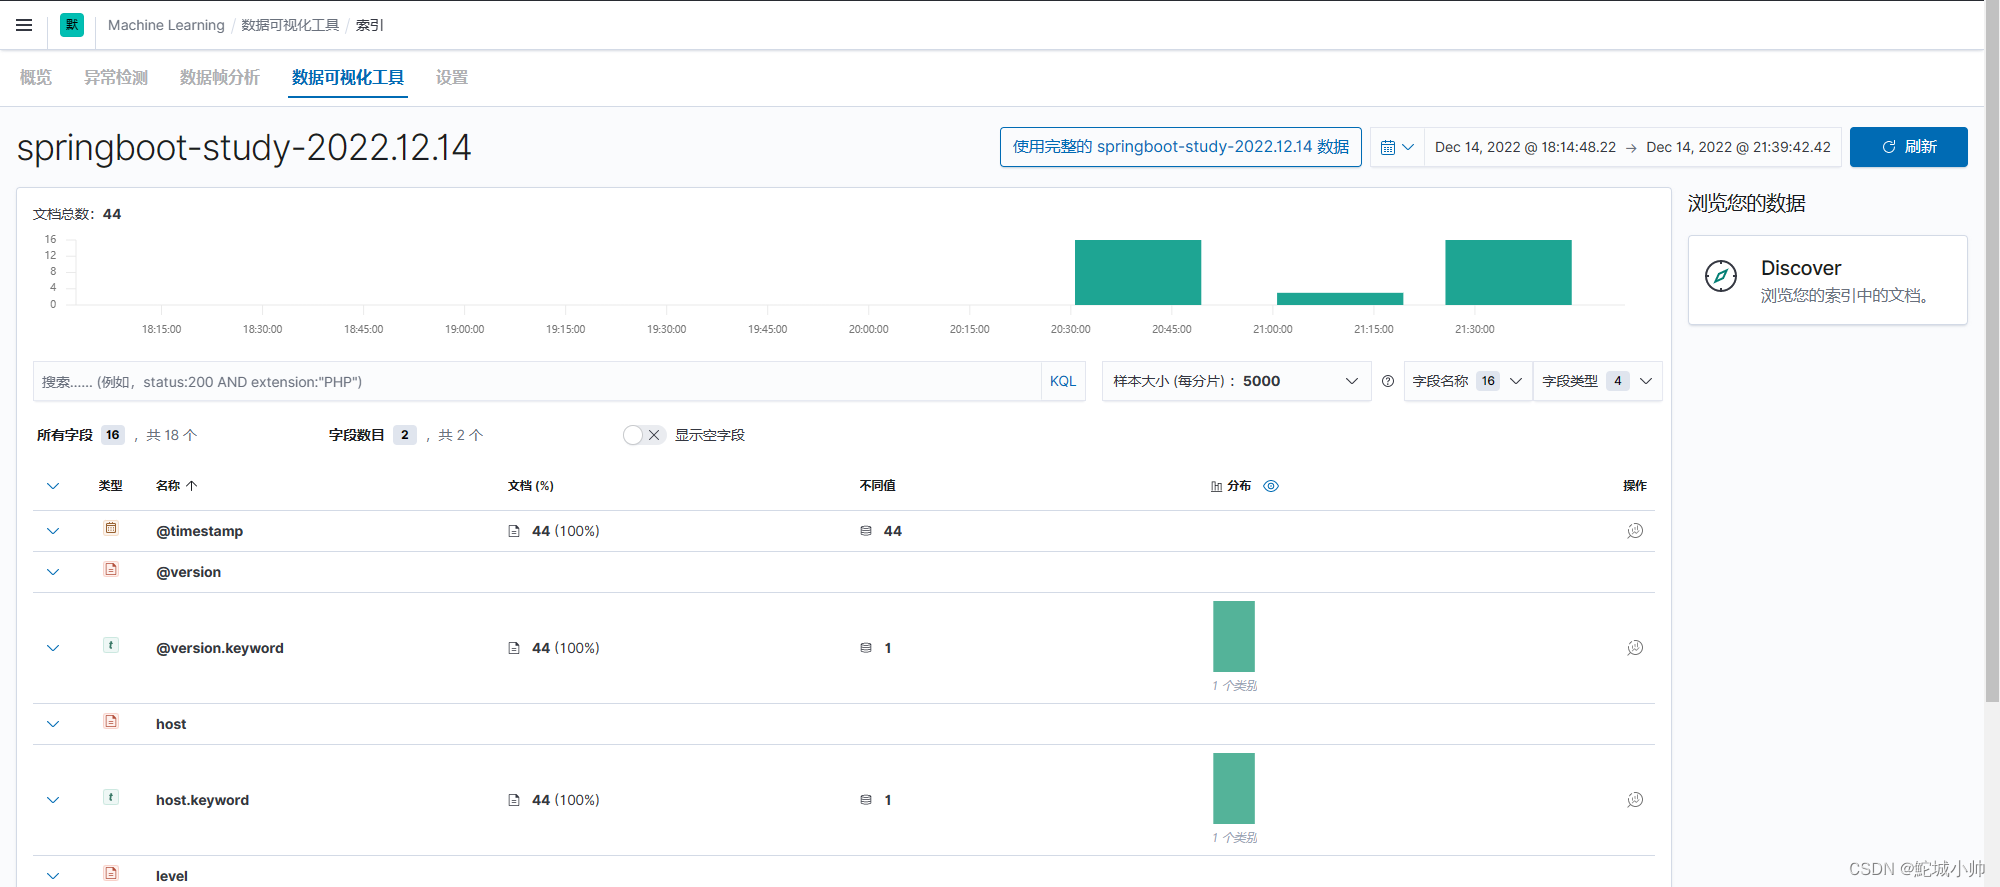
这里展示的是应用日志涉及到的字段,都是能用来筛选的条件。此时索引模式已创建完毕,如果需要添加其他字段进行过滤,比如:spring
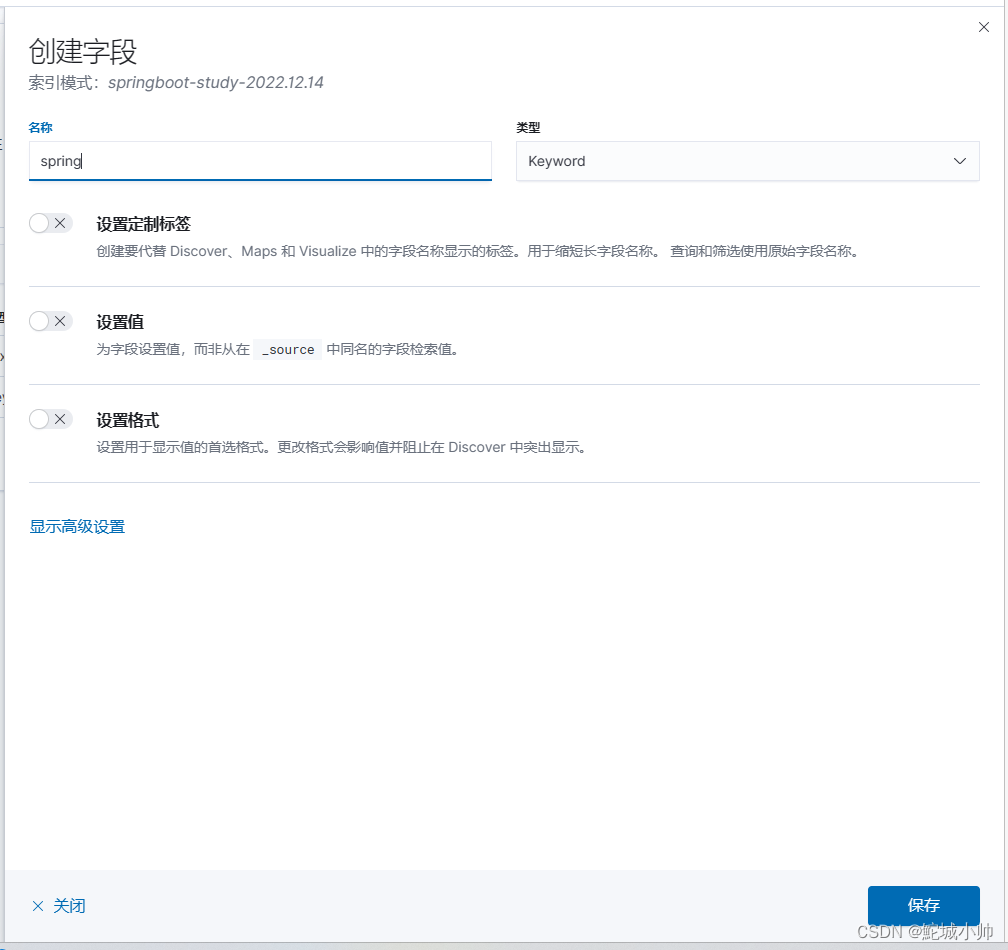
点击“添加字段” ,输入字段名,选择类型。点击 “保存” 。
(4)查看新增的索引模式
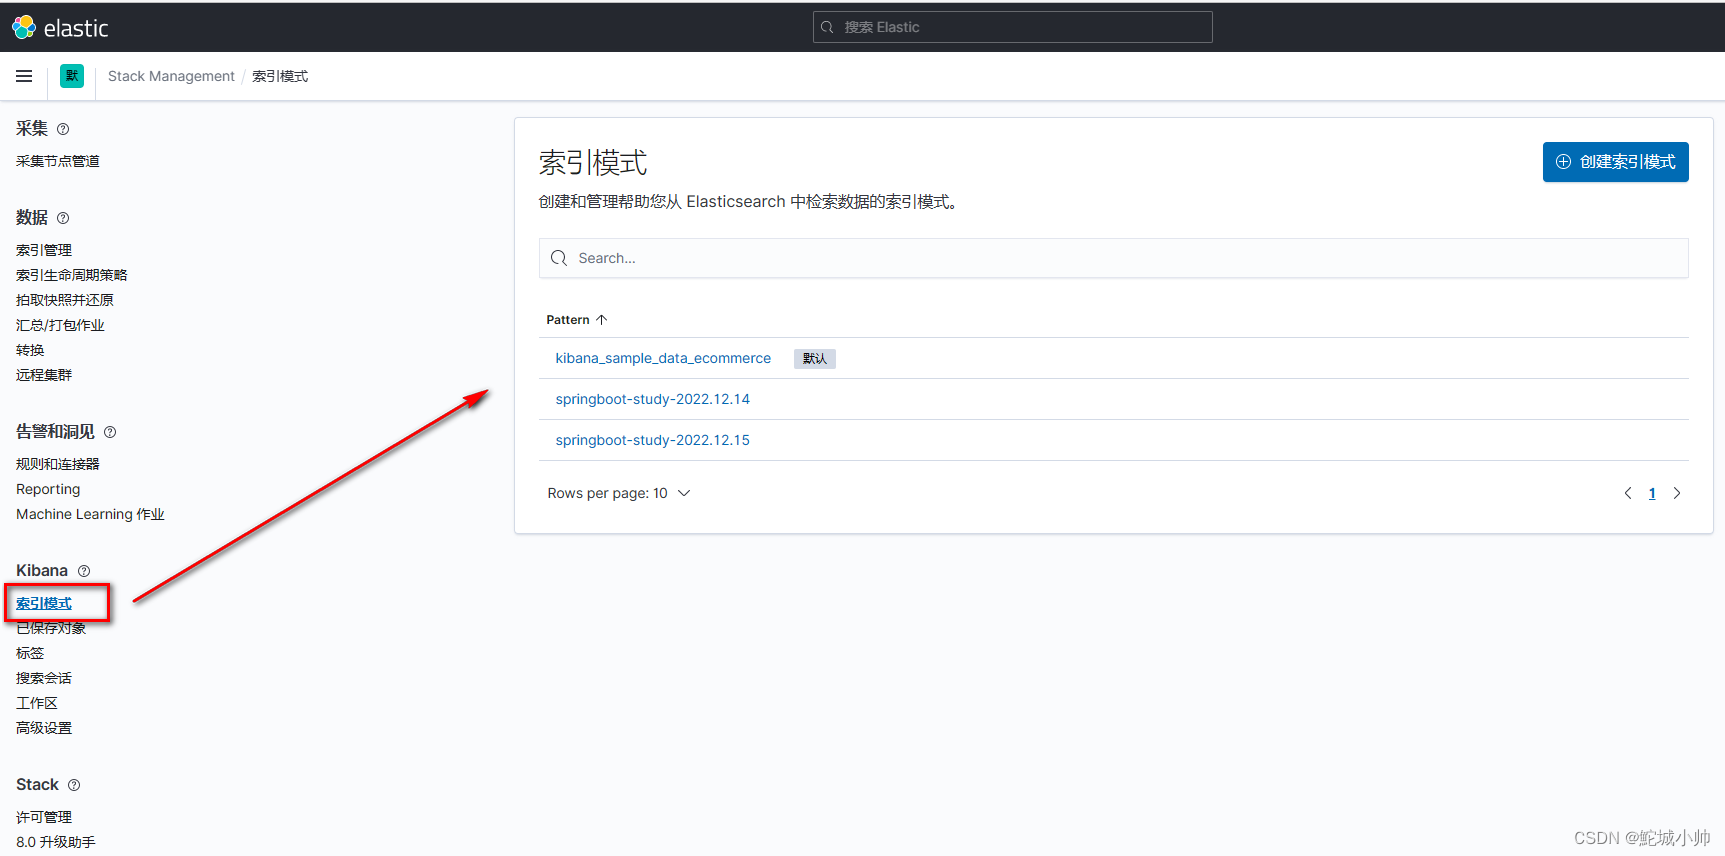
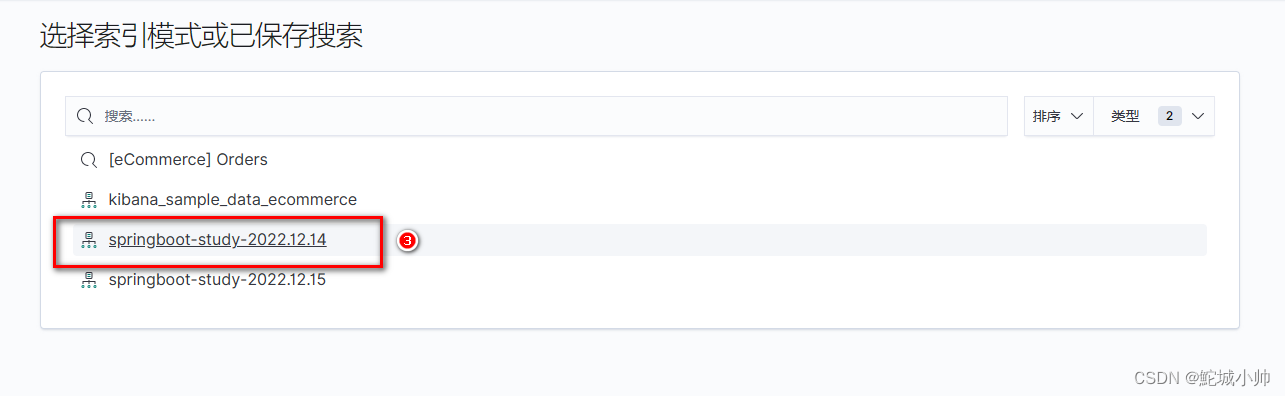
点击 “索引模式” 即可查看当前已添加的所有索引模式,包括刚刚添加的springboot-study-2022.12.14 。
(5)查看 2022.12.14 日的应用日志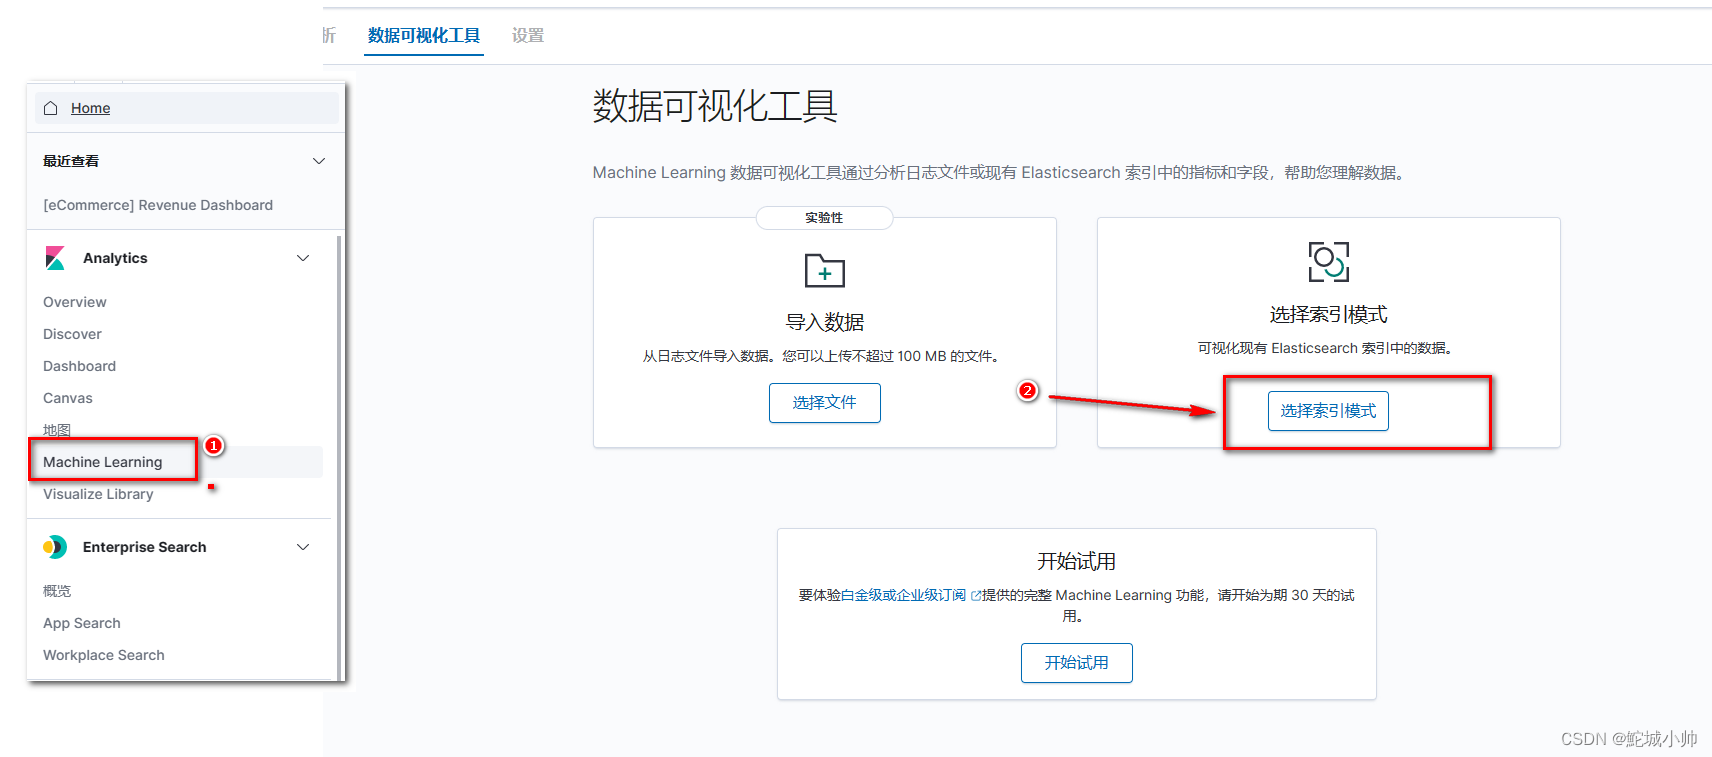
4. filebeat 安装部署
4.1 安装
# 下载软件包
wget https://artifacts.elastic.co/downloads/beats/filebeat/filebeat-7.13.4-linux-x86_64.tar.gz#解压
tar xf filebeat-7.13.4-linux-x86_64.tar.gz -C /mnt
mkdir -f /usr/local/filebeat
mv filebeat-7.13.4-linux-x86_64 /usr/local/filebeat
4.2 修改配置文件
(1)定义日志文件路径
- type: logenabled: truepaths:- /var/log/*.logtags: ["VM"]
(2)直接输出给elasticsearch(不通过logstash)
当采集的日志不用过滤、分析、丰富、统一格式等操作时可以考虑该方式
output.elasticsearch:# Array of hosts to connect to.hosts: ["192.168.126.139:9200"]
(3)如果打算用kibana来展示filebeat数据,需要配置 kibana 终端
setup.kibana:host: "192.168.126.139:5601"
(4)配置输出给logstash:
output.logstash:# The Logstash hostshosts: ["192.168.126.139:5044"]
我们前面,给应用配置的时9601的端口来发送数据给logstash,这里用5044,也是一样的道理,通过网络写传输数据。
4.3 启动 filebeat
./filebeat -e -c ./filebeat.yml查看logs:
[root@linkhot04 filebeat-7.13.4-linux-x86_64]# ./filebeat -e -c filebeat.yml
2022-12-15T15:14:36.653+0800    INFO    instance/beat.go:665    Home path: [/usr/local/filebeat-7.13.4-linux-x86_64] Config path: [/usr/local/filebeat-7.13.4-linux-x86_64] Data path: [/usr/local/filebeat-7.13.4-linux-x86_64/data] Logs path: [/usr/local/filebeat-7.13.4-linux-x86_64/logs]
2022-12-15T15:14:36.653+0800    INFO    instance/beat.go:673    Beat ID: 877dd226-ab0b-4262-b23a-af1ac06acd17
2022-12-15T15:14:36.654+0800    INFO    [seccomp]       seccomp/seccomp.go:124  Syscall filter successfully installed
2022-12-15T15:14:36.654+0800    INFO    [beat]  instance/beat.go:1014   Beat info       {"system_info": {"beat": {"path": {"config": "/usr/local/filebeat-7.13.4-linux-x86_64", "data": "/usr/local/filebeat-7.13.4-linux-x86_64/data", "home": "/usr/local/filebeat-7.13.4-linux-x86_64", "logs": "/usr/local/filebeat-7.13.4-linux-x86_64/logs"}, "type": "filebeat", "uuid": "877dd226-ab0b-4262-b23a-af1ac06acd17"}}}
2022-12-15T15:14:36.655+0800    INFO    [beat]  instance/beat.go:1023   Build info      {"system_info": {"build": {"commit": "1907c246c8b0d23ae4027699c44bf3fbef57f4a4", "libbeat": "7.13.4", "time": "2021-07-14T18:42:41.000Z", "version": "7.13.4"}}}
2022-12-15T15:14:36.655+0800    INFO    [beat]  instance/beat.go:1026   Go runtime info {"system_info": {"go": {"os":"linux","arch":"amd64","max_procs":4,"version":"go1.15.14"}}}
2022-12-15T15:14:36.656+0800    INFO    [beat]  instance/beat.go:1030   Host info       {"system_info": {"host": {"architecture":"x86_64","boot_time":"2022-12-15T12:08:53+08:00","containerized":false,"name":"linkhot04","ip":["127.0.0.1/8","::1/128","192.168.126.139/24","fe80::6e91:eaa4:109d:fc/64","192.168.122.1/24"],"kernel_version":"3.10.0-1160.76.1.el7.x86_64","mac":["00:0c:29:33:67:0b","52:54:00:ec:35:00","52:54:00:ec:35:00"],"os":{"type":"linux","family":"redhat","platform":"centos","name":"CentOS Linux","version":"7 (Core)","major":7,"minor":9,"patch":2009,"codename":"Core"},"timezone":"CST","timezone_offset_sec":28800,"id":"3d2fbdb2b2974dde9f1e324b37ddc8bb"}}}
2022-12-15T15:14:36.656+0800    INFO    [beat]  instance/beat.go:1059   Process info    {"system_info": {"process": {"capabilities": {"inheritable":null,"permitted":["chown","dac_override","dac_read_search","fowner","fsetid","kill","setgid","setuid","setpcap","linux_immutable","net_bind_service","net_broadcast","net_admin","net_raw","ipc_lock","ipc_owner","sys_module","sys_rawio","sys_chroot","sys_ptrace","sys_pacct","sys_admin","sys_boot","sys_nice","sys_resource","sys_time","sys_tty_config","mknod","lease","audit_write","audit_control","setfcap","mac_override","mac_admin","syslog","wake_alarm","block_suspend"],"effective":["chown","dac_override","dac_read_search","fowner","fsetid","kill","setgid","setuid","setpcap","linux_immutable","net_bind_service","net_broadcast","net_admin","net_raw","ipc_lock","ipc_owner","sys_module","sys_rawio","sys_chroot","sys_ptrace","sys_pacct","sys_admin","sys_boot","sys_nice","sys_resource","sys_time","sys_tty_config","mknod","lease","audit_write","audit_control","setfcap","mac_override","mac_admin","syslog","wake_alarm","block_suspend"],"bounding":["chown","dac_override","dac_read_search","fowner","fsetid","kill","setgid","setuid","setpcap","linux_immutable","net_bind_service","net_broadcast","net_admin","net_raw","ipc_lock","ipc_owner","sys_module","sys_rawio","sys_chroot","sys_ptrace","sys_pacct","sys_admin","sys_boot","sys_nice","sys_resource","sys_time","sys_tty_config","mknod","lease","audit_write","audit_control","setfcap","mac_override","mac_admin","syslog","wake_alarm","block_suspend"],"ambient":null}, "cwd": "/usr/local/filebeat-7.13.4-linux-x86_64", "exe": "/usr/local/filebeat-7.13.4-linux-x86_64/filebeat", "name": "filebeat", "pid": 6606, "ppid": 6285, "seccomp": {"mode":"filter","no_new_privs":true}, "start_time": "2022-12-15T15:14:35.790+0800"}}}
2022-12-15T15:14:36.656+0800    INFO    instance/beat.go:309    Setup Beat: filebeat; Version: 7.13.4
2022-12-15T15:14:36.656+0800    INFO    [index-management]      idxmgmt/std.go:184      Set output.elasticsearch.index to 'filebeat-7.13.4' as ILM is enabled.
2022-12-15T15:14:36.656+0800    INFO    eslegclient/connection.go:99    elasticsearch url: http://192.168.126.139:9200
2022-12-15T15:14:36.656+0800    INFO    [publisher]     pipeline/module.go:113  Beat name: linkhot04
2022-12-15T15:14:36.657+0800    INFO    [add_cloud_metadata]    add_cloud_metadata/add_cloud_metadata.go:101    add_cloud_metadata: hosting provider type not detected.
2022-12-15T15:14:36.657+0800    INFO    [monitoring]    log/log.go:117  Starting metrics logging every 30s
2022-12-15T15:14:36.658+0800    INFO    instance/beat.go:473    filebeat start running.
2022-12-15T15:14:36.658+0800    INFO    memlog/store.go:119     Loading data file of '/usr/local/filebeat-7.13.4-linux-x86_64/data/registry/filebeat' succeeded. Active transaction id=0
2022-12-15T15:14:36.670+0800    INFO    memlog/store.go:124     Finished loading transaction log file for '/usr/local/filebeat-7.13.4-linux-x86_64/data/registry/filebeat'. Active transaction id=1713
2022-12-15T15:14:36.670+0800    INFO    [registrar]     registrar/registrar.go:109      States Loaded from registrar: 21
2022-12-15T15:14:36.670+0800    INFO    [crawler]       beater/crawler.go:71    Loading Inputs: 2
2022-12-15T15:14:36.679+0800    INFO    log/input.go:157        Configured paths: [/var/log/*.log]
2022-12-15T15:14:36.679+0800    INFO    [crawler]       beater/crawler.go:141   Starting input (ID: 16472630370509875212)
2022-12-15T15:14:36.679+0800    INFO    [crawler]       beater/crawler.go:108   Loading and starting Inputs completed. Enabled inputs: 1
2022-12-15T15:14:36.679+0800    INFO    cfgfile/reload.go:164   Config reloader started
2022-12-15T15:14:36.680+0800    INFO    cfgfile/reload.go:224   Loading of config files completed.
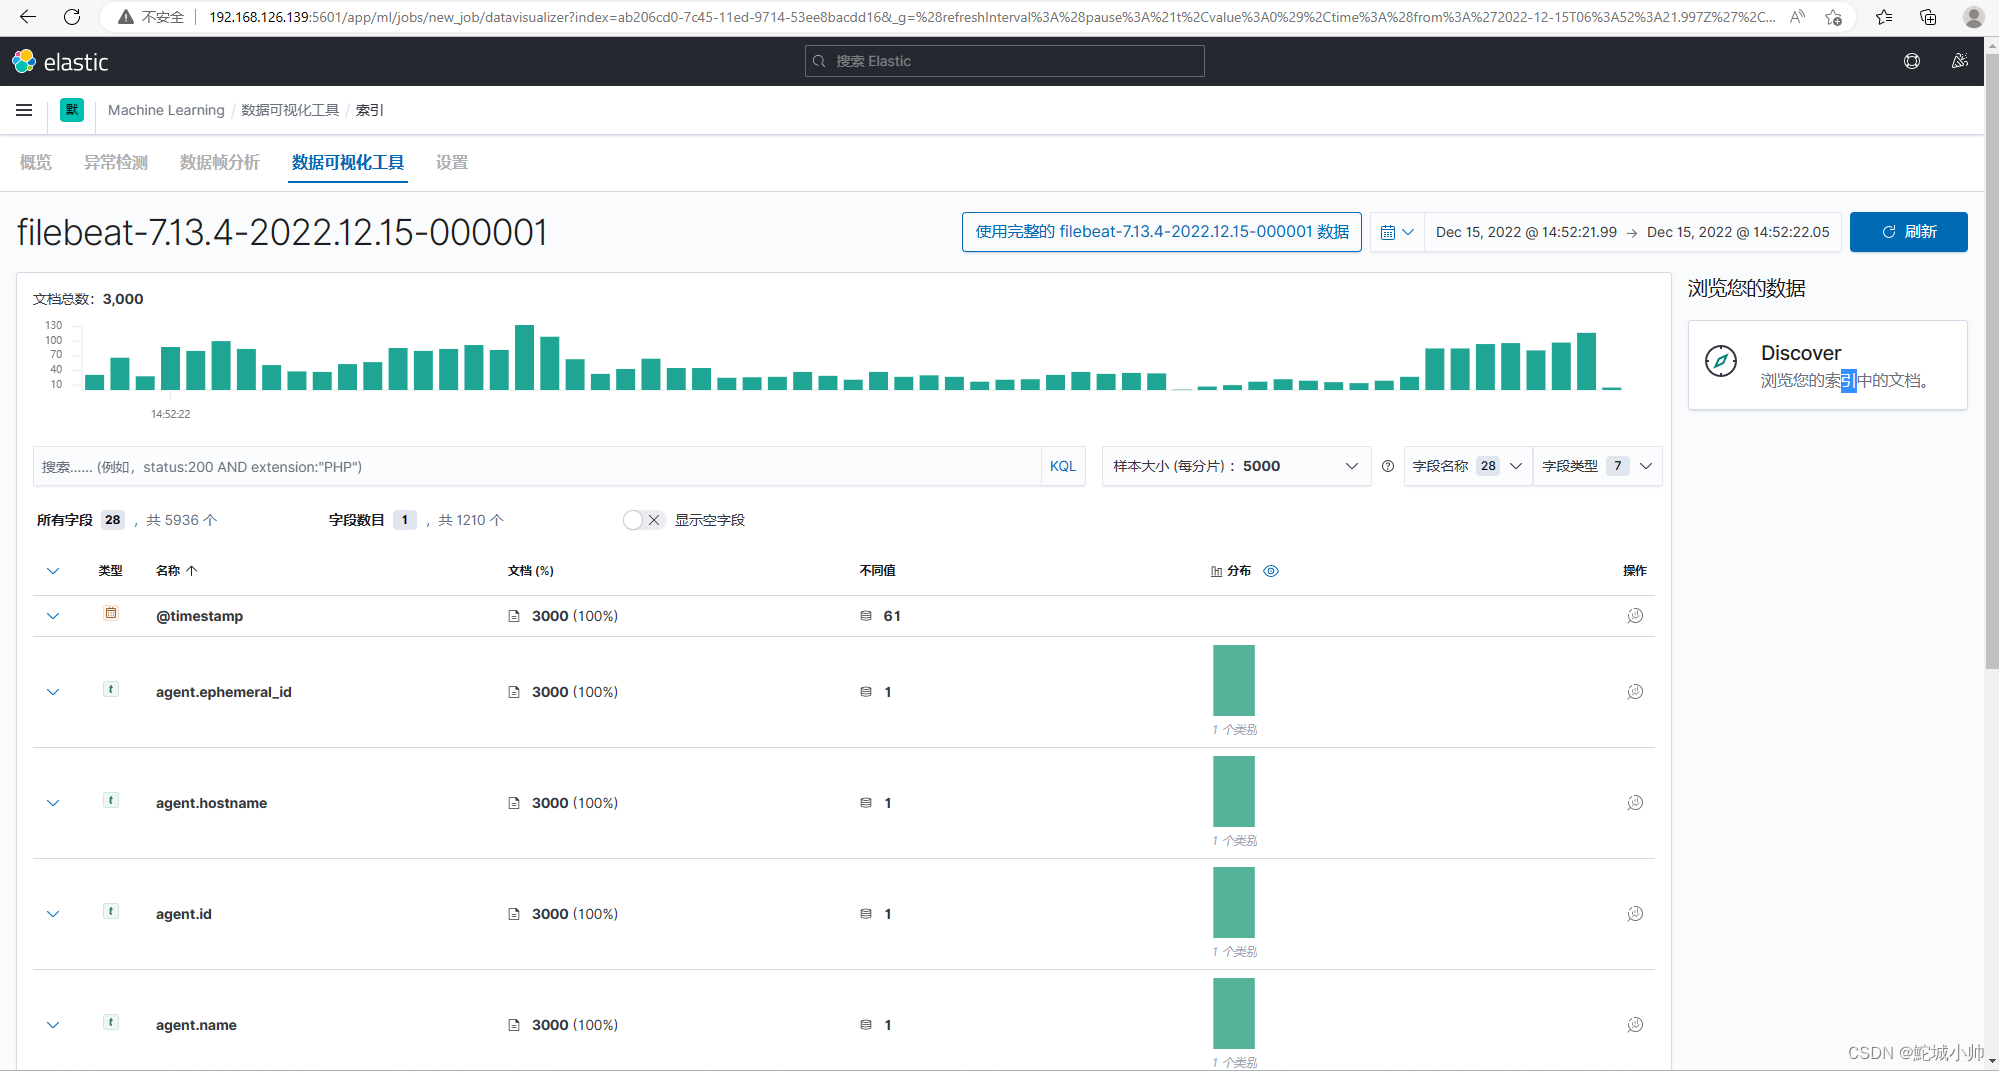
4.4 Kibana 查看 filebeat 索引
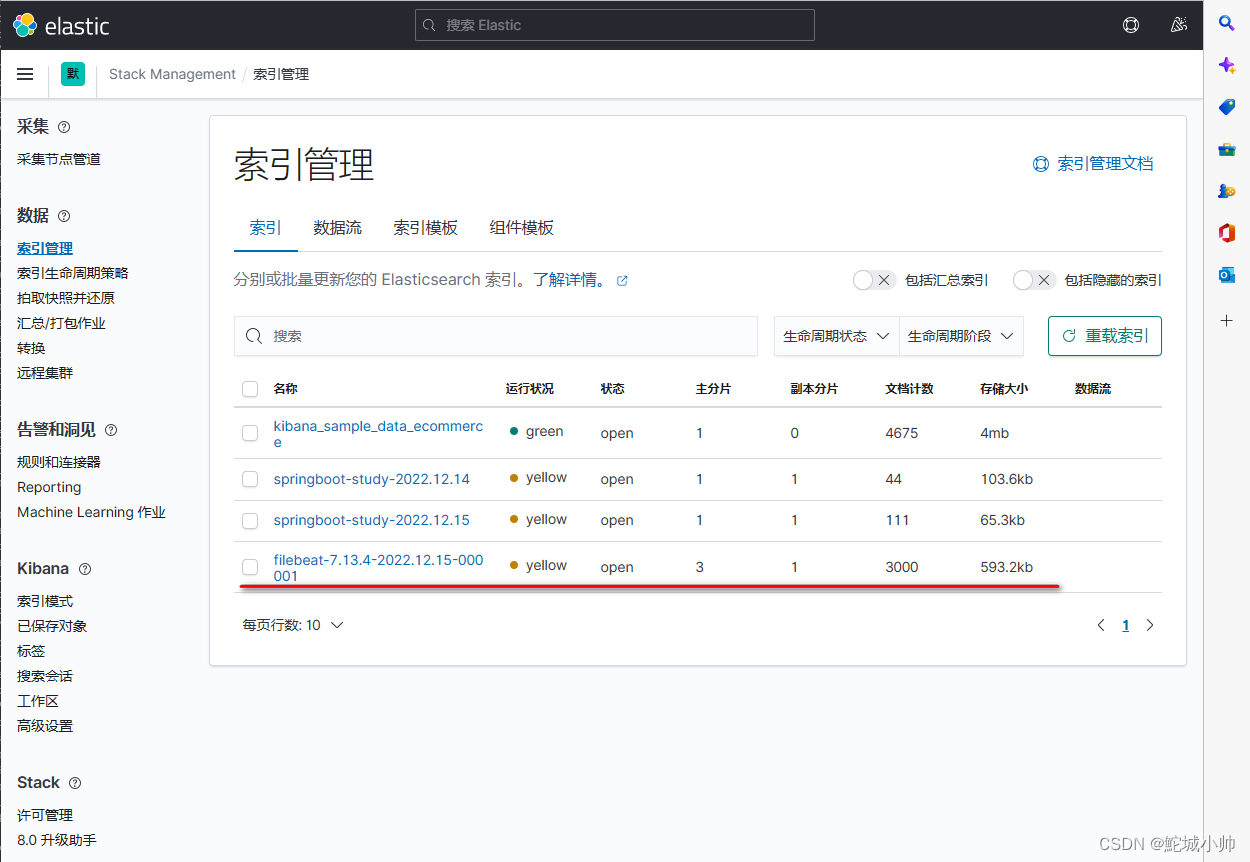
由上图可知, filebeat 的索引创建成功。在创建索引模式后,就可以对日志内容进行过滤查询了。

![[附源码]Python计算机毕业设计Django架构的博客平台设计](https://img-blog.csdnimg.cn/2c7f1f1859ac4ba2bbf804462902a5dd.png)