前言
大家好,我是沐风晓月,本文收录于《 prometheus监控系列》 ,截止目前prometheus专栏已经更新到第8篇文章。
本文中的是prometheus已经安装好,如果你还未安装,可以参考
- prometheus安装及使用入门
若你想监控其他服务可以参考:
- 监控远程主机: 云原生系列之使用 prometheus监控远程主机实战
- 监控MySQL: 云原生系列之使用 prometheus监控MySQL实战
- 监控nginx : 云原生系列之使用prometheus监控nginx
- 监控tomcat :
【云原生】prometheus结合jmx exporter 的http server模式采集tomcat监控实战
【云原生】prometheus结合jmx exporter 的java agent模式采集tomcat监控实战
如果你想实现更炫酷的可视化效果:
- 【云原生】promehtheus整合grafana实现可视化监控实战
想学习更多prometheus内容,可以关注沐风晓月 的专栏:prometheus监控系列
文章目录
- 前言
- 一. 实验环境
- 二. redis_exporter简介
- 2.1 什么是redis_exporter呢?
- 2.2 在哪里可以下载redis_exporter呢?
- 三. 安装redis
- 3.1 安装redis
- 3.2 修改redis的配置文件
- 3.3 启动redis
- 3.4 查看redis启动状态
- 四. 安装redis_exporter
- 4.1 下载redis_exporter
- 4.2 解压安装包并创建软连接
- 4.3 查看redis_exporter的帮助
- 4.4 添加redis_exporter的启动文件
- 4.5 创建运行redis_exporter的用户
- 4.6 修改redis_exporter目录所属
- 4.7 启动redis_exporter并设置开机启动
- 4.8 查看redis_exporter启动状态
- 4.9 查看redis_exporter监控的数据
- 五. 配置prometheus采集redis_exporter数据
- 5.1 修改prometheus配置文件
- 5.2 检查prometheus配置文件的语法
- 5.3 让prometheus重新读取配置文件
- 六. 查看prometheus监控的数据
- 6.1 查看prometheus监控的目标
- 6.2 查看prometheus是否采集到redis_exporer暴露的数据
- 七. 导入grafana模板
- 7.1 导入模板
- 7.2 查看结果
- 总结
一. 实验环境
本次实验环境见下表
| 操作系统 | 服务器IP | hostname |
|---|---|---|
| centos7.9 | 10.0.0.7 | mufengrow7 |
如何查看相应的参数
二. redis_exporter简介
2.1 什么是redis_exporter呢?
我们都知道redis是由C语言编写的一款高性能的NoSQL,无论在生产,测试,还是在开发的环境都可以用的上。所以对redis的监控就由为重要,而redis_exporter就是一个对redis实行实时监控的一款开源监控软件。
redis_exporter是由go语言开发的软件,并且prometheus官方推荐的一个第三方采集redis数据的exporter。
该exporter支持多个版本的redis,如:2.x,3.x,4.x,5.x,6.x和7.x。也就是说现在主流版本的redis,redis_exporter都支持。

2.2 在哪里可以下载redis_exporter呢?
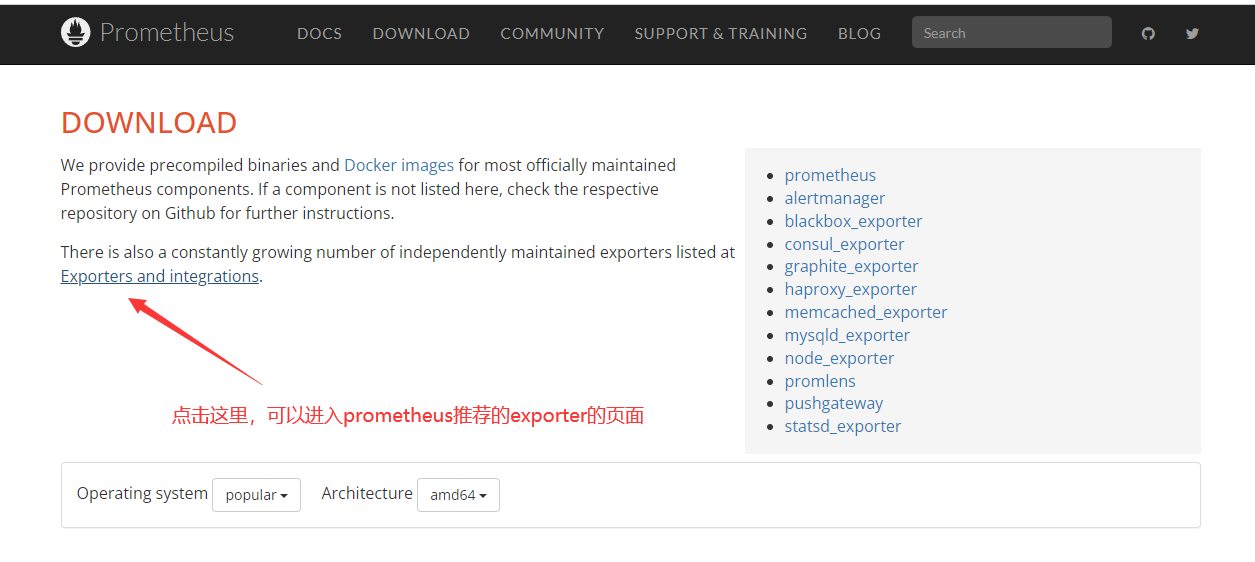
在我们进入到prometheus的下载页面时,发现根本没有“redis_exporter”的下载连接。
既然没有提供redis_rxporter的下载链接,为什么上面会说redis_exproter是prometheus官方推荐用来监控的exporer呢?
其实在官方的下载页面里,第二段话里说明了prometheus官方推荐的的exproter。我们可以点击Exporters and integrations链接,进入该页面,就可以找到redis_exporter的下载页面。
点击进入页面,在“Databases”模块里找到redis_exporter,点击连接就可以进入redis_的github页面。
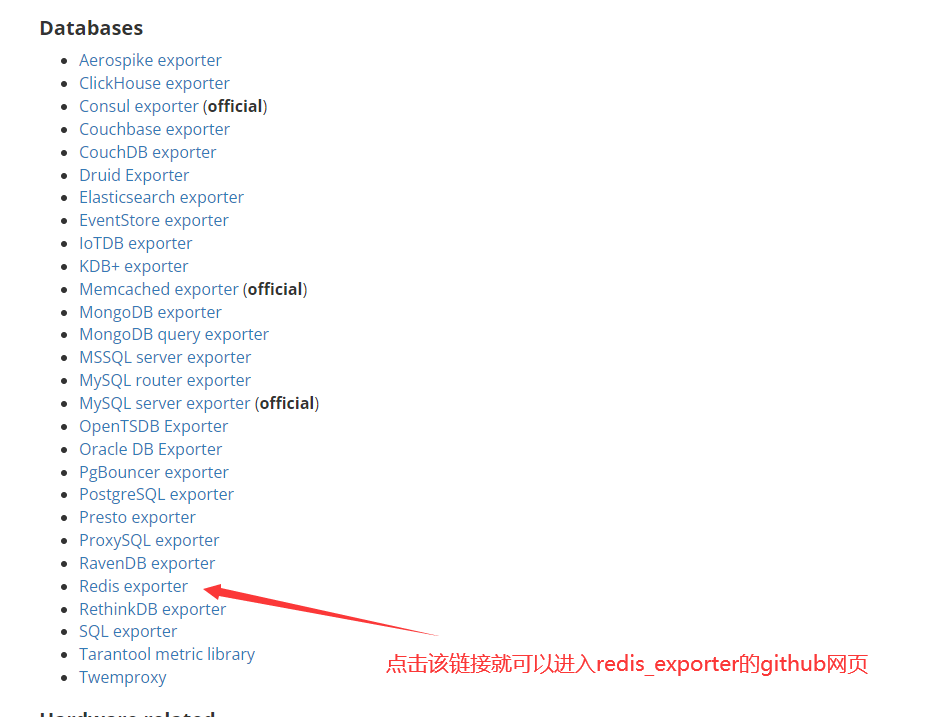
为了方便大家,这里沐风晓月直接把redis_exporter的github地址链接给贴出来,大家可以点击“redis_exporter”的链接复制下面的链接进行访问
https://prometheus.io/docs/instrumenting/exporters/
三. 安装redis
本次实验安装的redis的版本是3.2.12,通知也是centos7仓库的默认版本

3.1 安装redis
使用yum命令直接安装redis
[root@mufengrow7 ~]# yum install -y redis
看见Installed就说明redis安装完成

3.2 修改redis的配置文件
修改配置文件主要是修改redis的监听地址(redis默认的监听地址是127.0.0.1)和给redis添加密码(redis默认没有密码)。
[root@mufengrow7 ~]# vim /etc/redis.conf
#修改以下内容
bind 127.0.0.1
改为
bind 0.0.0.0 #修改监听地址# requirepass foobared
修改为
requirepass 123456 #给redis添加密码
3.3 启动redis
使用systemctl命令启动redis
[root@mufengrow7 ~]# systemctl restart redis
3.4 查看redis启动状态
使用ps和ss命令查看redis的进程和监听地址
#查看进程
[root@mufengrow7 ~]# ps -ef | grep redis | grep -v grep
redis      1813      1  0 15:48 ?        00:00:00 /usr/bin/redis-server 0.0.0.0:6379
#查看监听地址
[root@mufengrow7 ~]# ss -tnl
State      Recv-Q Send-Q                                  Local Address:Port                                                 Peer Address:Port
LISTEN     0      128                                                 *:6379                                                            *:*
LISTEN     0      128                                                 *:22                                                              *:*
LISTEN     0      128                                              [::]:9090                                                         [::]:*
LISTEN     0      128                                              [::]:22                                                           [::]:*
四. 安装redis_exporter
4.1 下载redis_exporter
进入到redis_exporter的github页面,点击右方的“Releases”,就可以选择redis_exporterr的版本进行下载。

我们下载最新版本的redis_exporter
#创建安装目录
[root@mufengrow7 ~]# mkdir -p /apps
#进入安装目录
[root@mufengrow7 ~]# cd /apps/
#使用“wget”命令进行下载
[root@mufengrow7 apps]# wget https://github.com/oliver006/redis_exporter/releases/download/v1.48.0/redis_exporter-v1.48.0.linux-amd64.tar.gz
4.2 解压安装包并创建软连接
这里给redis_exporter创建软连接是方便以后对redis_exporter进行升级换代。如果嫌麻烦这一步可以忽略。
[root@mufengrow7 apps]# tar zxf redis_exporter-v1.48.0.linux-amd64.tar.gz
[root@mufengrow7 apps]# ln -sv /apps/redis_exporter-v1.48.0.linux-amd64 /apps/redis_exporter
‘/apps/redis_exporter’ -> ‘/apps/redis_exporter-v1.48.0.linux-amd64’
4.3 查看redis_exporter的帮助
[root@mufengrow7 apps]# cd redis_exporter
[root@mufengrow7 redis_exporter]# ./redis_exporter --help
从上面查看帮助的结果可以看到redis_exporter的选项是非常多,在这里,沐风晓月挑选了几个常用的选项来给大家说明。
| 参数 | 说明 |
|---|---|
| -web.listen-address | 设置redis_exporter监听端口,默认是“:9121” |
| -web.telemetry-path | 设置暴露指标的路径,默认是“/metrics” |
| -redis.addr | redis的监听地址,默认是“redis://localhost:6379” |
| -redis.password | redis密码,默认是无密码 |
| -redis-only-metrics | 是否要输出运行时指标 |
4.4 添加redis_exporter的启动文件
[root@mufengrow7 redis_exporter]# vim /usr/lib/systemd/system/redis_exporter.service
[Unit]
Description=Prometheus exporter for machine metrics
Documentation=https://github.com/prometheus/node_exporter
After=network.target[Service]
ExecStart=/apps/redis_exporter/redis_exporter -redis.password 123456
ExecReload=/bin/kill -HUP $MAINPID
User=prometheus
Restart=always
TimeoutStopSec=20s
SendSIGKILL=no[Install]
WantedBy=multi-user.target
4.5 创建运行redis_exporter的用户
[root@mufengrow7 redis_exporter]# useradd -M -r -s /sbin/nologin prometheus
代码注释:
-M:不创建登录的家目录
-r:建立系统用户
-s:指定登录的shell类型
4.6 修改redis_exporter目录所属
[root@mufengrow7 redis_exporter]# chown -R prometheus.prometheus /apps/redis_exporter-v1.48.0.linux-amd64
4.7 启动redis_exporter并设置开机启动
#读取service文件
[root@mufengrow7 redis_exporter]# systemctl daemon-reload
#启动redis_exporter
[root@mufengrow7 redis_exporter]# systemctl start redis_exporter.service
#设置redis_exporter开机启动
[root@mufengrow7 redis_exporter]# systemctl enable redis_exporter.service
Created symlink from /etc/systemd/system/multi-user.target.wants/redis_exporter.service to /usr/lib/systemd/system/redis_exporter.service.
4.8 查看redis_exporter启动状态
[root@mufengrow7 redis_exporter]# ps -ef | grep redis_exporter | grep -v grep
prometh+   1972      1  0 16:52 ?        00:00:00 /apps/redis_exporter/redis_exporter -redis.password 123456
[root@mufengrow7 redis_exporter]# ss -tnl
State      Recv-Q Send-Q                                  Local Address:Port                                                 Peer Address:Port
LISTEN     0      128                                                 *:6379                                                            *:*
LISTEN     0      128                                                 *:22                                                              *:*
LISTEN     0      128                                              [::]:9121                                                         [::]:*
LISTEN     0      128                                              [::]:9090                                                         [::]:*
4.9 查看redis_exporter监控的数据
浏览器访问:
10.0.0.7:9121/metrics
下面为redis_exporter采集到的部分数据

五. 配置prometheus采集redis_exporter数据
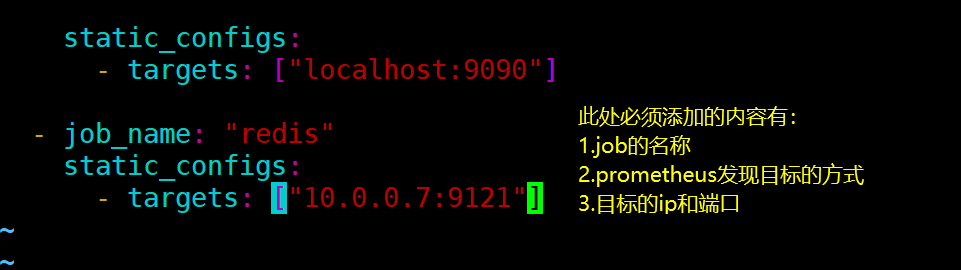
5.1 修改prometheus配置文件
修改的方式如图:
5.2 检查prometheus配置文件的语法
检查结果出现“SUCCESS”证明语法没问题,可以让prometheus重新读取文件
[root@mufengrow7 prometheus]# ./promtool check config prometheus.yml
Checking prometheus.ymlSUCCESS: prometheus.yml is valid prometheus config file syntax
5.3 让prometheus重新读取配置文件
[root@mufengrow7 prometheus]# systemctl restart prometheus.service
六. 查看prometheus监控的数据
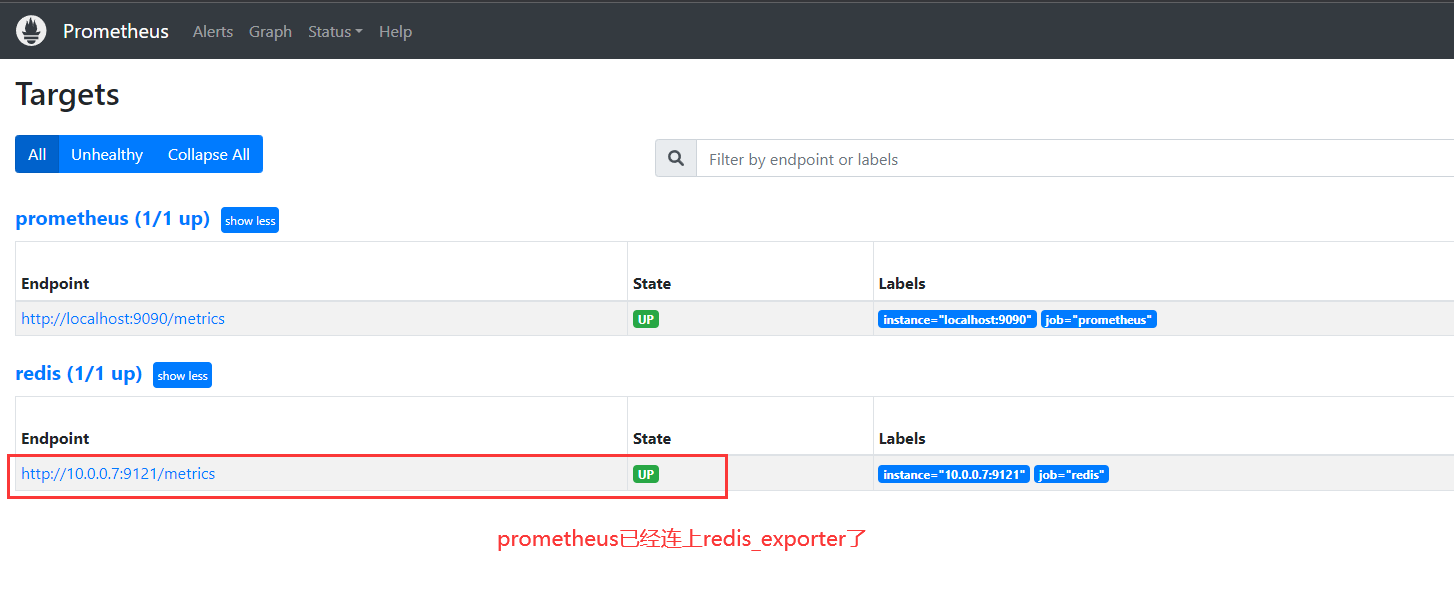
6.1 查看prometheus监控的目标
我们到prometheus的网页端的Targets查看prometheus是否能能连接上redis_exporter。
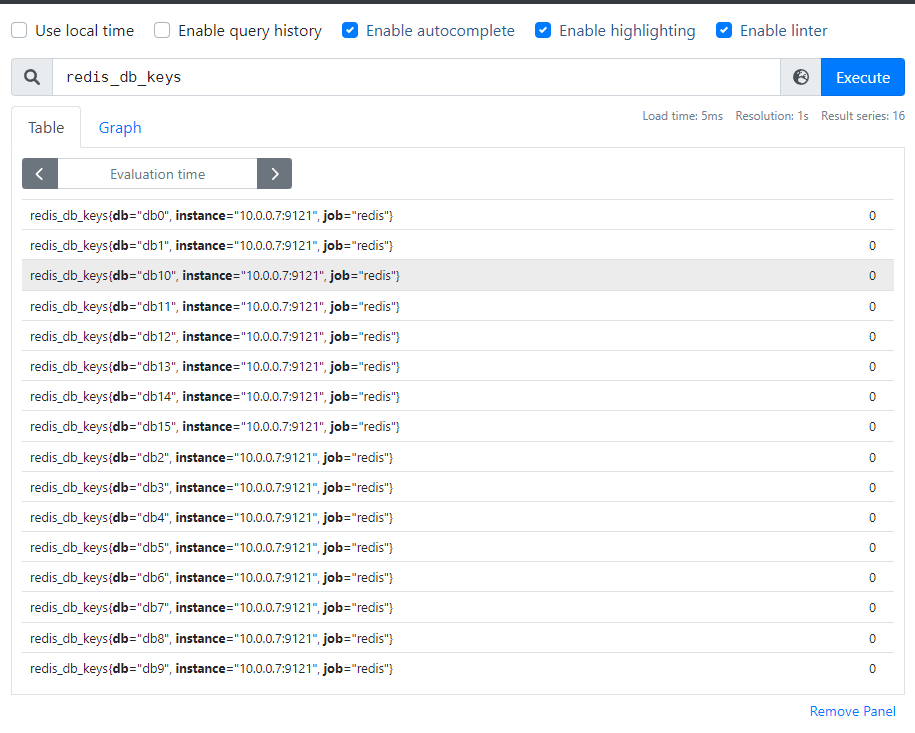
6.2 查看prometheus是否采集到redis_exporer暴露的数据
我们到prometheus网页端的Graph,搜索redis_exporter的监控项,查看prometheus是否采集到数据。
通过下面的查询,我们确定了prometheus已经有采集到redis_exporter的数据。
- 查看“redis_instance_info”数据

- 查看“redis_uptime_in_seconds”

- 查看“redis_db_keys”
七. 导入grafana模板
本文中的grafana已经安装好了,如果你还未安装,可以参考文章:promehtheus整合grafana实现可视化监控实战
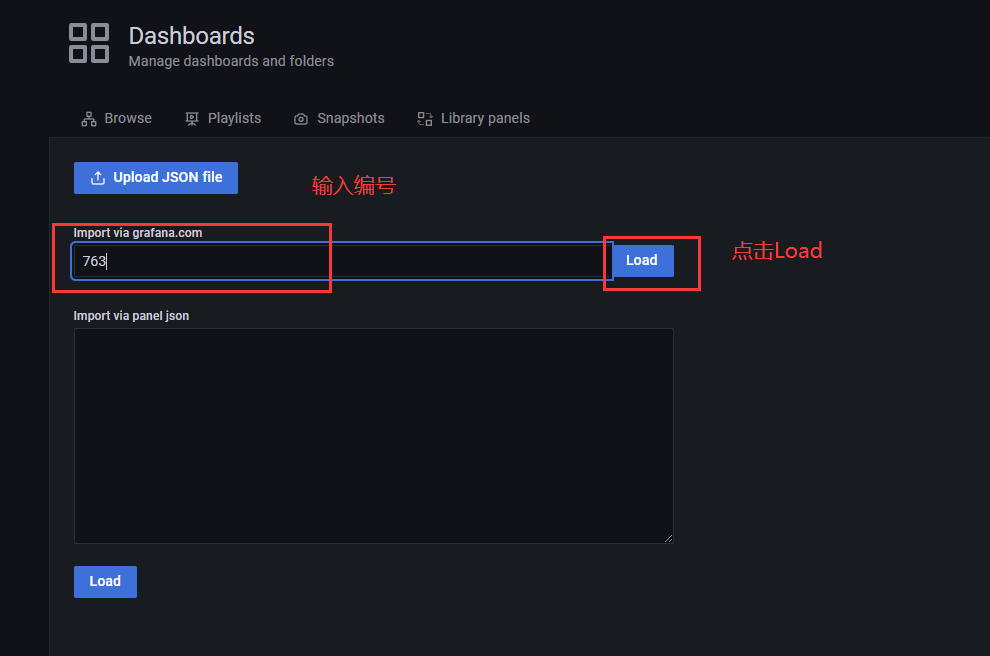
7.1 导入模板
grafana推荐模板:763
以编号763为例:
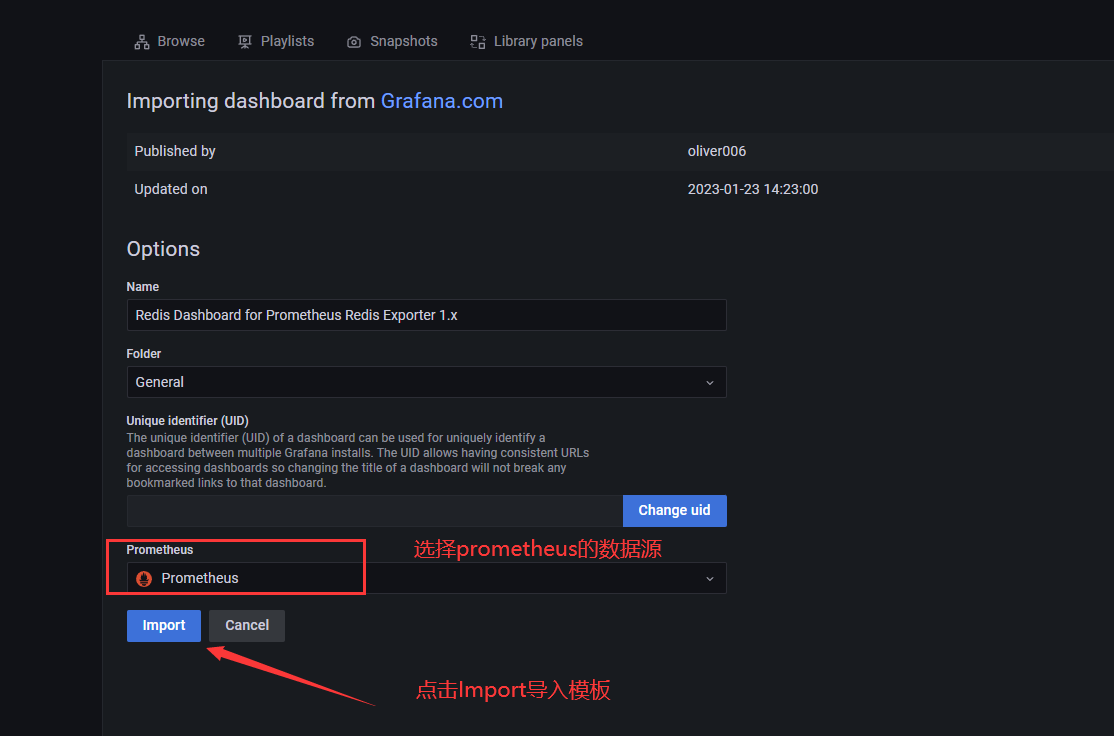
- 输入模板编号,点击右方的Load
- 选择prometheus的数据源,点击Import导入模板
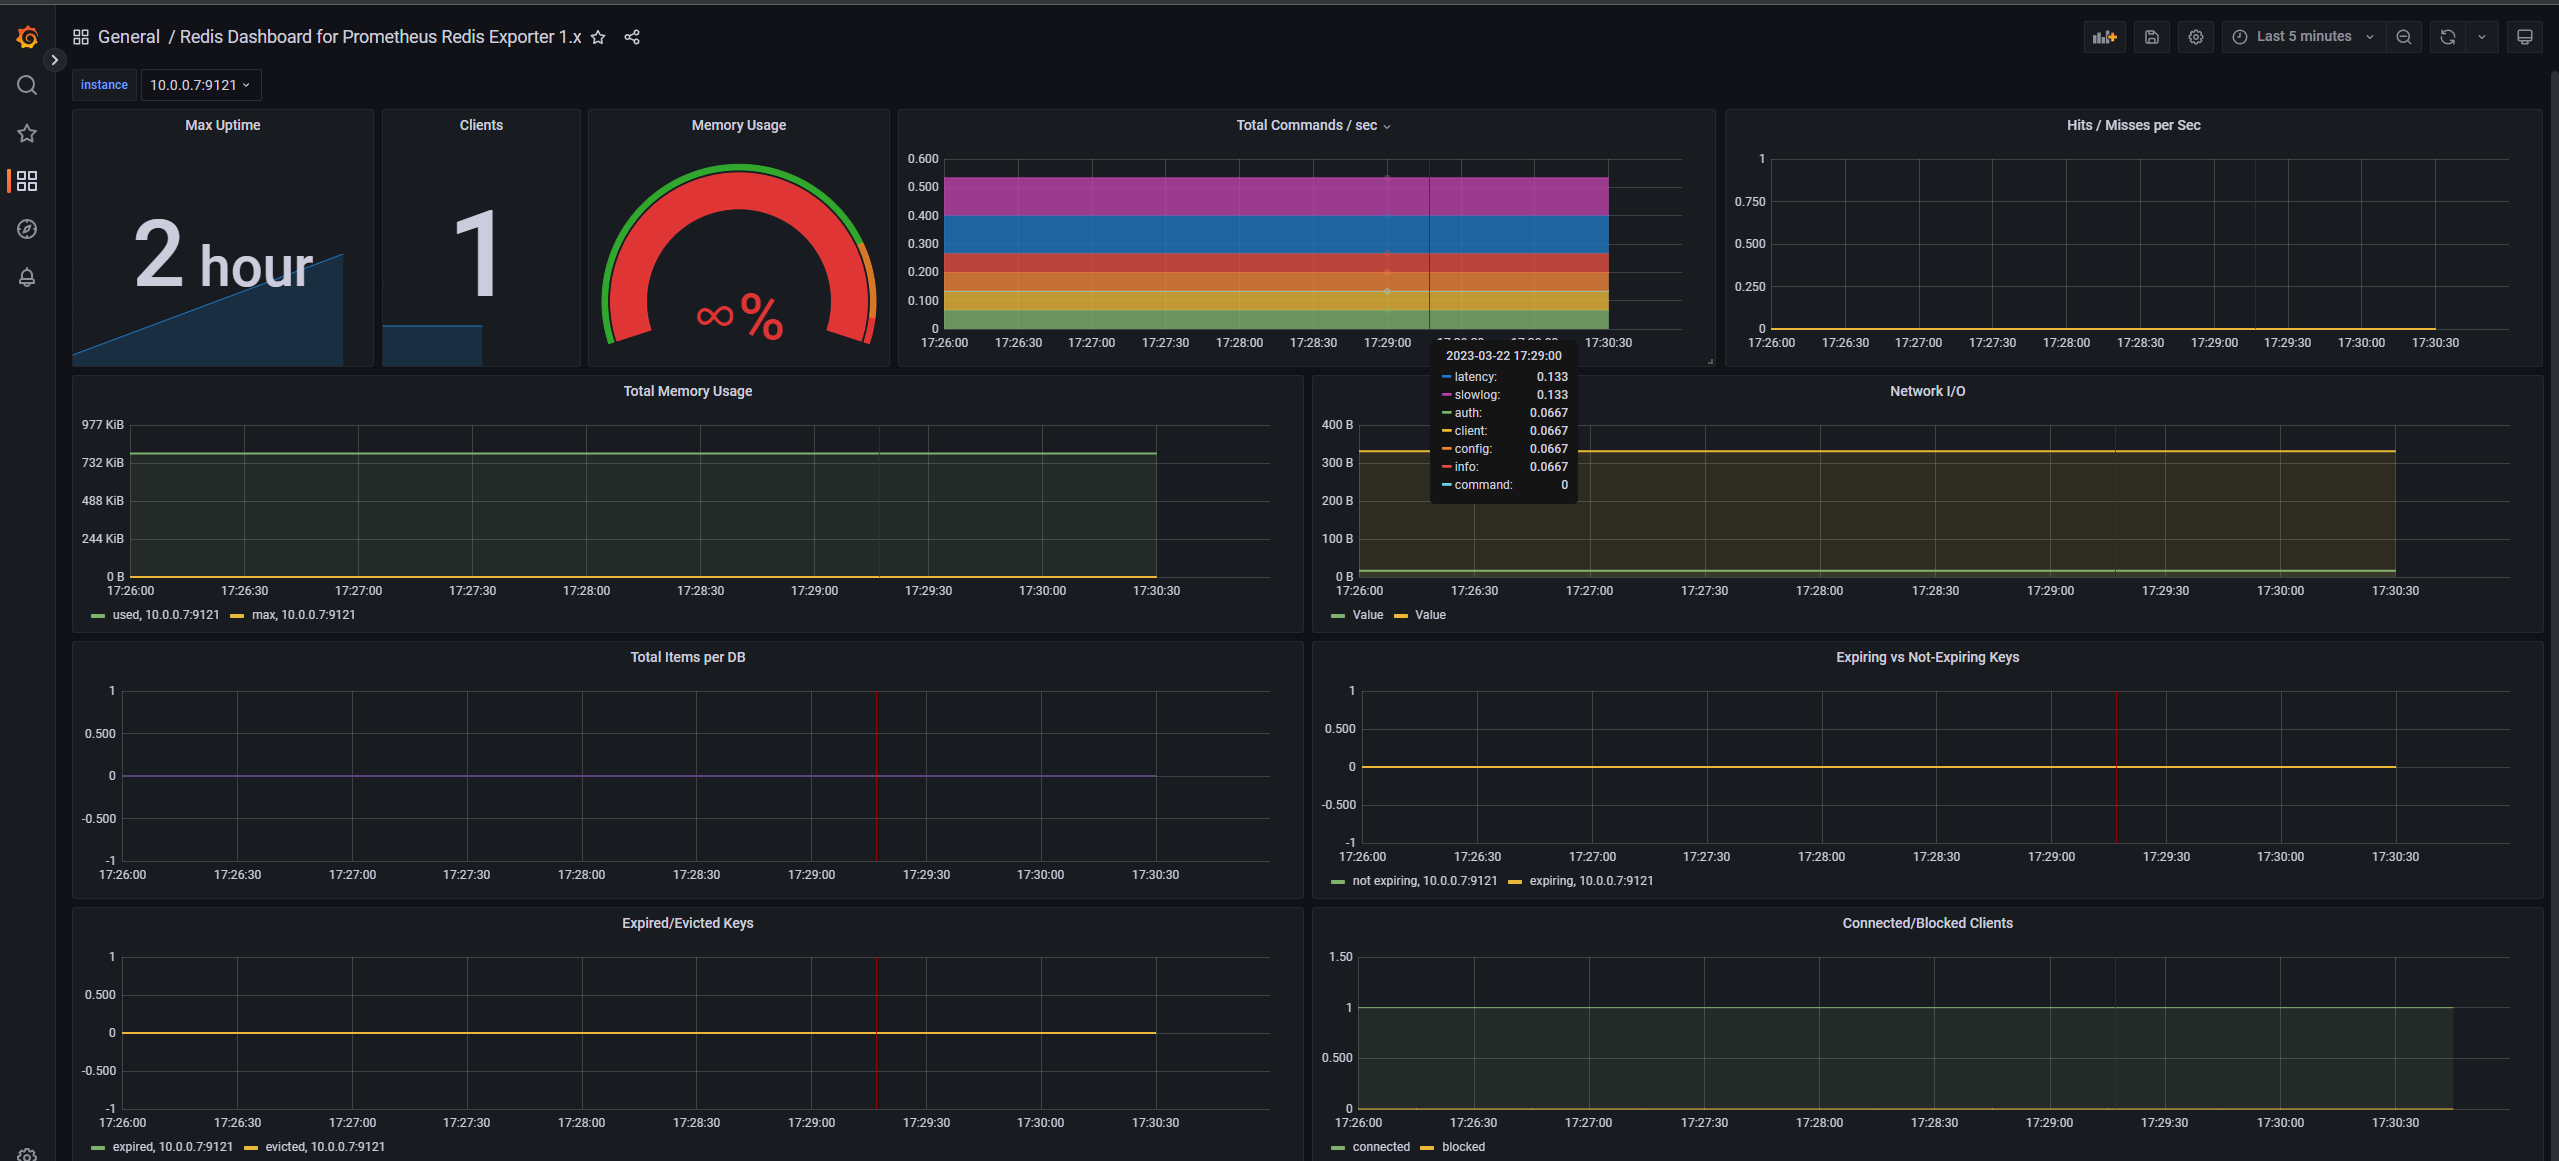
7.2 查看结果
以下是编号为“763”模板的结果,如果目标有什么问题可以自行修改
总结
prometheus的专栏持续更新中,欢迎留言跟我一起讨论,点赞收藏吧
💕 好啦,这就是今天要分享给大家的全部内容了,我们下期再见!
💕 博客主页:mufeng.blog.csdn.net
💕 本文由沐风晓月原创,首发于CSDN博客
💕 全力以赴,持续学习,不负如来不负卿,喜欢的话记得点赞收藏哦

![[SpringBoot] 解决Redis相关问题](/images/no-images.jpg)