文章目录
- 0 前置
- 1 基础API——绘制三角函数曲线
- 2 图例、注释、文本——绘制正态分布曲线
- 3 轮廓——绘制圆锥曲线
- 4 绘制极坐标方程(心形线、玫瑰线、阿基米德螺线)
- 5 3D图(球、马鞍面)
0 前置
import numpy as np
import matplotlib.pyplot as plt
import os
from mpl_toolkits.mplot3d import Axes3D# 设置中文
plt.rcParams['font.sans-serif'] = 'SimHei'
plt.rcParams['axes.unicode_minus'] = False  # 用来正常显示负号
# 创建文件夹
if not os.path.exists("./figure"):os.mkdir("./figure")
1 基础API——绘制三角函数曲线
# 基本API-三角函数
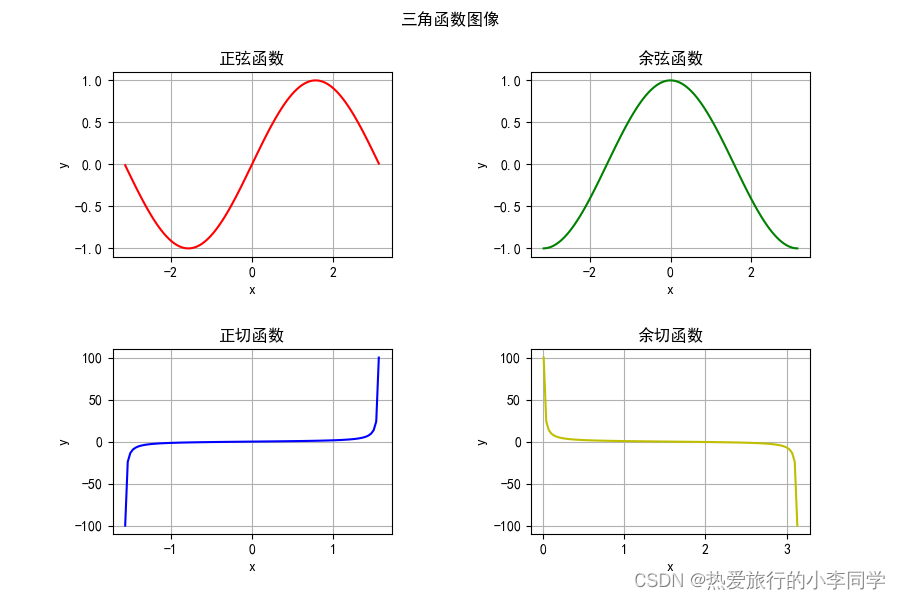
def test01():plt.subplots(2, 2)plt.figure(figsize=(9, 6))  # 设置图片大小 1单位是100像素x = np.linspace(-np.pi + 0.01, np.pi - 0.01, 100)y1 = np.sin(x)plt.subplot(2, 2, 1)plt.xlabel("x")plt.ylabel("y")plt.grid()plt.title("正弦函数")plt.plot(x, y1, c='r')y2 = np.cos(x)plt.subplot(2, 2, 2)plt.xlabel("x")plt.ylabel("y")plt.grid()plt.title("余弦函数")plt.plot(x, y2, c='g')x2 = np.linspace(-np.pi / 2 + 0.01, np.pi / 2 - 0.01, 100)y3 = np.tan(x2)plt.subplot(2, 2, 3)plt.xlabel("x")plt.ylabel("y")plt.grid()plt.title("正切函数")plt.plot(x2, y3, c='b')x3 = np.linspace(0.01, np.pi - 0.01, 100)y3 = 1 / np.tan(x3)plt.subplot(2, 2, 4)plt.xlabel("x")plt.ylabel("y")plt.grid()plt.title("余切函数")plt.plot(x3, y3, c='y')plt.subplots_adjust(wspace=0.5, hspace=0.5)  # 调整子图之间的距离plt.suptitle("三角函数图像")plt.savefig("./figure/三角函数图像.png")plt.show()
结果
2 图例、注释、文本——绘制正态分布曲线
def normal_distribution(x, u, sigma):return np.exp(-(x - u) ** 2 / (2 * sigma) ** 2) / (np.sqrt(2 * np.pi) * sigma)# 图例、注释、文本-正态分布曲线
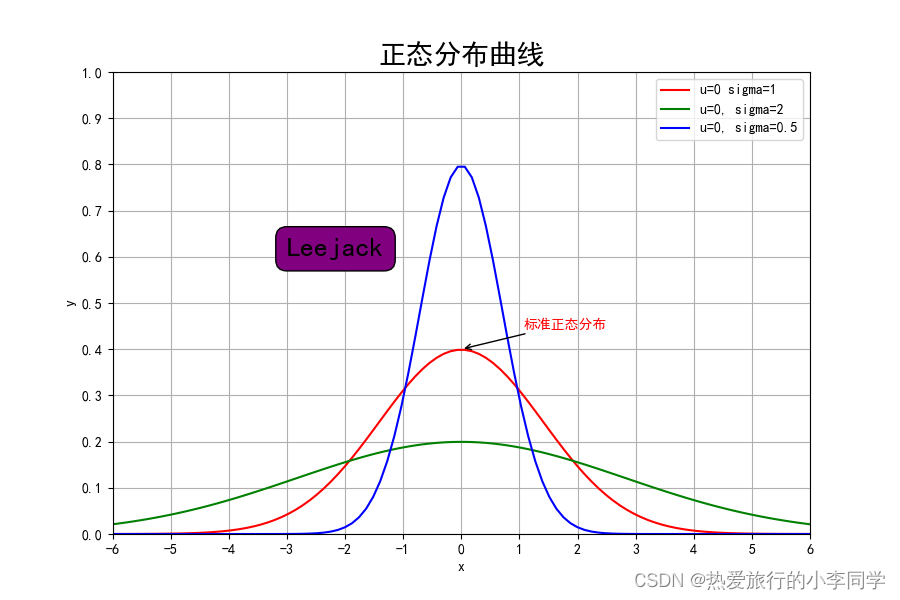
def test02():# 图片大小plt.figure(figsize=(9, 6))u1, sigma1 = 0, 1u2, sigma2 = 0, 2u3, sigma3 = 0, 0.5x1 = np.linspace(u1 - 3 * sigma2, u1 + 3 * sigma2, 100)x2 = np.linspace(u2 - 3 * sigma2, u2 + 3 * sigma2, 100)x3 = np.linspace(u3 - 3 * sigma2, u3 + 3 * sigma2, 100)y1 = normal_distribution(x1, u1, sigma1)y2 = normal_distribution(x2, u2, sigma2)y3 = normal_distribution(x3, u3, sigma3)plt.xlabel("x")plt.ylabel("y")plt.xticks(np.arange(-6, 7))plt.yticks(0.1 * np.arange(0, 11))plt.xlim([-6, 6])plt.ylim([0, 1])plt.grid()line1, = plt.plot(x1, y1, c='r')line2, = plt.plot(x2, y2, c='g')line3, = plt.plot(x3, y3, c='b')# 图例plt.legend(handles=[line1, line2, line3], labels=["u=0 sigma=1", "u=0, sigma=2", "u=0, sigma=0.5"], loc="best",frameon=True)# 注释plt.annotate(text="标准正态分布", xy=(0, 0.4), xytext=(45, 15), color='r',textcoords='offset points', arrowprops=dict(arrowstyle="->", color="k"))# 文本plt.text(x=-3, y=0.6, s="Leejack", fontsize=20, bbox=dict(boxstyle="round,pad=0.4", fc="purple"))plt.title("正态分布曲线", fontdict={"size": 20})  # 修改标题字号plt.savefig("./figure/标准正态分布图像.png")plt.show()
结果
3 轮廓——绘制圆锥曲线
# 轮廓 plt.contour() np.meshgrid()-圆锥曲线
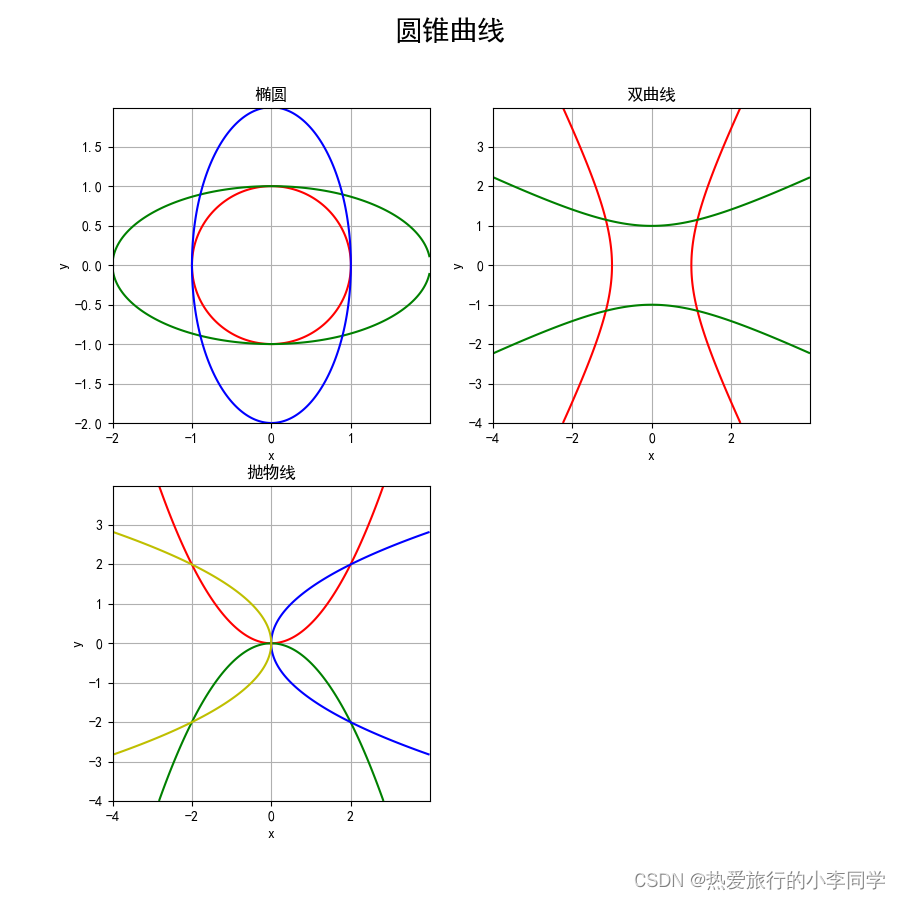
def test03():plt.subplots(2, 2)plt.figure(figsize=(9, 9))# 椭圆plt.subplot(2, 2, 1)# 绘制坐标x1 = np.arange(-1.5, 1.5, 0.01)y1 = np.arange(-1.5, 1.5, 0.01)# 转换为网格x1, y1 = np.meshgrid(x1, y1)z1 = x1 ** 2 + y1 ** 2 - 1plt.contour(x1, y1, z1, 0, colors='r')x2 = np.arange(-2, 2, 0.01)y2 = np.arange(-2, 2, 0.01)x2, y2 = np.meshgrid(x2, y2)a, b = 2, 1z21 = (x2 ** 2) / (a ** 2) + (y2 ** 2) / (b ** 2) - 1plt.contour(x2, y2, z21, 0, colors='g')a, b = 1, 2z22 = (x2 ** 2) / (a ** 2) + (y2 ** 2) / (b ** 2) - 1plt.contour(x2, y2, z22, 0, colors='b')plt.grid()plt.title("椭圆")plt.xlabel("x")plt.ylabel("y")# 双曲线plt.subplot(2, 2, 2)x3 = np.arange(-4, 4, 0.01)y3 = np.arange(-4, 4, 0.01)x3, y3 = np.meshgrid(x3, y3)a, b = 1, 2z31 = (x3 ** 2) / (a ** 2) - (y3 ** 2) / (b ** 2) - 1  # 焦点在x轴上z32 = (y3 ** 2) / (a ** 2) - (x3 ** 2) / (b ** 2) - 1  # 焦点在y轴上plt.contour(x3, y3, z31, 0, colors='r')plt.contour(x3, y3, z32, 0, colors='g')plt.grid()plt.title("双曲线")plt.xlabel("x")plt.ylabel("y")# 抛物线plt.subplot(2, 2, 3)x4 = np.arange(-4, 4, 0.01)y4 = np.arange(-4, 4, 0.01)x4, y4 = np.meshgrid(x4, y4)p = 1z41 = x4 ** 2 - 2 * p * y4z42 = x4 ** 2 + 2 * p * y4z43 = 2 * p * x4 - y4 ** 2z44 = -2 * p * x4 - y4 ** 2plt.contour(x4, y4, z41, 0, colors='r')plt.contour(x4, y4, z42, 0, colors='g')plt.contour(x4, y4, z43, 0, colors='b')plt.contour(x4, y4, z44, 0, colors='y')plt.grid()plt.title("抛物线")plt.xlabel("x")plt.ylabel("y")plt.suptitle("圆锥曲线", fontsize=20)plt.savefig("./figure/圆锥曲线.png")plt.show()
结果
4 绘制极坐标方程(心形线、玫瑰线、阿基米德螺线)
心形线方程:

玫瑰线方程:

阿基米德螺线方程:

# 极坐标方程
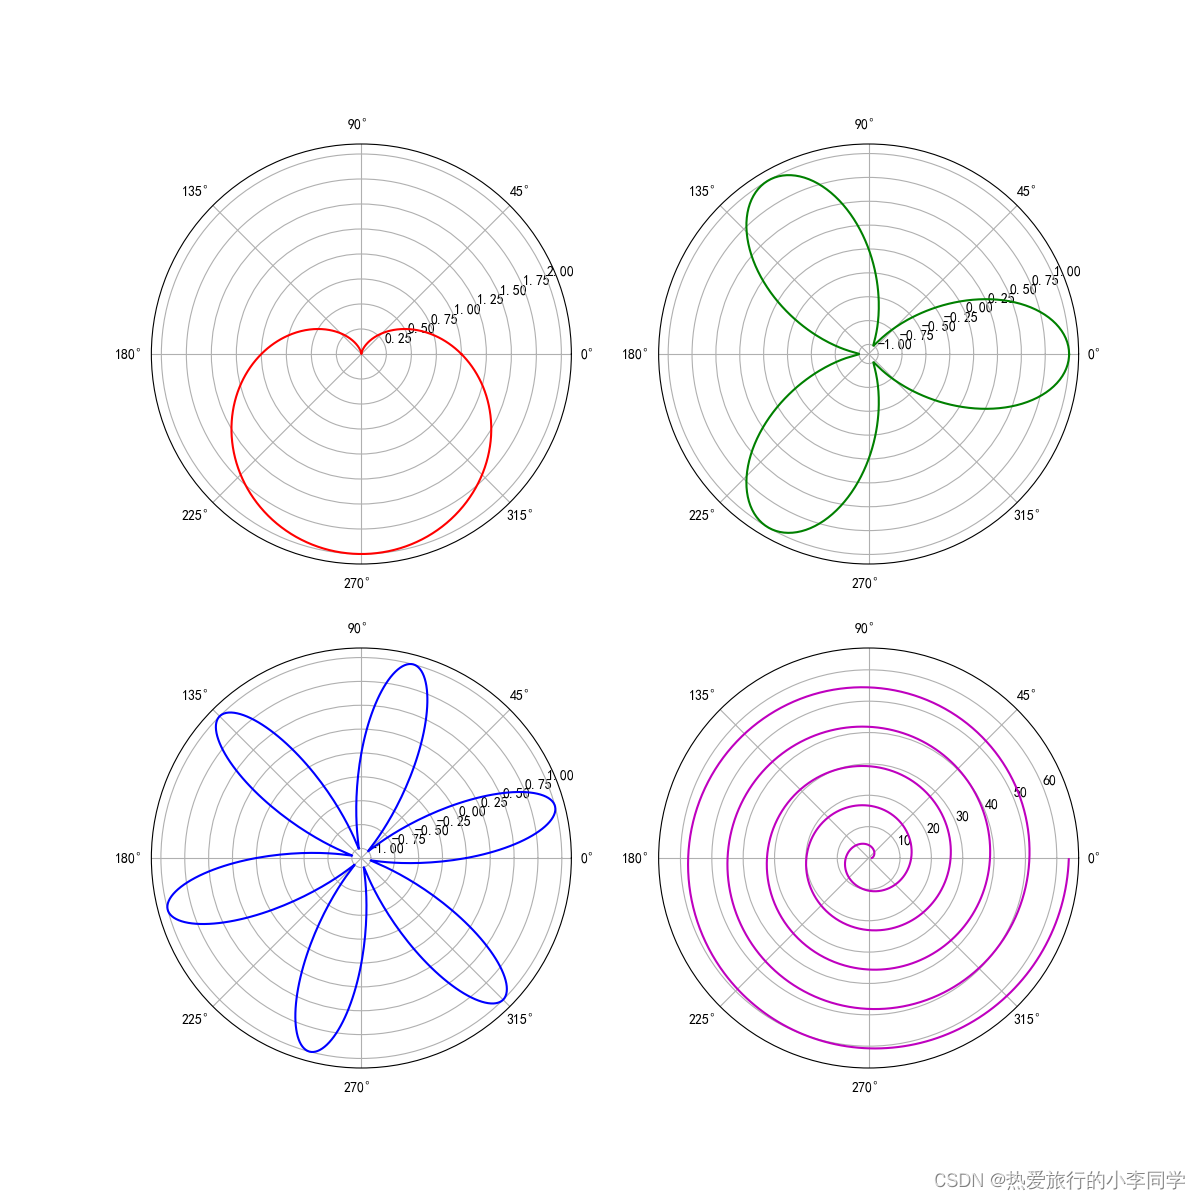
def test04():plt.subplots(2, 2)plt.figure(figsize=(12, 12))ax1 = plt.subplot(221, projection="polar")theta = np.arange(0, 2 * np.pi, 0.01)# 心形线a = 1rou1 = a * (1 - np.sin(theta))ax1.plot(theta, rou1, 'r')# 玫瑰线ax2 = plt.subplot(222, projection="polar")rou2 = a * np.cos(3 * theta)ax2.plot(theta, rou2, 'g')ax3 = plt.subplot(223, projection="polar")rou3 = a * np.sin(6 * theta)ax3.plot(theta, rou3, "b")# 阿基米德螺线theta2 = np.arange(0, 10 * np.pi, 0.01)ax4 = plt.subplot(224, projection="polar")a, b = 1, 2rou4 = a + b * theta2ax4.plot(theta2, rou4, "m")plt.savefig("./figure/参数方程曲线.png")plt.show()
结果
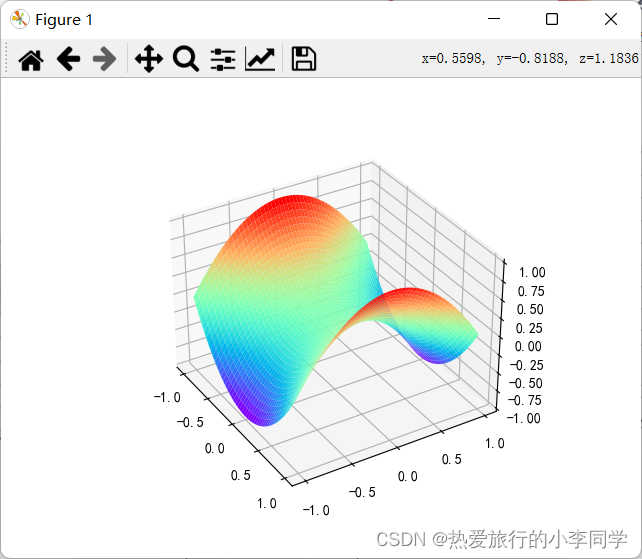
5 3D图(球、马鞍面)
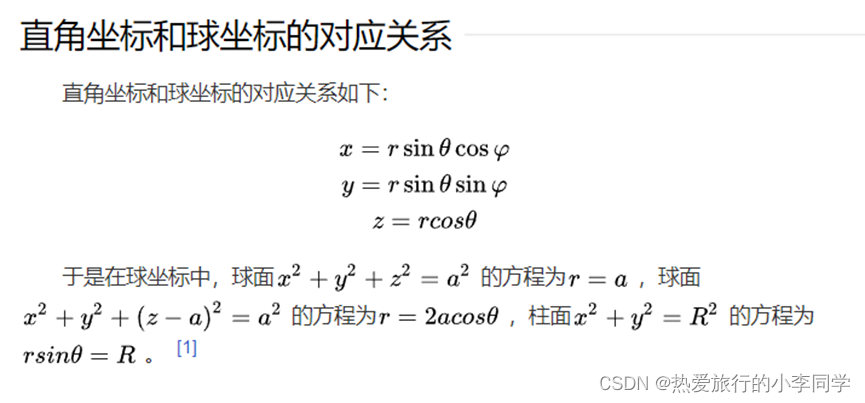
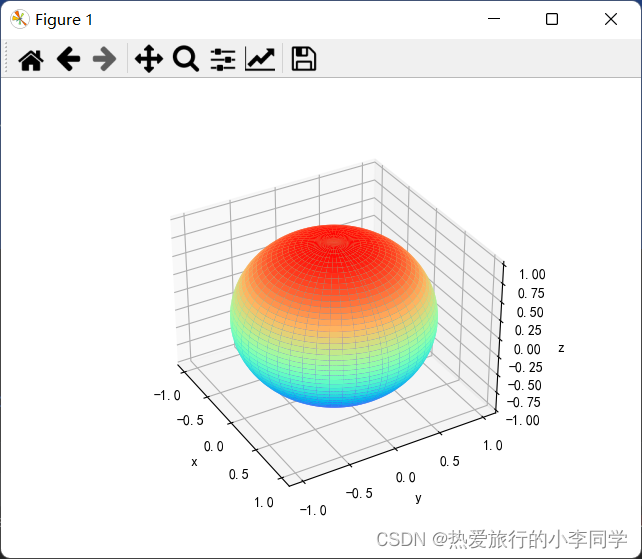
注意:球的绘制要先用球坐标的方式转换,否则只能得到球的一部分表面
球的极坐标公式:
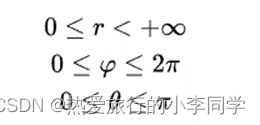
其中
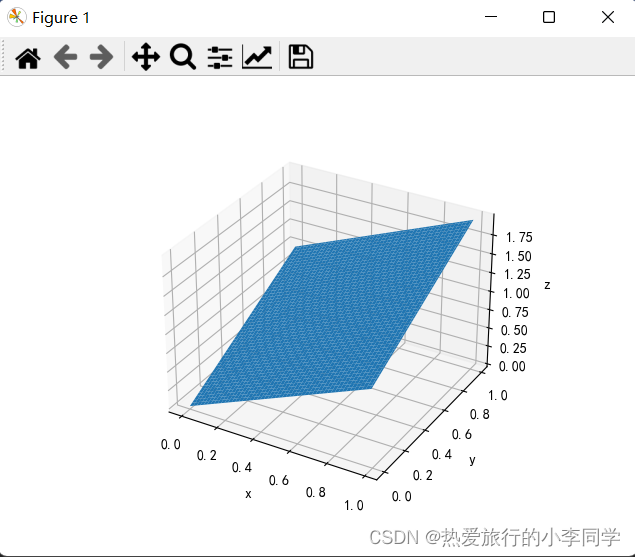
def test05():# z = x + yax1 = plt.figure().add_subplot(projection="3d")x1 = np.arange(0, 1, 0.01)y1 = np.arange(0, 1, 0.01)x1, y1 = np.meshgrid(x1, y1)z1 = x1 + y1ax1.plot_surface(x1, y1, z1)ax1.set_xlabel("x")ax1.set_ylabel("y")ax1.set_zlabel("z")plt.show()# 球 使用球极坐标系ax2 = plt.figure().add_subplot(projection='3d')theta = np.linspace(0, np.pi, 100)phi = np.linspace(0, np.pi * 2, 100)theta, phi = np.meshgrid(theta, phi)r = 1x2 = r * np.sin(theta) * np.cos(phi)y2 = r * np.sin(theta) * np.sin(phi)z2 = r * np.cos(theta)ax2.plot_surface(x2, y2, z2, cmap="rainbow")ax2.set_xlabel("x")ax2.set_ylabel("y")ax2.set_zlabel("z")plt.show()# 马鞍面 z = x ^ 2 / a ^ 2 - y ^ 2 / b ^ 2ax3 = plt.figure().add_subplot(projection='3d')x3 = np.arange(-1, 1, 0.01)y3 = np.arange(-1, 1, 0.01)x3, y3 = np.meshgrid(x3, y3)a, b = 1, 1z3 = x3 ** 2 / a - y3 ** 2 / bax3.plot_surface(x3, y3, z3, cmap="rainbow")ax2.set_xlabel("x")ax2.set_ylabel("y")ax2.set_zlabel("z")plt.show()
结果
z=x+y
球
马鞍面
