1. 模块的导入
做仿真,numpy应该都知道
arlpy是水声通信工具箱,不仅可以产生信道的冲激响应,还有一些通信相关的函数
bokeh是用来画图的,配合jupyter notebook使用很爽!!(Matplotlib是常用的绘图工具包,个人感觉bokeh更舒服…)
# 数组运算工具包
import numpy as np
# 水声通信工具包
import arlpy.uwa as au
import arlpy.uwapm as aup
import arlpy.comms as ac
# 绘图工具包
from bokeh.plotting import show, figure
from bokeh.layouts import gridplot
from bokeh.io import output_notebook
output_notebook()
import warnings
warnings.filterwarnings('ignore')
2. 准备工作
2.1 水声信道的冲激响应
如何设置参数,得到冲激响应、衰减、时延等等在arlpy的官方文档中,都有介绍,可自行查阅
https://arlpy.readthedocs.io/en/latest/
# 设置环境参数
env = aup.create_env2d()
env['bottom_soundspeed'] = 1800
env['bottom_absorption'] = 0
env['depth'] = 100
env['max_angle'] = 30
env['min_angle'] = -30
env['frequency'] = 100
env['nbeams'] = 10
env['tx_depth'] = 20
env['rx_depth'] = 20
env['rx_range'] = 1000
# 假设声速在浅海环境下是递增的
sound_speed = np.zeros(shape=[6, 2])
for i in range(6):sound_speed[i, 0] = 20 * isound_speed[i, 1] = au.soundspeed(depth=20 * i)
env['soundspeed'] = sound_speedarrivals_sd = aup.compute_arrivals(env) # 声线到达的时间
delay_sd = min(arrivals_sd.time_of_arrival) # 端到端的传输时延
multidelay_sd = max(arrivals_sd.time_of_arrival) - \min(arrivals_sd.time_of_arrival) # 多径时延
fs = 100  # 信道的采样频率
cir_sd = aup.arrivals_to_impulse_response(arrivals_sd, fs=fs)
cir_sd = np.real(cir_sd)
cir_sd[(cir_sd < 0)] *= -1 # 信道的冲激响应
2.2 归一化及均衡代码
考虑到信道衰减比较大,在对信号进行处理的时候,需要考虑归一化的问题
def nor(x):'''param x: 带归一化信号return: 已归一化信号'''alpha = np.sum(np.square(x))/x.sizereturn x/np.sqrt(alpha)def equlization(sig_input, sig_expect, mu, M):'''param sig_input: 输入待均衡信号param sig_expect: 期望信号param mu: 均衡器步长param M: 均衡器长度return: (均衡后信号, 均方误差)'''n = sig_expect.sizeW = np.zeros(M)error = np.zeros(n)sig_output = np.zeros(n)if sig_input.size < n + M:sig_input = np.pad(sig_input, (0, n+M-sig_input.size))for i in range(n):input1 = sig_input[i:i+M]output = np.dot(W.T, input1)sig_output[i] = outputerror[i] = sig_expect[i] - outputW = W + mu * error[i] * input1J = np.square(error)return sig_output, J
3. 仿真
仿真的具体参数在调试时,有稍微改动,可自行调试
3.1 发射端
发射端使用了根升余弦滤波器进行滤波
N = 10000  # 数据点数
span = 4  # 升余弦滤波器范围
sps = 6  # 每符号采样率
rrc = ac.rcosfir(beta=0.5, sps=sps, span=span)
delay_rrc = int((rrc.size-1)/2)  # 经过滤波器之后,需要考虑滤波器的延迟sig_ori = ac.random_data(size=N, m=2) * 2 - 1
sig_exp = ac.upconvert(x=sig_ori, sps=sps, fs=0, fc=0)
sig_exp = nor(np.real(sig_exp))  # 使用ac.upconvert产生虚部为0的部分,为方便发图,取其实部
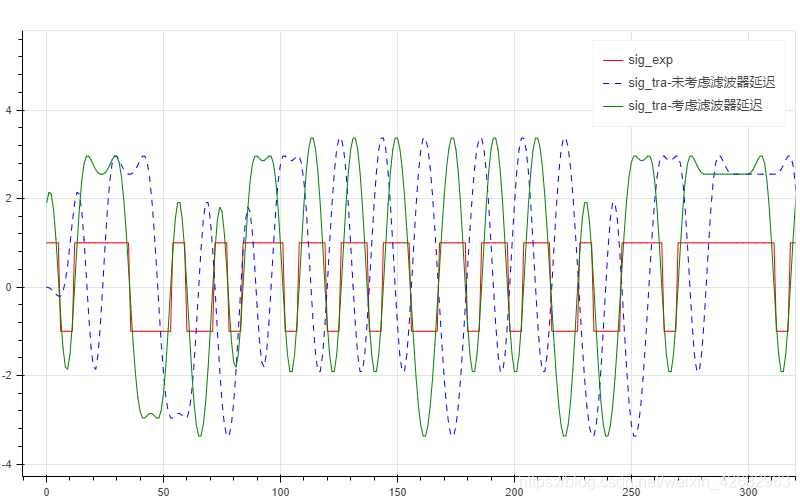
sig_tra = np.convolve(sig_exp, rrc)  # 发射滤波器的输出信号TOOLS = 'pan,box_zoom,xwheel_zoom,ywheel_zoom,crosshair,save,reset'  # 使用bokeh绘图时使用的交互工具
p1 = figure(tools=TOOLS, plot_width=800, plot_height=500,toolbar_location='above', toolbar_sticky=False)
p1.line(np.linspace(0, sig_exp.size-1, sig_exp.size),np.real(sig_exp), legend='sig_exp', line_color='red')
p1.line(np.linspace(0, sig_tra.size-1, sig_tra.size),np.real(sig_tra), legend='sig_tra-未考虑滤波器延迟',line_color='blue', line_dash='dashed')
p1.line(np.linspace(0, sig_tra.size-1-delay_rrc, sig_tra.size-delay_rrc),np.real(sig_tra[delay_rrc:]), legend='sig_tra-考虑滤波器延迟',line_color='green')
show(p1)

这个图是可以动的,横着拉,竖着拉,局部放大…(下面的图也是…)
3.2 多径信道
这里设置了三个不同的采样频率分别为100Hz,500Hz,1000Hz,得到的信道抽头个数分别为12,56,110,由仿真图可观察到采样频率越大,失真越严重
# fs = 100,信道长度为12
sig_isi1 = np.convolve(cir_sd, sig_tra)
sig_isi1 = nor(sig_isi1)p2 = figure(tools=TOOLS, plot_width=800, plot_height=300, title='信道长度为12',toolbar_location='left', toolbar_sticky=False)
p2.line(np.linspace(0, sig_exp.size-1, sig_exp.size),np.real(sig_exp), legend='sig_exp', line_color='red')
p2.line(np.linspace(0, sig_isi1.size-1-delay_rrc, sig_isi1.size-delay_rrc),np.real(sig_isi1[delay_rrc:]), legend='sig_isi-考虑滤波器延迟',line_color='green')fs = 500  # 信道的采样频率
cir_sd2 = aup.arrivals_to_impulse_response(arrivals_sd, fs=fs)
cir_sd2 = np.real(cir_sd2)
cir_sd2[(cir_sd2 < 0)] *= -1  # 信道的冲激响应
sig_isi2 = np.convolve(cir_sd2, sig_tra)
sig_isi2 = nor(sig_isi2)
p3 = figure(tools=TOOLS, plot_width=800, plot_height=300, title='信道长度为56',toolbar_location='left', toolbar_sticky=False)
p3.line(np.linspace(0, sig_exp.size-1, sig_exp.size),np.real(sig_exp), legend='sig_exp', line_color='red')
p3.line(np.linspace(0, sig_isi2.size-1-delay_rrc, sig_isi2.size-delay_rrc),np.real(sig_isi2[delay_rrc:]), legend='sig_isi-考虑滤波器延迟',line_color='green')fs = 1000  # 信道的采样频率
cir_sd3 = aup.arrivals_to_impulse_response(arrivals_sd, fs=fs)
cir_sd3 = np.real(cir_sd3)
cir_sd3[(cir_sd3 < 0)] *= -1  # 信道的冲激响应
sig_isi3 = np.convolve(cir_sd3, sig_tra)
sig_isi3 = nor(sig_isi3)
p4 = figure(tools=TOOLS, plot_width=800, plot_height=300, title='信道长度为110',toolbar_location='left', toolbar_sticky=False)
p4.line(np.linspace(0, sig_exp.size-1, sig_exp.size),np.real(sig_exp), legend='sig_exp', line_color='red')
p4.line(np.linspace(0, sig_isi3.size-1-delay_rrc, sig_isi3.size-delay_rrc),np.real(sig_isi3[delay_rrc:]), legend='sig_isi-考虑滤波器延迟',line_color='green')
show(p2)
show(p3)
show(p4)


为了方便观察,使用抽头长度为12的信道
3.3 接收端
接收方式:(做以下两种方式的测试)
(1)先滤波再均衡
(2)先均衡再滤波
M = int(cir_sd3.size)
mu = 0.0001
sig_rec1 = np.convolve(rrc, sig_isi3)
[sig_equ1, temp] = equlization(sig_rec1[delay_rrc*2:], sig_exp, mu, M)p5 = figure(tools=TOOLS, plot_width=800, plot_height=300,toolbar_location='above', toolbar_sticky=False)
p5.line(np.linspace(0, sig_exp.size-1, sig_exp.size),np.real(sig_exp), legend='sig_exp', line_color='red')
p5.line(np.linspace(0, sig_equ1.size-1, sig_equ1.size),np.real(sig_equ1), legend='sig-先滤波再均衡',line_color='green')[sig_equ2, temp] = equlization(sig_isi3[delay_rrc:], sig_exp, mu, M)
sig_rec2 = np.convolve(sig_equ2, rrc)[delay_rrc:]
p5.line(np.linspace(0, sig_rec2.size-1, sig_rec2.size),np.real(sig_rec2), legend='sig-先均衡再滤波',line_color='blue')
show(p5)

3.4 判决并得到误码率
3.4 判决并得到误码率
1、只与原序列进行比较判决
2、在下采样之前就进行判决
def decision1(sig_ori, sig_res, sps):err = 0for i in range(sig_ori.size):if sig_res[i*sps+int(sps/2)] < 0:temp = -1else:temp = 1if temp != sig_ori[i]:err += 1return errdef decision2(sig_exp,sig_res):err = 0for i in range(sig_exp.size):if sig_res[i] < 0:temp = -1else:temp = 1if temp != sig_exp[i]:err  += 1return errprint(decision1(sig_ori,sig_equ1,sps)/N,decision1(sig_ori,sig_rec2,sps)/N)
print(decision2(sig_exp,sig_equ1)/N/sps,decision2(sig_ori,sig_rec2)/N/sps)
0.0298 0.0699
1.0 0.08368333333333333
在不同的采样频率下,得到的信道抽头个数就不同,具体均衡器的步长需要进一步设定。
经测试,调整步长的之后,误码率的结果还看的过去(比上面好看!)…

第一次发博,关于Python、仿真或者其他地方有不好的地方,请批评我!!!


