目录
💥1 概述
📚2 运行结果
🎉3 参考文献
👨💻4 Matlab代码
💥1 概述
RRT是Steven M. LaValle和James J. Kuffner Jr.提出的一种通过随机构建Space Filling Tree实现对非凸高维空间快速搜索的算法。该算法可以很容易的处理包含障碍物和差分运动约束的场景,因而广泛的被应用在各种机器人的运动规划场景中。
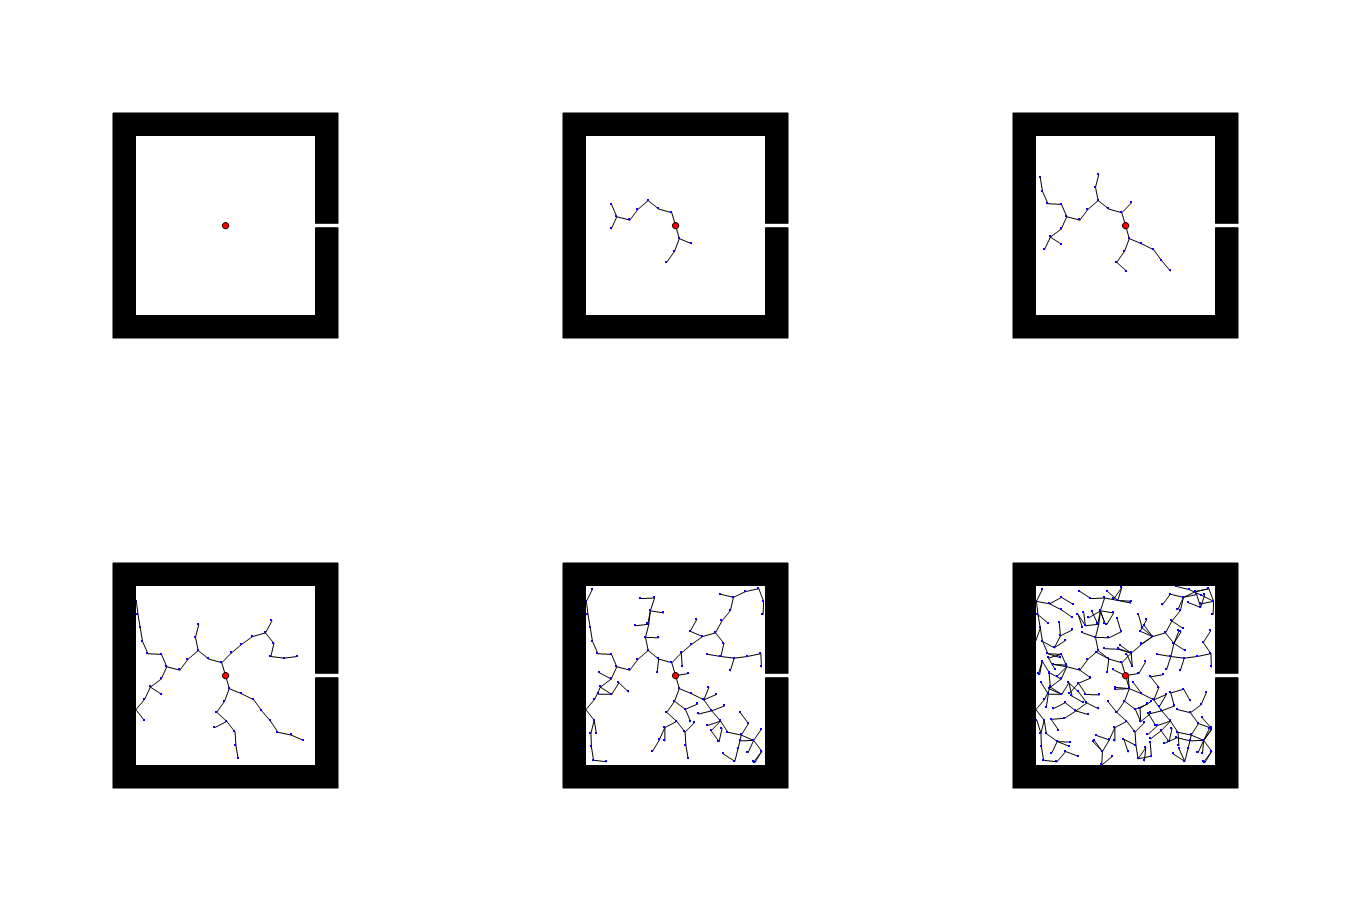
RRT 的一个弱点是难以在有狭窄通道的环境找到路径。因为狭窄通道面积小,被碰到的概率低,找到路径需要的时间要看运气了。下图展示的例子是 RRT 应对一个人为制作的很短的狭窄通道,有时RRT很快就找到了出路,有时则一直被困在障碍物里面。
📚2 运行结果


🎉3 参考文献
[1]樵永锋,王瀚鑫,周淑文,杨贵军.改进RRT算法的无人驾驶车辆路径规划研究[J/OL].机械设计与制造:1-8[2022-12-06].DOI:10.19356/j.cnki.1001-3997.20221103.046.
👨💻4 Matlab代码
主函数部分代码:
clc
clear all
close all
clf
%% ----------- Simulation Setup -----------%
simulation = Simulation;
setSim(simulation, 0.2, 0, 200, 0.5);
%% ----------- Environment Setup ------------%
environment = Environment;
setBound(environment,[0 200 0 200]);
dispField(environment);
%% ----------- Vehicle Setup ------------%
vehicle = Vehicle;
setTalos(vehicle);
setInitialVehicleState(vehicle,[50 50 0.25*pi 0],[0 0 0 0],[0 0 0 0]);
dispVehicle(vehicle);
%% ------------ Look Ahead Point Setup --------------%
control = Control;
setLookAheadDistance(control,vehicle);
setControlTalos(control);
%% --------------- PID Setup ---------------%
setPID(control,0.2,0.04,0);
%% --------------- Algorithm Proceeding ---------------%
%
% evaluateSim(simulation, environment, vehicle, control)
%% ------------ RRT Test -------------%
rrtPlanner = RRTPlanner;
setRRT(rrtPlanner,vehicle)
TreeExpansion(rrtPlanner,environment,vehicle, control,simulation)
%% --------------- Result Plotting ----------------%
% PlotVehicleTrajectory(vehicle);
dt = simulation.deltaT;
Speed = vehicle.hisSpeed;
Vel = vehicle.hisVel(:,1:2);
for i=1:length(vehicle.hisSpeed); VelCar(i) = norm(Vel(i,:));end
VelCmd = control.hisRefVel;
Time=0:dt:(length(vehicle.hisSpeed)-1)*dt;
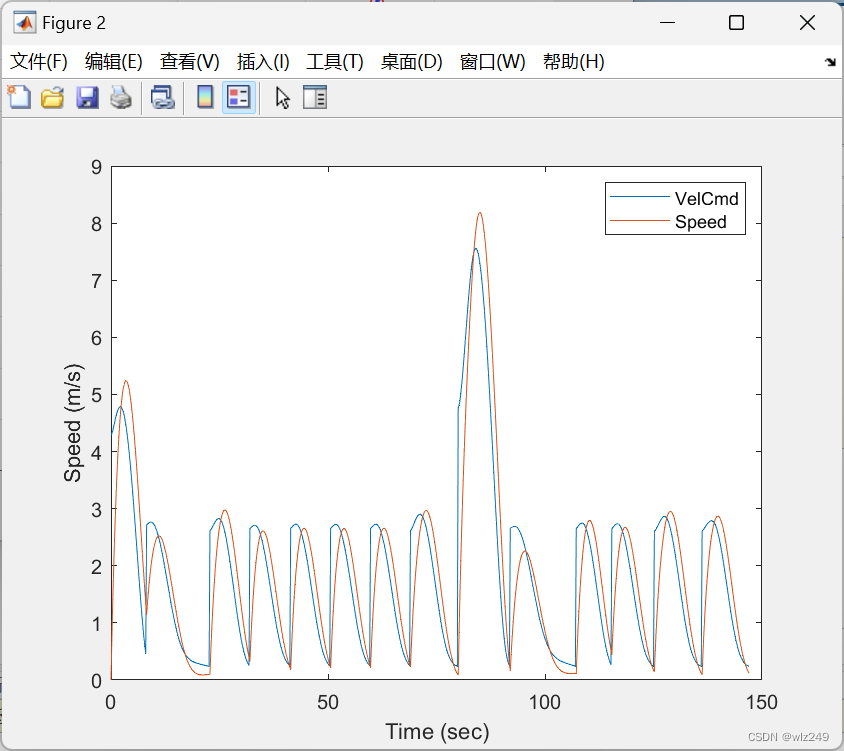
figure(2)
plot(Time,VelCmd,Time,Speed);
legend('VelCmd','Speed');xlabel('Time (sec)');ylabel('Speed (m/s)');
% figure(3)
% plot(Time,Speed,Time,VelCar);
% legend('Speed','VelCar');xlabel('Time (sec)');ylabel('Speed (m/s)');
% figure(3);plot(vehicle.hisPos(:,1),vehicle.hisPos(:,2),'r');axis([-100 100 -100 100])
% figure(2);plot(Time,Vel,Time,VelCmd);legend('Vel','VelCmd');xlabel('Time (sec)');ylabel('Speed (m/s)');
% figure(3);plot(Time,Vel,Time,Speed);legend('Vel','Speed');xlabel('Time (sec)');ylabel('Speed (m/s)');


