1.后端基于nodejs,通过http模块定期向后端接口请求数据,组装成geojson。通过websocket向客户端定期连续发送数据。
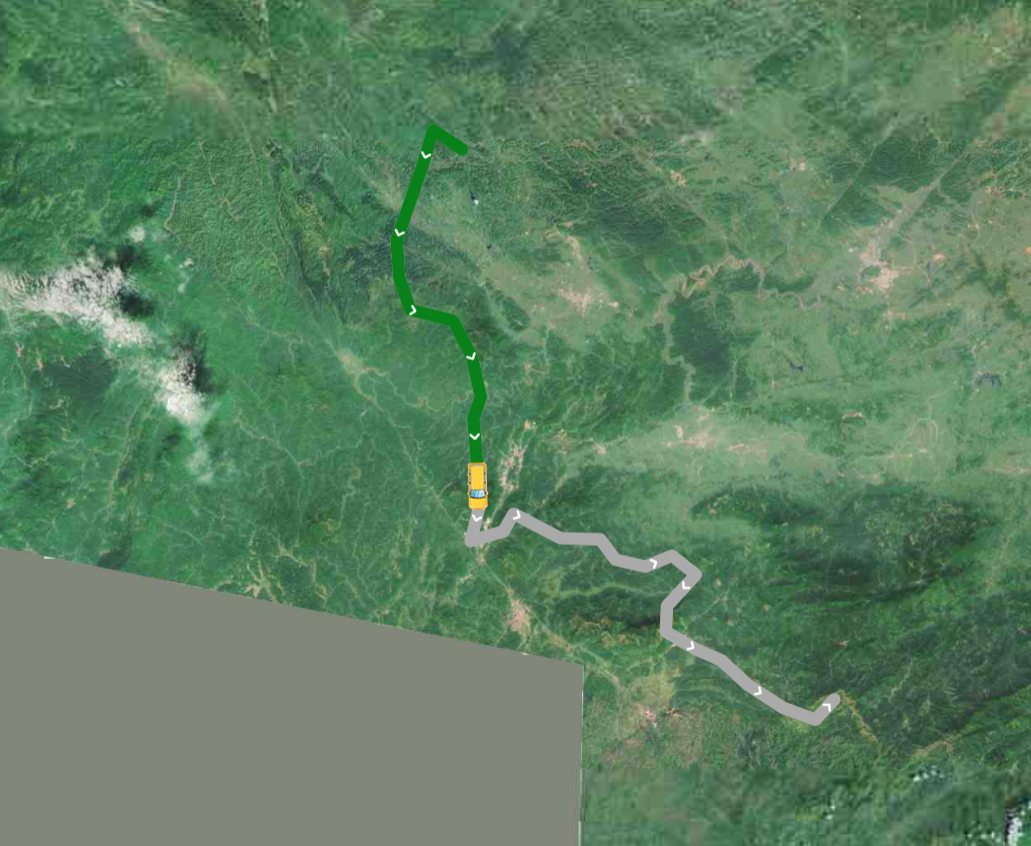
2.前端通过mapbox-gl.js 展示实时轨迹。
具体代码如下:
ws_server.js
const path = require('path');
const fs = require('fs');
const http = require('http')// 引入websocket
var ws = require("nodejs-websocket");// 构造geojson对象,features为空列表
var myGeoJson = {"type": "FeatureCollection","name": "poi","crs": { "type": "name", "properties": { "name": "urn:ogc:def:crs:OGC:1.3:CRS84" } },"features": []
};const sdata = JSON.stringify({'msg': '你好世界'
});const token = 'm2yYidtbkCb7Y63aws';
const options = {hostname: '你的接口IP',port: 端口号,path: '/1/3/3',method: 'POST',headers: {'Content-Type': 'application/json','Connection': 'keep-alive','Authorization': token}
}var res_data = '' ;
var res_data_obj = '' ;
function getAISdata(){const req = http.request(options, res => {//console.log(res.statusCode)  // res.on('data', d => {//   process.stdout.write(d);      // });// called when a data chunk is received.console.log('此次请求开始时间:'+Date());res.on('data', (chunk) => {res_data += chunk;//process.stdout.write(chunk); });// called when the complete response is received.res.on('end', () => {// 字符串转换为jsonres_data_obj = '';//console.log(res_data_obj);res_data_obj = JSON.parse(res_data);res_data = '';myGeoJson.features = [];console.log( '数据的长度:'+ res_data_obj.data.length);        for (i = 0 ;i < res_data_obj.data.length; i++){// 把"geometry": "POINT(113.431638 23.073267)", 转换为floatconst x = parseFloat(res_data_obj.data[i].geometry.split(" ")[0].split("(")[1]);const y = parseFloat(res_data_obj.data[i].geometry.split(" ")[1].split(")")[0]); myGeoJson.features.push({"type": "Feature", "properties": { "en_name": res_data_obj.data[i].en_name,                   "time": res_data_obj.data[i].time,"trding": res_data_obj.data[i].trding }, "geometry": { "type": "Point", "coordinates": [ x, y ] } });};//     console.log( '数据转换后的记录长度:' + myGeoJson.features.length);});});req.on('error', error => {console.error(error);});req.write(sdata);req.end();
};// 定期请求数据,2.5分钟向接口申请数据
setInterval(getAISdata , 160110)// Scream server example: "hi" -> "HI!!!"
var server = ws.createServer(function (conn) {console.log("新的连接到来!")function sendAISdata(){conn.sendText(JSON.stringify(myGeoJson));};conn.on("text", function (str) {console.log("接收到客户端信息: "+str)//conn.sendText(str.toUpperCase()+"!!!")//每隔N秒 服务端向浏览器 推送消息setInterval(sendAISdata,10000);        });conn.on("close", function (code, reason) {console.log("连接关闭")});conn.on("error", function (code, reason) {console.log("异常关闭")});
}).listen(8001)
index.js
import mapboxgl from 'mapbox-gl';
import $ from "jquery";
import MapboxGeocoder from '@mapbox/mapbox-gl-geocoder';
import { MapboxStyleSwitcherControl } from "mapbox-gl-style-switcher";
import RulerControl from 'mapbox-gl-controls/lib/ruler';
//import MapboxDraw from "@mapbox/mapbox-gl-draw";
//import '@mapbox/mapbox-gl-draw/dist/mapbox-gl-draw.css';
import geojsonvt from 'geojson-vt';
import * as turf from '@turf/turf';
import * as d3 from 'd3';
import 'mapbox-gl/dist/mapbox-gl.css';
import '@mapbox/mapbox-gl-geocoder/dist/mapbox-gl-geocoder.css';
import '../css/myTheme.css';var MapboxLanguage = require('@mapbox/mapbox-gl-language');var isSupported = require('@mapbox/mapbox-gl-supported')();mapboxgl.accessToken = 'pk.eyrZ3V7HEFSLA';if (isSupported){var map = new mapboxgl.Map({container: 'map',style: 'mapbox://styles/mapbox/streets-v11',//style: 'mapbox://styles/mapbox-map-design/ckhqrf2tz0dt119ny6azh975y',center: [113.354, 23.3478], // starting position [lng, lat]zoom: 9,maxZoom:20.99,antialias:true,  //抗锯齿,消耗性能keyboard:false,   // 关闭键盘快捷键crossSourceCollisions:true,      //是否进行跨图层符号的碰撞检测。hash:true,                     //显示url的锚attributionControl:false,});
} else {alert("你的浏览器不支持webGL!");
};var language = new MapboxLanguage({defaultLanguage: 'zh-Hans'
});
map.addControl(language);// 构造空的geojson 对象
var mygeojson = {};map.on('load', function() {if(window.WebSocket){var ws = new WebSocket('ws://192.168.8.97:8001');ws.onopen = function(e){console.log("连接服务器成功");// 向服务器发送消息ws.send("my name is aganliang . what`s your name?");};ws.onclose = function(e){console.log("服务器关闭");};ws.onerror = function(){console.log("连接出错");};// 接收服务器的消息ws.onmessage = function(e){//let message = e.data;	mygeojson = JSON.parse(e.data);$('#ais_ships').html(Date().toLocaleString() + '<br/>'+ '当前总数:'+mygeojson.features.length);console.log('总数:'+mygeojson.features.length);//console.log(mygeojson);map.getSource('ships').setData(mygeojson);		}   };$('#console_ships').show();$('#yw_ships_legend').show();map.addSource('dem', {'type': 'raster-dem','url': 'mapbox://mapbox.mapbox-terrain-dem-v1'});map.addLayer({'id': 'hillshading','source': 'dem','type': 'hillshade'// insert below waterway-river-canal-shadow;// where hillshading sits in the Mapbox Outdoors style});map.addSource('ships', {'type': 'geojson','data': mygeojson});const colors = ['#007b43', '#f96d00', '#1047A9', '#FF0000','#C437D3','#99CC00'];	map.addLayer({'id': 'ships','type': 'circle','source': 'ships','paint': {'circle-radius': ['interpolate',['linear'],['zoom'],8, ['case',['boolean',['feature-state','hover'],false],3,2],10, ['case',['boolean',['feature-state','hover'],false],6,3],16, ['case',['boolean',['feature-state','hover'],false],14,10],18, ['case',['boolean',['feature-state','hover'],false],34,30],22, ['case',['boolean',['feature-state','hover'],false],64,60]],'circle-color': ['match',['get','type'],0,colors[0],1,colors[1],2,colors[2],3,colors[3],4,colors[4],            	colors[5]],'circle-stroke-width': 0.4,'circle-stroke-color': '#999','circle-stroke-opacity':['case',['boolean',['feature-state','hover'],false],1,0.2],}});let popup = new mapboxgl.Popup({maxWidth:'900px',closeButton: false,closeOnClick: false});map.on('mouseenter', 'ships', function(e) {var coordinates = e.features[0].geometry.coordinates.slice();var en_name = e.features[0].properties.en_name;			var time = e.features[0].properties.time;map.getCanvas().style.cursor = 'pointer';			 // Ensure that if the map is zoomed out such that// multiple copies of the feature are visible, the// popup appears over the copy being pointed to.while (Math.abs(e.lngLat.lng - coordinates[0]) > 180) {coordinates[0] += e.lngLat.lng > coordinates[0] ? 360 : -360;}var description = '<h3>'+'<strong>'+'详情'+'</strong>'+'</h3>'		+'<strong>'+'英文名称:'+'</strong>'+ en_name + '<br/>'		+'<strong>'+'更新时间:'+'</strong>'+ time + '<br/>' ; popup.setLngLat(coordinates).setHTML(description).addTo(map);});	 	 map.on('mouseleave', 'ships', function() {map.getCanvas().style.cursor = '';popup.remove();});});
index.html
<!DOCTYPE html>
<html>
<head>
<meta charset='utf-8' />
<title>动态数据</title>
<meta name='viewport' content='initial-scale=1,maximum-scale=1,user-scalable=no' /><style>
body { margin:0; padding:0; }
#map { position:absolute; top:0; bottom:0; width:100%; }
</style>
</head>
<body>
<div id='map'></div>
<div class="console" id="console_ships" style="height: 90px; display: none;"><fieldset><h1 id="ships"></h1></fieldset>
</div>
<div class="map-legend"><div class="map-legend-inner" id="map-legend-inner"><ul id="legend-lists"></ul>    	<div id="yw_ships_legend" style="display: none;"><h4>类别</h4><div><span style="background-color: #007b43"></span>0</div><div><span style="background-color: #f96d00"></span>1</div><div><span style="background-color: #1047A9"></span>2</div><div><span style="background-color: #FF0000"></span>3</div><div><span style="background-color: #C437D3"></span>4</div><div><span style="background-color: #99CC00"></span>5</div><p>---------------------------</p></div></div>
</div></body>
</html>


