- 本示例通过spring boot自带的监控信息暴露出来,然后将数据收集到prometheus中,最后通过grafana的dashboard导入模板进行可视化。
- 本示例分为四个部分,即prometheus、grafana部署、springboot示例和最后的集成。
- 说明:本示例中的部署环境没有要求,即应用部署的机器根据实际情况而定,只要网络连通即可。
关于java应用的监控本系列有文章如下:
【运维监控】influxdb 2.0+telegraf 监控tomcat 8.5运行情况
【运维监控】influxdb 2.0+grafana 监控java 虚拟机以及方法耗时情况
【运维监控】Prometheus+grafana监控tomcat运行情况
【运维监控】Prometheus+grafana监控spring boot 3运行情况
prometheus_10">一、prometheus
参考:【运维监控】prometheus+node exporter+grafana 监控linux机器运行情况关于prometheus的部署。
grafana_12">二、grafana
参考:【运维监控】prometheus+node exporter+grafana 监控linux机器运行情况 关于grafana的部署。
三、创建java应用及配置
本处使用的是一个简单spring boot 3的应用,对外开启2个restful接口,同时引入prometheus的包。
1、pom.xml
仅列出引入的版本、必须的依赖和编译器(根据你自己的环境而定)。
<properties><maven.compiler.source>17</maven.compiler.source><maven.compiler.target>17</maven.compiler.target><project.build.sourceEncoding>UTF-8</project.build.sourceEncoding>
</properties>
<parent><groupId>org.springframework.boot</groupId><artifactId>spring-boot-starter-parent</artifactId><version>3.0.0</version>
</parent><dependencies><dependency><groupId>org.springframework.boot</groupId><artifactId>spring-boot-starter-web</artifactId></dependency><dependency><groupId>org.projectlombok</groupId><artifactId>lombok</artifactId><scope>provided</scope></dependency><dependency><groupId>org.springframework.boot</groupId><artifactId>spring-boot-starter-actuator</artifactId></dependency><dependency><groupId>io.micrometer</groupId><artifactId>micrometer-registry-prometheus</artifactId><version>1.12.5</version></dependency>
</dependencies>
2、application.properties
仅列出和本示例有关的内容,其他忽略或默认。
management.endpoints.web.exposure.include=*
management.endpoint.prometheus.enabled=true
3、java 类
App.java
package com.win;import org.springframework.boot.SpringApplication;
import org.springframework.boot.autoconfigure.SpringBootApplication;@SpringBootApplication
public class App {//url/abc.jsonpublic static void main(String[] args) {SpringApplication.run(App.class,args);}
}
TestController.java
package com.win.test;import lombok.extern.slf4j.Slf4j;
import org.springframework.web.bind.annotation.*;import java.sql.Date;
import java.text.SimpleDateFormat;@Slf4j
@RestController
@RequestMapping("/test")
@CrossOrigin
public class TestController {SimpleDateFormat dateFormat = new SimpleDateFormat("yyyy-MM-dd HH:mm:ss-SSSS");// http://localhost:8080/test/example// http://localhost:8080/test/example?message=test@GetMapping("/example")public String completion(@RequestParam(value = "message", defaultValue = "讲个笑话") String message) {try {Thread.sleep(100);} catch (InterruptedException e) {throw new RuntimeException(e);}log.info("当前时间:{},方法名称:{}", dateFormat.format(new Date(System.currentTimeMillis())), new Object() {}.getClass().getEnclosingMethod().getName());return message;}// http://localhost:8080/test/example/test.json?message=test@GetMapping("/example/test.json")public String completion2(@RequestParam(value = "message", defaultValue = "讲个笑话") String message) {try {Thread.sleep(100);} catch (InterruptedException e) {throw new RuntimeException(e);}log.info("当前时间:{},方法名称:{}", dateFormat.format(new Date(System.currentTimeMillis())), new Object() {}.getClass().getEnclosingMethod().getName());return message;}
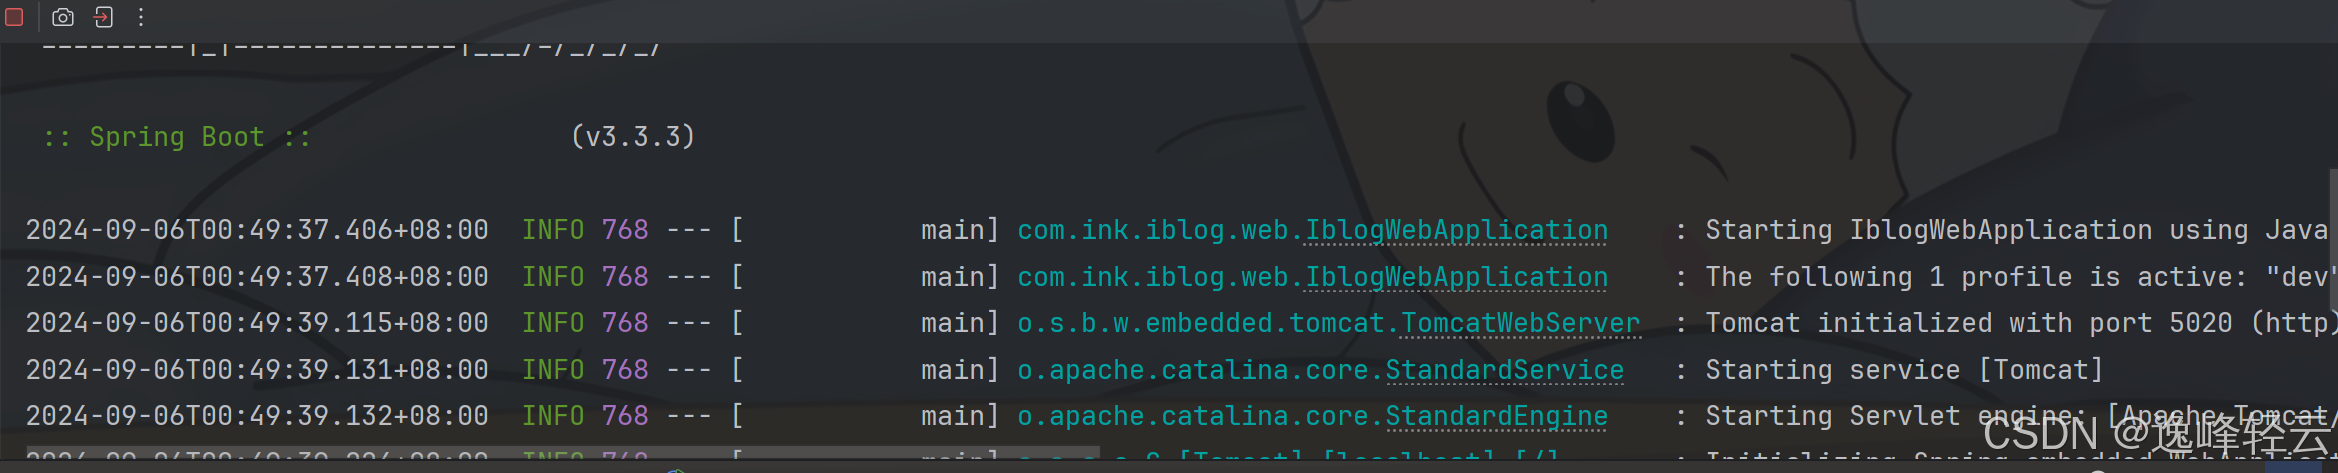
}4、验证
启动应用,查看http://localhost:8080/actuator/prometheus链接是否可获取到相关监控的信息即可。出现如下图即表示完成。

grafanaprometheusspringboot_130">四、grafana集成prometheus监控springboot应用
prometheus_131">1、修改prometheus配置及重启
在prometheus的配置文件(prometheus.yml)中添加如下配置部分
- job_name: "springboot_node_3.105"metrics_path: "/actuator/prometheus"# metrics_path defaults to '/metrics'# scheme defaults to 'http'.static_configs:- targets: ["192.168.3.105:8080"]
重启prometheus后,并验证是否收集到监控信息。
查看Prometheus是否监控到运行的spring boot应用如下图。

查看prometheus是否收集到监控信息如下图(查询jvm_memory_max_bytes)

grafana_148">2、导入grafana模板
导入过程不再赘述,参考文章:【运维监控】Prometheus+grafana监控tomcat8.5 运行情况
本示例导入的模板ID是12900和21319。
3、验证
以上所涉及的服务均能正常的运行,以及验证都通过。
本示例为了体现有更多的数据可验证,以便能更清楚的看到效果,建议自己多做一点接口的调用查看运行情况,否则不能直观的体现出监控的结果。


以上,就完成了grafana集成prometheus监控springboot应用。
至此,关于java应用的监控本系列有文章如下:
【运维监控】influxdb 2.0+telegraf 监控tomcat 8.5运行情况
【运维监控】influxdb 2.0+grafana 监控java 虚拟机以及方法耗时情况
【运维监控】Prometheus+grafana监控tomcat运行情况
【运维监控】Prometheus+grafana监控spring boot 3运行情况