GitHub - lgd8981289/imooc-visualization: https://www.bilibili.com/video/BV1yu411E7cm/?vd_source=391a8dc379e0da60c77490e3221f097a 课程源码
国内echarts镜像站:ISQQW.COM x ECharts 文档(国内同步镜像) - 配置项

基于vite和tailwindcss创建项目,使用js
pnpm create vite
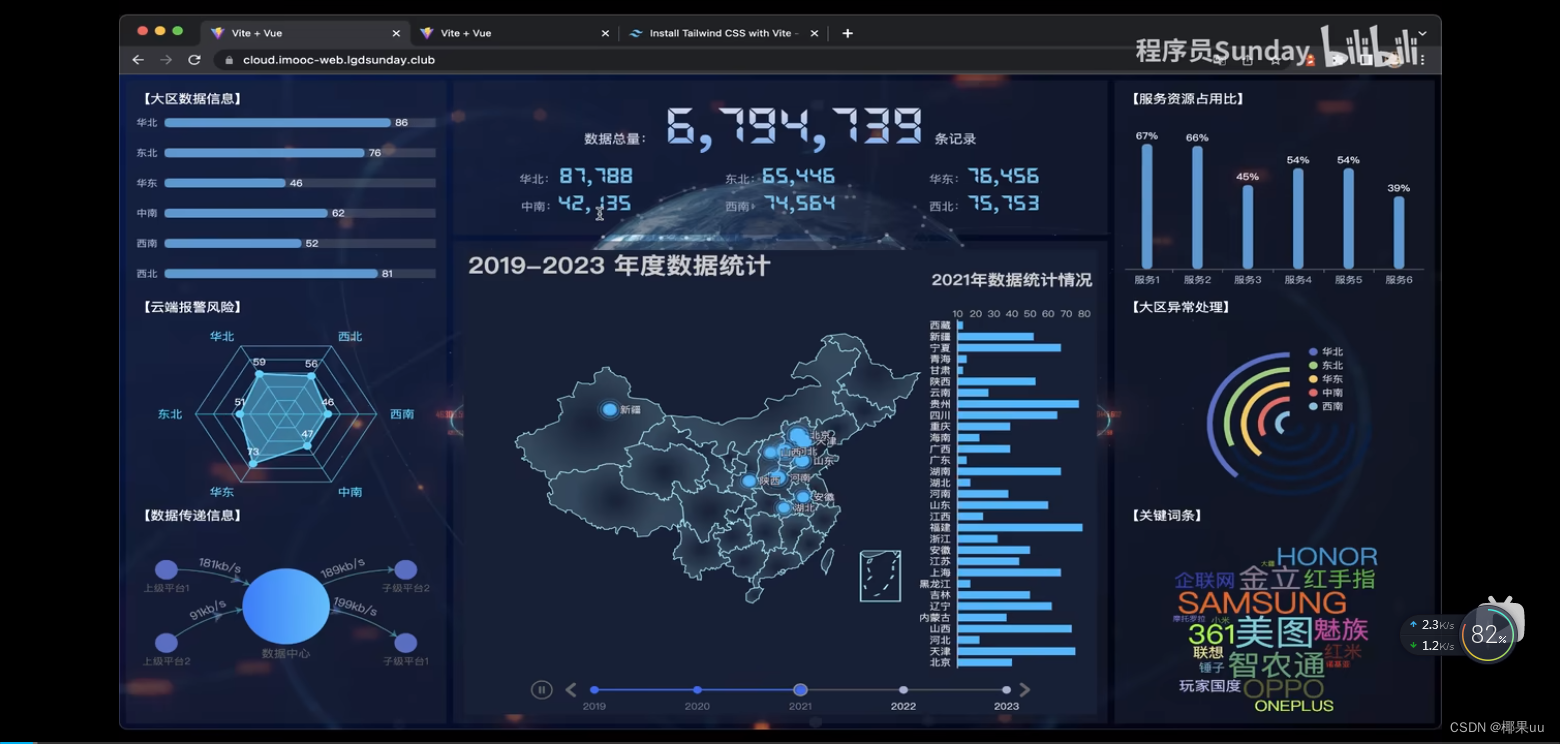
一、横向柱状图,竖向柱状图
echarts图表绘制分为三大步:

1.横向柱状图
HorizontalBar.vue
<template><div><div>【大区数据信息】</div><div ref="target" class="w-full h-full"></div></div>
</template><script setup>
import { onMounted, ref, watch } from 'vue'
import * as echarts from 'echarts'const props = defineProps({data: {type: Object,required: true}
})// 获取 dom 实例
const target = ref()// echarts 实例变量
let mChart = null
// 在 mounted 生命周期之后,实例化 echarts
onMounted(() => {mChart = echarts.init(target.value)// 渲染 echartsrenderChart()
})// 渲染图表
const renderChart = () => {const options = {// X 轴展示数据xAxis: {// 数据展示type: 'value',// 不显示轴show: false,// 最大值(防止触顶)max: function (value) {// 取整return parseInt(value.max * 1.2)}},// Y 轴展示选项yAxis: {type: 'category',// 根据根据服务端数据筛选data: props.data.regions.map((item) => item.name),// 反向展示inverse: true,// 不展示轴线axisLine: {show: false},// 不展示刻度axisTick: {show: false // 取消 Y 轴刻度},// 文字色值axisLabel: {color: '#9EB1C8'}},// echarts 网格绘制的位置,对应 上、右、下、左grid: {top: 0,right: 0,bottom: 0,left: 0,// 计算边距时,包含标签containLabel: true},// 柱形图核心配置series: [{// 图表类型type: 'bar',// 数据筛选data: props.data.regions.map((item) => ({name: item.name,value: item.value})),// 显示背景showBackground: true,// 背景色backgroundStyle: {color: 'rgba(180, 180, 180, 0.2)'},// 每个轴的样式itemStyle: {color: '#479AD3', // 设置柱子的颜色barBorderRadius: 5, // 设置柱子的圆角shadowColor: 'rgba(0, 0, 0, 0.3)', // 设置柱子的阴影颜色shadowBlur: 5 // 设置柱子的阴影模糊大小},// 轴宽度barWidth: 12,// 轴上的字体label: {show: true,// 设置标签位置为右侧position: 'right',textStyle: {// 设置标签文本颜色color: '#fff'}}}]}mChart.setOption(options)
}// 监听数据的变化,重新渲染图表
watch(() => props.data,() => {renderChart()}
)
</script><style lang="scss" scoped></style>
2.竖向柱状图
VerticalBar.vue
<template><div><div>【服务资源占用比】</div><div ref="target" class="w-full h-full"></div></div>
</template><script setup>
import { onMounted, ref, watch } from 'vue'
import * as echarts from 'echarts'const props = defineProps({data: {type: Object,required: true}
})const target = ref()
let mChart = null
onMounted(() => {mChart = echarts.init(target.value)renderChart()
})const renderChart = () => {const options = {// X 轴展示选项xAxis: {type: 'category',// 根据根据服务端数据筛选data: props.data.servers.map((item) => item.name),// 文字色值axisLabel: {color: '#9EB1C8'}},// Y 轴展示数据yAxis: {// 数据展示type: 'value',// 不显示轴show: false,// 最大值(防止触顶)max: function (value) {// 取整return parseInt(value.max * 1.2)}},// echarts 网格绘制的位置,对应 上、右、下、左grid: {top: 16,right: 0,bottom: 26,left: -26,// 计算边距时,包含标签containLabel: true},// 柱形图核心配置series: {// 柱形图type: 'bar',// 数据筛选data: props.data.servers.map((item) => ({name: item.name,value: item.value})),// 每个轴的样式itemStyle: {color: '#479AD3', // 设置柱子的颜色barBorderRadius: 5, // 设置柱子的圆角shadowColor: 'rgba(0, 0, 0, 0.3)', // 设置柱子的阴影颜色shadowBlur: 5 // 设置柱子的阴影模糊大小},// 柱子宽度barWidth: 12,// 文本label: {show: true,// 设置标签位置为顶部position: 'top',textStyle: {// 设置标签文本颜色color: '#fff'},// 设置数字为百分比formatter: '{c}%'}}}mChart.setOption(options)
}// 监听数据的变化,重新渲染图表
watch(()=>props.data,renderChart)
// watch(
// 	() => props.data,
// 	() => {
// 		renderChart()
// 	}
// )
</script><style lang="scss" scoped></style>
二、雷达图
RadarBar.vue
<template><div><div>【云端报警风险】</div><div ref="target" class="w-full h-full"></div></div>
</template><script setup>
import { onMounted, ref, watch } from 'vue'
import * as echarts from 'echarts'const props = defineProps({data: {type: Object,required: true}
})const target = ref()
let mChart = null
onMounted(() => {mChart = echarts.init(target.value)renderChart()
})const renderChart = () => {const options = {// 雷达图坐标系配置radar: {// 坐标系名name: {textStyle: {color: '#05D5FF',fontSize: 14}},// 雷达绘制类型。polygon 多边形shape: 'polygon',// 居中center: ['50%', '50%'],// 边境radius: '80%',// 开始的角度(可以避免绘制到边框之外)startAngle: 120,// 轴线配置axisLine: {lineStyle: {color: 'rgba(5, 213, 255, .8)'}},// 网格线配置splitLine: {show: true,lineStyle: {width: 1,color: 'rgba(5, 213, 255, .8)' // 设置网格的颜色}},// 指示器文字indicator: props.data.risks.map((item) => ({name: item.name,max: 100})),// 不展示拆分区域splitArea: {show: false}},// 坐标居中polar: {center: ['50%', '50%'], // 默认全局居中radius: '0%'},// 坐标角度angleAxis: {// 坐标轴刻度最小值min: 0,// 坐标轴分割间隔interval: 5,// 刻度增长逆时针clockwise: false,// 不显示坐标轴刻度axisTick: {show: false},// 不显示坐标轴文字axisLabel: {show: false},// 不显示坐标轴线axisLine: {show: false},// 不显示分割线splitLine: {show: false}},// 径向轴radiusAxis: {// 最小值min: 0,// 间隔interval: 20,// 不显示分割线splitLine: {show: true}},// 图表核心配置series: [{// 雷达图type: 'radar',// 拐点的样式,还可以取值'rect','angle'等symbol: 'circle',// 拐点的大小symbolSize: 10,// 折线拐点标志的样式itemStyle: {normal: {color: '#05D5FF'}},// 区域填充样式areaStyle: {normal: {color: '#05D5FF',opacity: 0.5}},// 线条样式lineStyle: {width: 2,color: '#05D5FF'},// 图形上的文本标签label: {normal: {show: true,formatter: (params) => {return params.value},color: '#fff'}},// 数据data: [{value: props.data.risks.map((item) => item.value)}]}]}mChart.setOption(options)
}// 监听数据的变化,重新渲染图表
watch(() => props.data,() => {renderChart()}
)
</script>
三、 异常处理双环形图
双环形图绘制原理:
* 1. 环形图通过饼图绘制。内外边距的距离减小,即为环形。环形中心点需要不断改变,否则会重叠
* 2. 环形图绘制分为 上层和底层 两部分。上层作为绘制进度,底层作为背景图
* 3. 依据 getSeriesData 生成对应的 上层和底层 series 数据,进行渲染
<template><div><div>【大区异常处理】</div><div ref="target" class="w-full h-full"></div></div>
</template><script setup>
import { onMounted, ref, watch } from 'vue'
import * as echarts from 'echarts'const props = defineProps({data: {type: Object,required: true}
})const target = ref()
let mChart = null
onMounted(() => {mChart = echarts.init(target.value)renderChart()
})/*** 双环形图绘制原理:* 1. 环形图通过饼图绘制。内外边距的距离减小,即为环形。环形中心点需要不断改变,否则会重叠* 2. 环形图绘制分为 上层和底层 两部分。上层作为绘制进度,底层作为背景图* 3. 依据 getSeriesData 生成对应的 上层和底层 series 数据,进行渲染*/
const getSeriesData = () => {const series = []props.data.abnormals.forEach((item, index) => {// 上层环形绘制series.push({name: item.name,// 使用饼图绘制,减少饼图宽度即为环形图type: 'pie',// 逆时针排布clockWise: false,// 不展示鼠标移入动画hoverAnimation: false,// 半径位置,需要依次递减,否则会重复在一处进行展示radius: [73 - index * 15 + '%', 68 - index * 15 + '%'],// 中心点center: ['55%', '55%'],// 不展示 labellabel: { show: false },// 数据配置data: [// 设置数据与名称{ value: item.value, name: item.name },// 最大数据,展示比例{value: 1000,name: '',itemStyle: { color: 'rgba(0,0,0,0)', borderWidth: 0 },tooltip: { show: false },hoverAnimation: false}]})// 底层图series.push({name: item.name,type: 'pie',// 图形不响应事件silent: true,// z-index: 置于底层z: 1,// 逆时针排布clockWise: false,// 不展示鼠标移入动画hoverAnimation: false,// 半径位置,需要依次递减,否则会重复在一处进行展示radius: [73 - index * 15 + '%', 68 - index * 15 + '%'],// 中心点center: ['55%', '55%'],// 不展示 labellabel: { show: false },// 数据data: [// 绘制底线 75%{value: 7.5,itemStyle: { color: 'rgb(3, 31, 62)', borderWidth: 0 },tooltip: { show: false },hoverAnimation: false},// 绘制底线 25% 透明区域{value: 2.5,name: '',itemStyle: { color: 'rgba(0,0,0,0)', borderWidth: 0 },tooltip: { show: false },hoverAnimation: false}]})})return series
}const renderChart = () => {const options = {// 图例配置legend: {show: true,// 图例色块icon: 'circle',// 位置top: '14%',left: '60%',// 展示数据data: props.data.abnormals.map((item) => item.name),// 总宽度(一列)width: -5,// 每个色块的宽itemWidth: 10,// 每个色块的高度itemHeight: 10,// item 间距itemGap: 6,// 展示内容formatter: function (name) {return '{title|' + name + '}'},// 字体配置textStyle: {rich: {title: {fontSize: 12,lineHeight: 5,color: 'rgba(255,255,255,0.8)'}}}},// 提示层tooltip: {show: true,trigger: 'item',formatter: '{a}<br>{b}:{c}({d}%)'},// Y 轴展示选项yAxis: [{type: 'category',// 反向展示inverse: true,// 不展示轴线axisLine: {show: false},// 不展示刻度axisTick: {show: false}}],// X 轴不展示xAxis: [{show: false}],// 每两个标记一条线series: getSeriesData()}mChart.setOption(options)
}// 监听数据的变化,重新渲染图表
watch(() => props.data,() => {renderChart()}
)
</script><style lang="scss" scoped></style>
四、数据传递关系图
Relation.vue
<template><div><div>【数据传递信息】</div><div ref="target" class="w-full h-full"></div></div>
</template><script setup>
import { onMounted, ref, watch } from 'vue'
import * as echarts from 'echarts'const props = defineProps({data: {type: Object,required: true}
})// 获取 dom 实例
const target = ref()// echarts 实例变量
let mChart = null
// 在 mounted 生命周期之后,实例化 echarts
onMounted(() => {mChart = echarts.init(target.value)// 渲染 echartsrenderChart()
})// 渲染图表
const renderChart = () => {const options = {// X 轴不需要展示xAxis: {show: false,type: 'value'},// X 轴不需要展示yAxis: {show: false,type: 'value'},// 核心数据配置series: [{// 用于展现节点以及节点之间的关系数据type: 'graph',// 不采用任何布局layout: 'none',// 使用二维的直角坐标系coordinateSystem: 'cartesian2d',// 节点标记的大小symbolSize: 26,// z-indexz: 3,// 边界标签(线条文字)edgeLabel: {normal: {show: true,color: '#fff',textStyle: {fontSize: 14},formatter: function (params) {let txt = ''if (params.data.speed !== undefined) {txt = params.data.speed}return txt}}},// 圆饼下文字label: {normal: {show: true,position: 'bottom',color: '#5e5e5e'}},// 边两端的标记类型edgeSymbol: ['none', 'arrow'],// 边两端的标记大小edgeSymbolSize: 8,// 圆数据data: props.data.relations.map((item) => {// id 为 0 ,表示数据中心,数据中心单独设置if (item.id !== 0) {return {name: item.name,category: 0,active: true,speed: `${item.speed}kb/s`,// 位置value: item.value}} else {return {name: item.name,// 位置value: item.value,// 数据中心圆的大小symbolSize: 100,// 圆的样式itemStyle: {normal: {// 渐变色color: {colorStops: [{ offset: 0, color: '#157eff' },{ offset: 1, color: '#35c2ff' }]}}},// 字体label: { normal: { fontSize: '14' } }}}}),// 线links: props.data.relations.map((item, index) => ({// 方向source: item.source,target: item.target,// 线上的文字speed: `${item.speed}kb/s`,// 线的样式lineStyle: { normal: { color: '#12b5d0', curveness: 0.2 } },// 文字位置label: {show: true,position: 'middle',offset: [10, 0]}}))},{// 用于带有起点和终点信息的线数据的绘制type: 'lines',// 使用二维的直角坐标系coordinateSystem: 'cartesian2d',// z-indexz: 1,// 线特效的配置effect: {show: true,smooth: false,trailLength: 0,symbol: 'arrow',color: 'rgba(55,155,255,0.5)',symbolSize: 12},// 线的样式lineStyle: {normal: {curveness: 0.2}},// 线的数据级,前后线需要重合。数据固定data: [[{ coord: [0, 300] }, { coord: [50, 200] }],[{ coord: [0, 100] }, { coord: [50, 200] }],[{ coord: [50, 200] }, { coord: [100, 100] }],[{ coord: [50, 200] }, { coord: [100, 300] }]]}]}mChart.setOption(options)
}// 监听数据的变化,重新渲染图表
watch(() => props.data,() => {renderChart()}
)
</script><style lang="scss" scoped></style>
五、关键词条云文档图
pnpm i --save echarts-wordcloud@2.1.0
WordCloud.vue
<template><div><div>【数据传递信息】</div><div ref="target" class="w-full h-full"></div></div>
</template><script setup>
import { onMounted, ref, watch } from 'vue'
import * as echarts from 'echarts'const props = defineProps({data: {type: Object,required: true}
})// 获取 dom 实例
const target = ref()// echarts 实例变量
let mChart = null
// 在 mounted 生命周期之后,实例化 echarts
onMounted(() => {mChart = echarts.init(target.value)// 渲染 echartsrenderChart()
})// 渲染图表
const renderChart = () => {const options = {// X 轴不需要展示xAxis: {show: false,type: 'value'},// X 轴不需要展示yAxis: {show: false,type: 'value'},// 核心数据配置series: [{// 用于展现节点以及节点之间的关系数据type: 'graph',// 不采用任何布局layout: 'none',// 使用二维的直角坐标系coordinateSystem: 'cartesian2d',// 节点标记的大小symbolSize: 26,// z-indexz: 3,// 边界标签(线条文字)edgeLabel: {normal: {show: true,color: '#fff',textStyle: {fontSize: 14},formatter: function (params) {let txt = ''if (params.data.speed !== undefined) {txt = params.data.speed}return txt}}},// 圆饼下文字label: {normal: {show: true,position: 'bottom',color: '#5e5e5e'}},// 边两端的标记类型edgeSymbol: ['none', 'arrow'],// 边两端的标记大小edgeSymbolSize: 8,// 圆数据data: props.data.relations.map((item) => {// id 为 0 ,表示数据中心,数据中心单独设置if (item.id !== 0) {return {name: item.name,category: 0,active: true,speed: `${item.speed}kb/s`,// 位置value: item.value}} else {return {name: item.name,// 位置value: item.value,// 数据中心圆的大小symbolSize: 100,// 圆的样式itemStyle: {normal: {// 渐变色color: {colorStops: [{ offset: 0, color: '#157eff' },{ offset: 1, color: '#35c2ff' }]}}},// 字体label: { normal: { fontSize: '14' } }}}}),// 线links: props.data.relations.map((item, index) => ({// 方向source: item.source,target: item.target,// 线上的文字speed: `${item.speed}kb/s`,// 线的样式lineStyle: { normal: { color: '#12b5d0', curveness: 0.2 } },// 文字位置label: {show: true,position: 'middle',offset: [10, 0]}}))},{// 用于带有起点和终点信息的线数据的绘制type: 'lines',// 使用二维的直角坐标系coordinateSystem: 'cartesian2d',// z-indexz: 1,// 线特效的配置effect: {show: true,smooth: false,trailLength: 0,symbol: 'arrow',color: 'rgba(55,155,255,0.5)',symbolSize: 12},// 线的样式lineStyle: {normal: {curveness: 0.2}},// 线的数据级,前后线需要重合。数据固定data: [[{ coord: [0, 300] }, { coord: [50, 200] }],[{ coord: [0, 100] }, { coord: [50, 200] }],[{ coord: [50, 200] }, { coord: [100, 100] }],[{ coord: [50, 200] }, { coord: [100, 300] }]]}]}mChart.setOption(options)
}// 监听数据的变化,重新渲染图表
watch(() => props.data,() => {renderChart()}
)
</script><style lang="scss" scoped></style>
六、 数据总览图
实现自增效果:pnpm i --save countup.js@2.6.2
TotalData.vue
<template><div class="p-6"><div class="text-slate-300 text-center">数据总量:<spanref="totalCountTarget"class="text-7xl ml-2 mr-2 font-bold font-[Electronic] text-gradient">679,473,929</span>条记录</div><div class="mt-3 flex flex-wrap"><div class="w-1/3 text-center text-slate-400 text-sm">华北:<span ref="city1" class="text-[#5DC5EF] text-3xl font-[Electronic]">8,778,988</span></div><div class="w-1/3 text-center text-slate-400 text-sm">东北:<spanref="city2"class="text-[#5DC5EF] text-3xl font-[Electronic]">8,778,988</span></div><div class="w-1/3 text-center text-slate-400 text-sm">华东:<spanref="city3"class="text-[#5DC5EF] text-3xl font-[Electronic]">8,778,988</span></div><div class="w-1/3 text-center text-slate-400 text-sm">中南:<spanref="city4"class="text-[#5DC5EF] text-3xl font-[Electronic]">8,778,988</span></div><div class="w-1/3 text-center text-slate-400 text-sm">西南:<spanref="city5"class="text-[#5DC5EF] text-3xl font-[Electronic]">8,778,988</span></div><div class="w-1/3 text-center text-slate-400 text-sm">西北:<spanref="city6"class="text-[#5DC5EF] text-3xl font-[Electronic]">8,778,988</span></div></div></div>
</template><script setup>
import { onMounted, ref } from 'vue'
// @ts-ignore
import { CountUp } from 'countup.js'const props = defineProps({data: {type: Object,required: true}
})const totalCountTarget = ref(null)
const city1 = ref(null)
const city2 = ref(null)
const city3 = ref(null)
const city4 = ref(null)
const city5 = ref(null)
const city6 = ref(null)onMounted(() => {new CountUp(totalCountTarget.value, props.data.total).start()new CountUp(city1.value, props.data.hb).start()new CountUp(city2.value, props.data.db).start()new CountUp(city3.value, props.data.hd).start()new CountUp(city4.value, props.data.zn).start()new CountUp(city5.value, props.data.xn).start()new CountUp(city6.value, props.data.xb).start()
})
</script><style lang="scss" scoped></style>
七、地图可视化分析
时间线+右侧柱形图+中国地图+散点图绘制
全文忽略ts语法错误:
// @ts-nocheck
<template><div><div ref="target" class="w-full h-full"></div></div>
</template><script setup>
// @ts-nocheck
import { onMounted, ref } from 'vue'
import * as echarts from 'echarts'
import mapJson from '../assets/MapData/china.json'const props = defineProps({data: {type: Object,required: true}
})const target = ref()
let mChart = null
onMounted(() => {mChart = echarts.init(target.value)renderChart()
})const renderChart = () => {// echarts 渲染echarts.registerMap('china', mapJson)let options = {// 时间线,提供了在多个 ECharts option 间进行切换timeline: {// 数据data: props.data.voltageLevel,// 类目轴axisType: 'category',// 自动切换autoPlay: true,// 间隔时间playInterval: 3000,// 位置left: '10%',right: '10%',bottom: '0%',width: '80%',// 轴的文本标签label: {// 默认状态normal: {textStyle: {color: '#ddd'}},// 高亮状态emphasis: {textStyle: {color: '#fff'}}},// 文字大小symbolSize: 10,// 线的样式lineStyle: {color: '#555'},// 选中点的样式checkpointStyle: {borderColor: '#888',borderWidth: 2},// 控件样式controlStyle: {// 上一步按钮showNextBtn: true,// 下一步按钮showPrevBtn: true,// 默认样式normal: {color: '#666',borderColor: '#666'},// 高亮样式emphasis: {color: '#aaa',borderColor: '#aaa'}}},// 柱形图右侧展示baseOption: {grid: {right: '2%',top: '15%',bottom: '10%',width: '20%'},// 中国地图geo: {// 展示show: true,// 中国地图map: 'china',// 开启缩放roam: true,// 初始缩放zoom: 0.8,// 中心点center: [113.83531246, 34.0267395887],// 默认状态的省份样式itemStyle: {normal: {// 边框色值borderColor: 'rgba(147, 235, 248, 1)',// 边框宽度borderWidth: 1,// 区域颜色areaColor: {// 经向色值type: 'radial',x: 0.5,y: 0.5,r: 0.5,colorStops: [// 0% 处的颜色{offset: 0,color: 'rgba(147, 235, 248, 0)'},// 100% 处的颜色{offset: 1,color: 'rgba(147, 235, 248, .2)'}],// 缺省为 falseglobalCoord: false}},// 鼠标移入的色值emphasis: {areaColor: '#389BB7',borderWidth: 0}}}},// 绑定时间轴的多个图表options: []}// 为每一年度的图表添加数据props.data.voltageLevel.forEach((item, index) => {options.options.push({// 背景色backgroundColor: '#142037',title: [// 主标题,对应地图{// @ts-ignoretext: '2019-2023 年度数据统计',left: '0%',top: '0',textStyle: {color: '#ccc',fontSize: 30}},// 副标题,对应柱形图{id: 'statistic',text: item + '年数据统计情况',right: '0%',top: '4%',textStyle: {color: '#ccc',fontSize: 20}}],// X 轴配置xAxis: {// 数据轴type: 'value',// 脱离 0 值比例scale: true,// 位置position: 'top',// 不显示分割线splitLine: {show: false},// 不显示轴线axisLine: {show: false},// 不显示刻度尺axisTick: {show: false},// 类别文字axisLabel: {margin: 2,textStyle: {color: '#aaa'}}},// Y 轴yAxis: {// 选项轴type: 'category',// 轴线axisLine: {show: true,lineStyle: {color: '#ddd'}},// 轴刻度axisTick: {show: false,lineStyle: {color: '#ddd'}},// 轴标签axisLabel: {interval: 0,textStyle: {color: '#ddd'}},// 根据年份,获取对应数据data: props.data.categoryData[item].map((item) => item.name)},// 核心配置series: [// 柱形图{zlevel: 1.5,// 柱形图type: 'bar',// 每个柱子的色值itemStyle: {normal: {color: props.data.colors[index]}},// 根据年份,获取对应数据data: props.data.categoryData[item].map((item) => item.value)},// 散点图{// 散点(气泡)图type: 'effectScatter',// 使用地理坐标系coordinateSystem: 'geo',// 数据data: props.data.topData[item],// 标记大小symbolSize: function (val) {return val[2] / 4},// 绘制完成后显示特效showEffectOn: 'render',// 展示涟漪特效rippleEffect: {brushType: 'stroke'},// 文字label: {normal: {formatter: '{b}',position: 'right',show: true}},// 每一项的配置itemStyle: {normal: {color: props.data.colors[index],// 阴影配置shadowBlur: 5,shadowColor: props.data.colors[index]}},zlevel: 1}]})})mChart.setOption(options)
}
</script><style lang="scss" scoped></style>
八、AntV、G2、DataV
G2:G2
antv: https://antv.antgroup.com/
datav: DataV


