关于
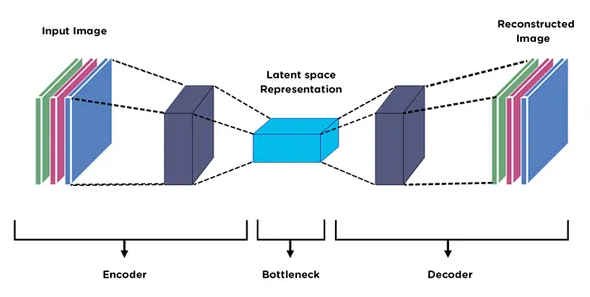
本项目主要实现卷积自编码器对于异常心电ECG信号的检测和识别,属于无监督学习中的生理信号检测的典型方法之一。
工具


方法实现
读取心电信号
normal_df = pd.read_csv("/heartbeat/ptbdb_normal.csv").iloc[:, :-1]
anomaly_df = pd.read_csv("/heartbeat/ptbdb_abnormal.csv").iloc[:, :-1]
normal_df.head()
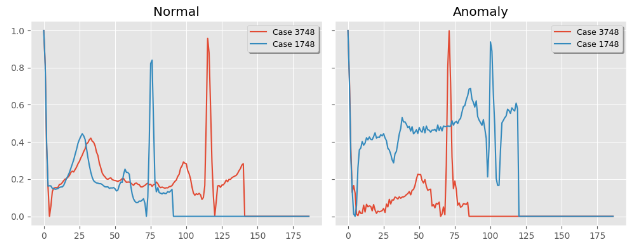
信号可视化
def plot_sample(normal, anomaly):index = np.random.randint(0, len(normal_df), 2)fig, ax = plt.subplots(1, 2, sharey=True, figsize=(10, 4))ax[0].plot(normal.iloc[index[0], :].values, label=f"Case {index[0]}")ax[0].plot(normal.iloc[index[1], :].values, label=f"Case {index[1]}")ax[0].legend(shadow=True, frameon=True, facecolor="inherit", loc=1, fontsize=9)ax[0].set_title("Normal")ax[1].plot(anomaly.iloc[index[0], :].values, label=f"Case {index[0]}")ax[1].plot(anomaly.iloc[index[1], :].values, label=f"Case {index[1]}")ax[1].legend(shadow=True, frameon=True, facecolor="inherit", loc=1, fontsize=9)ax[1].set_title("Anomaly")plt.tight_layout()plt.show()plot_sample(normal_df, anomaly_df)
信号均值计算及可视化
def plot_smoothed_mean(data, class_name = "normal", step_size=5, ax=None):df = pd.DataFrame(data)roll_df = df.rolling(step_size)smoothed_mean = roll_df.mean().dropna().reset_index(drop=True)smoothed_std = roll_df.std().dropna().reset_index(drop=True)margin = 3*smoothed_stdlower_bound = (smoothed_mean - margin).values.flatten()upper_bound = (smoothed_mean + margin).values.flatten()ax.plot(smoothed_mean.index, smoothed_mean)ax.fill_between(smoothed_mean.index, lower_bound, y2=upper_bound, alpha=0.3, color="red")ax.set_title(class_name, fontsize=9)fig, axes = plt.subplots(1, 2, figsize=(8, 4), sharey=True)
axes = axes.flatten()
for i, label in enumerate(CLASS_NAMES, start=1):data_group = df.groupby("target")data = data_group.get_group(label).mean(axis=0, numeric_only=True).to_numpy()plot_smoothed_mean(data, class_name=label, step_size=20, ax=axes[i-1])
fig.suptitle("Plot of smoothed mean for each class", y=0.95, weight="bold")
plt.tight_layout()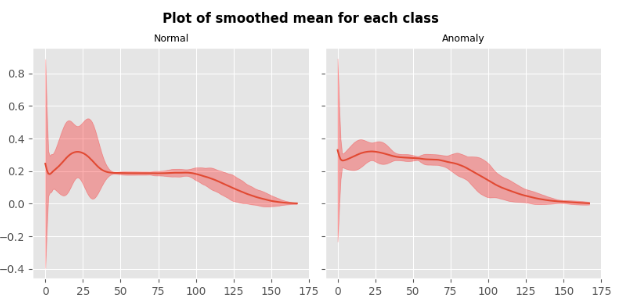
训练/测试数据划分
normal_df.drop("target", axis=1, errors="ignore", inplace=True)
normal = normal_df.to_numpy()
anomaly_df.drop("target", axis=1, errors="ignore", inplace=True)
anomaly = anomaly_df.to_numpy()X_train, X_test = train_test_split(normal, test_size=0.15, random_state=45, shuffle=True)
print(f"Train shape: {X_train.shape}, Test shape: {X_test.shape}, anomaly shape: {anomaly.shape}")
搭建自编码器
class AutoEncoder(Model):def __init__(self, input_dim, latent_dim):super(AutoEncoder, self).__init__()self.input_dim = input_dimself.latent_dim = latent_dimself.encoder = tf.keras.Sequential([layers.Input(shape=(input_dim,)),layers.Reshape((input_dim, 1)),  # Reshape to 3D for Conv1Dlayers.Conv1D(128, 3, strides=1, activation='relu', padding="same"),layers.BatchNormalization(),layers.MaxPooling1D(2, padding="same"),layers.Conv1D(128, 3, strides=1, activation='relu', padding="same"),layers.BatchNormalization(),layers.MaxPooling1D(2, padding="same"),layers.Conv1D(latent_dim, 3, strides=1, activation='relu', padding="same"),layers.BatchNormalization(),layers.MaxPooling1D(2, padding="same"),])# Previously, I was using UpSampling. I am trying Transposed Convolution this time around.self.decoder = tf.keras.Sequential([layers.Conv1DTranspose(latent_dim, 3, strides=1, activation='relu', padding="same"),
#             layers.UpSampling1D(2),layers.BatchNormalization(),layers.Conv1DTranspose(128, 3, strides=1, activation='relu', padding="same"),
#             layers.UpSampling1D(2),layers.BatchNormalization(),layers.Conv1DTranspose(128, 3, strides=1, activation='relu', padding="same"),
#             layers.UpSampling1D(2),layers.BatchNormalization(),layers.Flatten(),layers.Dense(input_dim)])def call(self, X):encoded = self.encoder(X)decoded = self.decoder(encoded)return decodedinput_dim = X_train.shape[-1]
latent_dim = 32model = AutoEncoder(input_dim, latent_dim)
model.build((None, input_dim))
model.compile(optimizer=tf.keras.optimizers.Adam(learning_rate=0.01), loss="mae")
model.summary()
模型训练
epochs = 100
batch_size = 128
early_stopping = EarlyStopping(patience=10, min_delta=1e-3, monitor="val_loss", restore_best_weights=True)history = model.fit(X_train, X_train, epochs=epochs, batch_size=batch_size,validation_split=0.1, callbacks=[early_stopping])
训练可视化
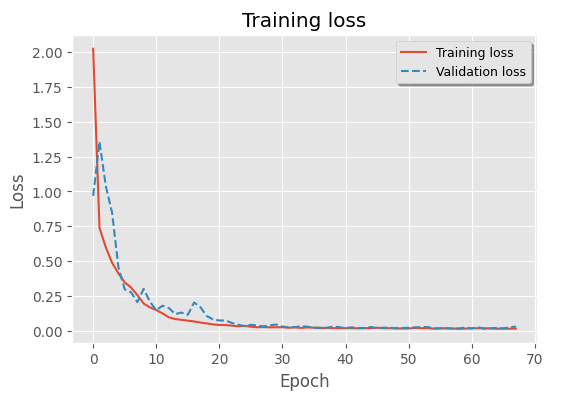
plt.plot(history.history['loss'], label="Training loss")
plt.plot(history.history['val_loss'], label="Validation loss", ls="--")
plt.legend(shadow=True, frameon=True, facecolor="inherit", loc="best", fontsize=9)
plt.title("Training loss")
plt.ylabel("Loss")
plt.xlabel("Epoch")
plt.show()
信号重建可视化
fig, axes = plt.subplots(2, 5, sharey=True, sharex=True, figsize=(12, 6))
random_indexes = np.random.randint(0, len(X_train), size=5)for i, idx in enumerate(random_indexes):data = X_train[[idx]]plot_examples(model, data, ax=axes[0, i], title="Normal")for i, idx in enumerate(random_indexes):data = anomaly[[idx]]plot_examples(model, data, ax=axes[1, i], title="anomaly")plt.tight_layout()
fig.suptitle("Sample plots (Actual vs Reconstructed by the CNN autoencoder)", y=1.04, weight="bold")
fig.savefig("autoencoder.png")
plt.show()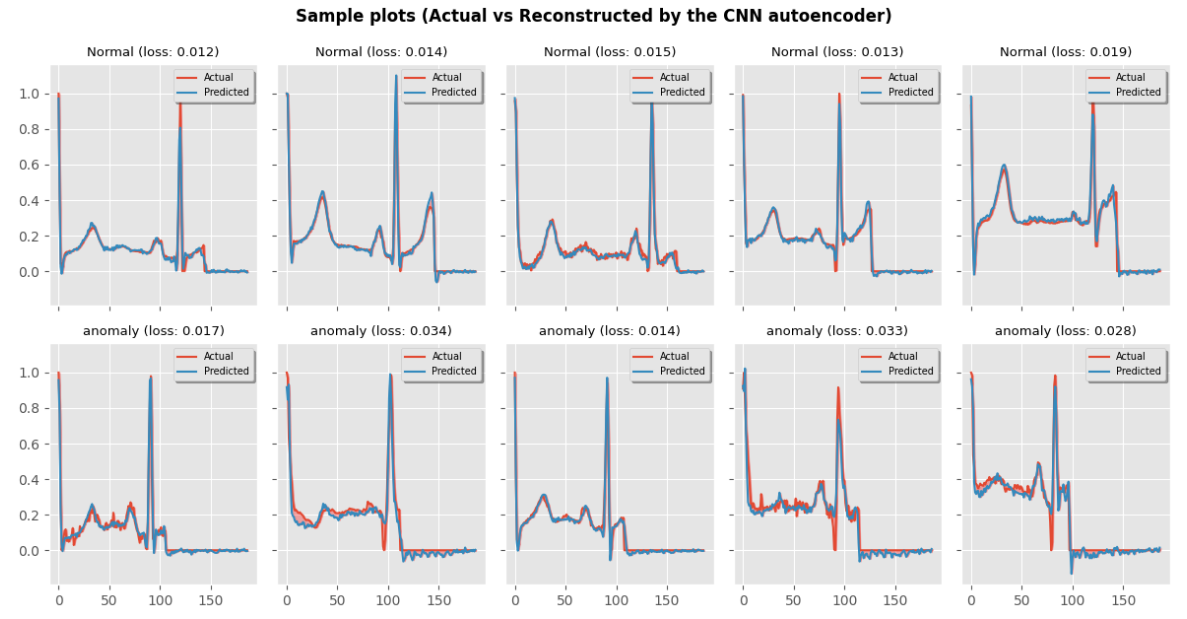
计算重建MAE误差
train_mae = model.evaluate(X_train, X_train, verbose=0)
test_mae = model.evaluate(X_test, X_test, verbose=0)
anomaly_mae = model.evaluate(anomaly_df, anomaly_df, verbose=0)print("Training dataset error: ", train_mae)
print("Testing dataset error: ", test_mae)
print("Anormaly dataset error: ", anomaly_mae)
异常检测阈值选取
MAE误差阈值=正常数据重建MAE均值+正常数据重建MAE标准差,此阈值可以用来直接检测某信号为正常信号还是异常心电信号。
def predict(model, X):pred = model.predict(X, verbose=False)loss = mae(pred, X)return pred, loss_, train_loss = predict(model, X_train)
_, test_loss = predict(model, X_test)
_, anomaly_loss = predict(model, anomaly)
threshold = np.mean(train_loss) + np.std(train_loss) # Setting threshold for distinguish normal data from anomalous databins = 40
plt.figure(figsize=(9, 5), dpi=100)
sns.histplot(np.clip(train_loss, 0, 0.5), bins=bins, kde=True, label="Train Normal")
sns.histplot(np.clip(test_loss, 0, 0.5), bins=bins, kde=True, label="Test Normal")
sns.histplot(np.clip(anomaly_loss, 0, 0.5), bins=bins, kde=True, label="anomaly")ax = plt.gca()  # Get the current Axes
ylim = ax.get_ylim()
plt.vlines(threshold, 0, ylim[-1], color="k", ls="--")
plt.annotate(f"Threshold: {threshold:.3f}", xy=(threshold, ylim[-1]), xytext=(threshold+0.009, ylim[-1]),arrowprops=dict(facecolor='black', shrink=0.05), fontsize=9)
plt.legend(shadow=True, frameon=True, facecolor="inherit", loc="best", fontsize=9)
plt.show()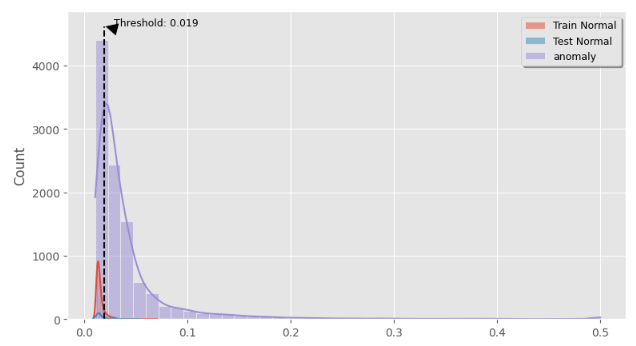
模型评估
plot_confusion_matrix(model, X_train, X_test, anomaly, threshold=threshold)ytrue, ypred = prepare_labels(model, X_train, X_test, anomaly, threshold=threshold)
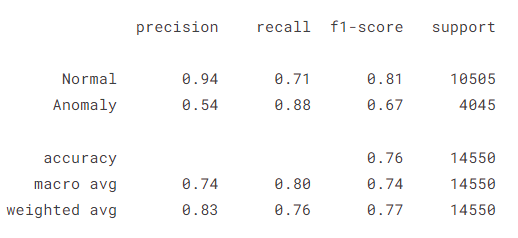
print(classification_report(ytrue, ypred, target_names=CLASS_NAMES))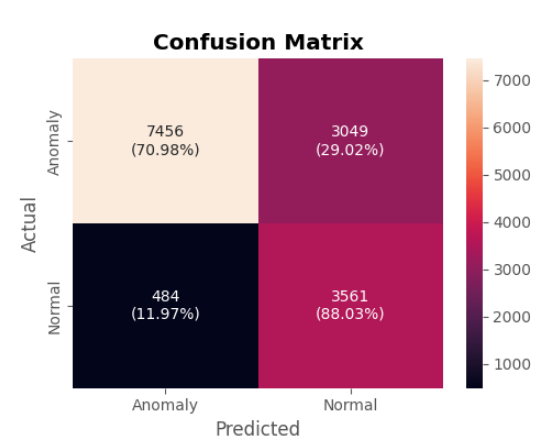
代码获取
相关项目开发和问题,欢迎后台沟通交流。


