Title
题目
Dual-Energy CT Deep Learning Radiomics to Predict Macrotrabecular-Massive Hepatocellular Carcinoma
双能量CT深度学习放射组学预测大梁状大块型肝细胞癌
Background
背景
It is unknown whether the additional information provided by multiparametric dual-energy CT (DECT) could improve the noninvasive diagnosis of the aggressive macrotrabecular-massive (MTM) subtype of hepatocellular carcinoma (HCC).
目前尚不清楚多参数双能量CT(DECT)提供的额外信息是否能改善侵袭性大梁状大块型(MTM)肝细胞癌(HCC)的非侵入性诊断。
Conclusions
结论
A DL radiomics nomogram derived from multiparametric DECT accurately predicted the MTM subtype in patients with HCC.
从多参数双能量CT(DECT)衍生的DL放射组学列线图准确预测了患有肝细胞癌(HCC)的患者中的大梁状大块型(MTM)亚型。
Results
结果
A total of 262 patients were included (mean age, 54 years ± 12 [SD]; 225 men [86%]; training data set, n = 146 [56%]; internal test data set, n = 35 [13%]; external test data set, n = 81 [31%]). The DL radiomics nomogram better predicted MTM than the clinical-radiologic model (AUC = 0.91 vs 0.77, respectively, for the training set [P < .001], 0.87 vs 0.72 for the internal test data set [P = .04], and 0.89 vs 0.79 for the external test data set [P = .02]), with similar sensitivity (80% vs 87%, respectively; P = .63) and higher specificity (90% vs 63%; P < .001) in the external test data set. The predicted positive MTM groups based on the DL radiomics nomogram had shorter recurrence-free survival than predicted negative MTM groups in all three data sets (training data set, P = .04; internal test data set, P = .01; and external test data set, P = .03).
共计262名患者被纳入研究(平均年龄54岁 ± 12 [标准差];225名男性 [86%];训练数据集,n = 146 [56%];内部测试数据集,n = 35 [13%];外部测试数据集,n = 81 [31%])。DL放射组学列线图在预测大梁状大块型(MTM)方面比临床-放射学模型表现更好(训练集的AUC为0.91对比0.77 [P < .001],内部测试数据集的0.87对比0.72 [P = .04],外部测试数据集的0.89对比0.79 [P = .02]),在外部测试数据集中敏感性相似(分别为80%对比87%;P = .63)且特异性更高(90%对比63%;P < .001)。基于DL放射组学列线图预测的阳性MTM组在所有三个数据集中的无复发生存期均短于预测的阴性MTM组(训练数据集,P = .04;内部测试数据集,P = .01;外部测试数据集,P = .03)。
Method
方法
Patients with histopathologic examination–confirmed HCC who underwent contrast-enhanced DECT between June 2019 and June 2022 were retrospectively recruited from three independent centers (center 1, training and internal test data set; centers 2 and 3, external test data set). Radiologic features were visually analyzed and combined with clinical information to establish a clinical-radiologic model. Deep learning (DL) radiomics models were based on DL features and handcrafted features extracted from virtual monoenergetic images and material composition images on dual phase using binary least absolute shrinkage and selection operators. A DL radiomics nomogram was developed using multivariable logistic regression analysis. Model performance was evaluated with the area under the receiver operating characteristic curve (AUC), and the log-rank test was used to analyze recurrence-free survival.
2019年6月至2022年6月间,从三个独立中心(中心1为训练和内部测试数据集;中心2和3为外部测试数据集)回顾性招募了接受增强双能量CT(DECT)检查且经病理检查确认的肝细胞癌(HCC)患者。放射学特征通过视觉分析并结合临床信息建立临床-放射学模型。深度学习(DL)放射组学模型基于DL特征和从双相使用二进制最小绝对收缩和选择算子提取的虚拟单能量图像和材料成分图像的手工特征。使用多变量逻辑回归分析开发了一个DL放射组学列线图。模型性能通过接收者操作特征曲线(AUC)下面积评估,并使用对数秩检验分析无复发生存率。
Figure
图

Figure 1: Flowchart of patient inclusion and exclusion in this retrospective multicenter study. DECT = dual-energy CT, HCC = hepatocellular carcinoma, MTM = macrotrabecular-massive.
图1:本回顾性多中心研究中患者纳入和排除的流程图。DECT = 双能量CT,HCC = 肝细胞癌,MTM = 大梁状大块型。
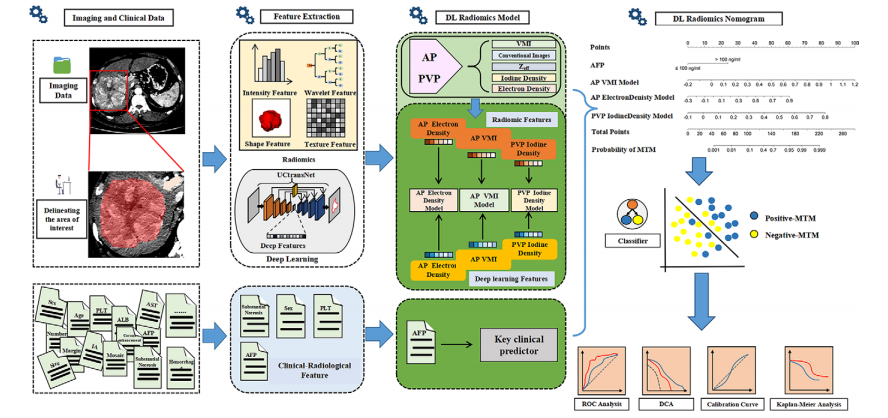
Figure 2: Diagram shows workflow for radiomics and deep learning (DL) feature extraction, parameter map selection, DL radiomics model construction, DL radiomics nomogram development, and analysis of results. AFP = α-fetoprotein, ALB = albumin, AP = arterial phase, AST = aspartate aminotransferase, DCA = decision curve analysis, IA = intratumoral artery, MTM = macrotrabecular-massive, PLT = platelet count, PVP = portal venous phase, ROC = receiver operating characteristic, VMI = virtual monoenergetic image, Zeff = effective atomic number.
图2:图解展示了放射组学和深度学习(DL)特征提取、参数图选择、DL放射组学模型构建、DL放射组学列线图开发及结果分析的工作流程。AFP = α-胎蛋白,ALB = 白蛋白,AP = 动脉相,AST = 天冬氨酸转氨酶,DCA = 决策曲线分析,IA = 肿瘤内动脉,MTM = 大梁状大块型,PLT = 血小板计数,PVP = 门静脉相,ROC = 接收者操作特征,VMI = 虚拟单能图像,Zeff = 有效原子序数。
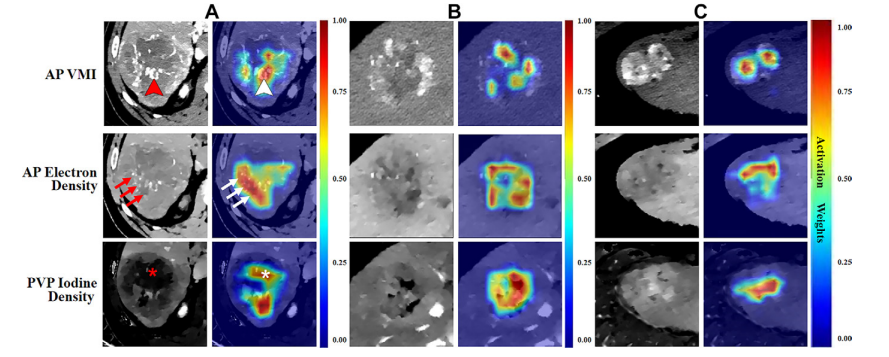
Figure 3: Example arterial phase (AP) virtual monoenergetic images (VMIs), AP electron density maps, portal venous phase (PVP) iodine density maps, and corresponding heat maps in three patients with hepatocellular carcinoma (HCC). (A) Images in a 65-year-old man with positive macrotrabecular-massive (MTM) HCC. (B) Images in a 59-year-old man with negative MTM HCC. (C) Images in a 47-year-old man with negative MTM HCC. Corresponding heat maps demonstrate that the deep learning–extracted radiomics features that were weighted highest, representing the areas of greatest interest for the model, were located inside the tumor. Highly weighted areas of the AP VMI map and AP electron density map were mostly located in the region associated with obvious tumor vessels (indicated by arrowheads in A) and tumor parenchyma containing tumor vessels (arrows in A), respectively. Highly weighted areas of PVP iodine density maps were located not only in the tumor parenchyma but also in the region with necrosis (in A).
图3:三名肝细胞癌(HCC)患者的示例动脉相(AP)虚拟单能图像(VMI)、AP电子密度图、门静脉相(PVP)碘密度图及相应热图。(A) 一位65岁男性大梁状大块型(MTM)HCC阳性患者的图像。(B) 一位59岁男性MTM HCC阴性患者的图像。(C) 一位47岁男性MTM HCC阴性患者的图像。相应的热图显示,通过深度学习提取的放射组学特征中权重最高的,代表模型最感兴趣的区域,位于肿瘤内部。AP VMI图和AP电子密度图中的高权重区域大多位于与明显的肿瘤血管相关的区域(在A中以箭头标示)及包含肿瘤血管的肿瘤实质内(在A中以箭头标示),分别。PVP碘密度图的高权重区域不仅位于肿瘤实质中,也位于含有坏死的区域(在A中以星号标示)
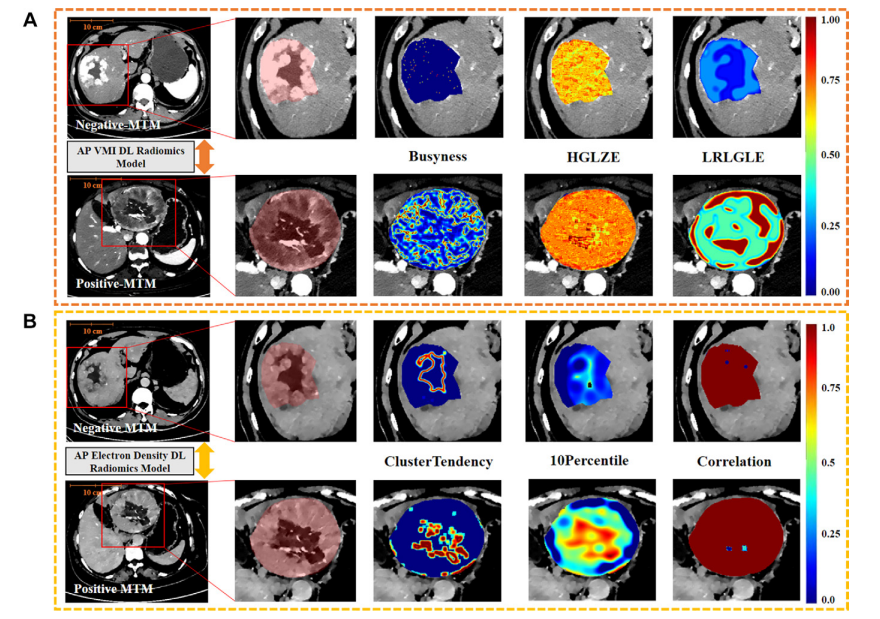
Figure 4: Example feature maps in a 58-year-old man negative for macrotrabecular-massive (MTM) hepatocellular carcinoma (HCC) (top row of A–C) and a 62-yearold woman positive for MTM HCC (bottom row of A–C). For each row, the image to the right shows an approximately two times magnified view of the area outlined by a red box in the image on the left. The red box delineates the region with HCC. The additional images display voxel-based radiomics feature mapping of models for the top three handcrafted radiomics features with high least absolute shrinkage and selection operator weight coefficients. In these images, the colors represent normalized feature values. Bluish colors indicate lower feature values, and reddish colors represent higher feature values. (A) Arterial phase (AP) virtual monoenergetic images (VMIs) from both patients. The top three handcrafted radiomics features with high weight coefficients are busyness, high gray level zone emphasis (HGLZE), and long run low gray level emphasis (LRLGLE). Busyness is a feature calculated using the Laplacian of Gaussian filter (with sigma values of 1.0 mm) based on the neighboring gray tone difference matrix; high gray level zone emphasis is a feature calculated using the wavelet filter (with low-high-low applied across three dimensions) based on the gray level size zone matrix. Long run low gray level emphasis is a feature calculated using the Laplacian of Gaussian filter (with sigma values of 5.0 mm) based on the gray level run length matrix. (B)AP electron density maps from both patients. The top three handcrafted radiomics features with high weight coefficients are cluster tendency, 10 percentile, and correlation. Cluster tendency is a feature calculated using the wavelet filter (with low-low-low applied across three dimensions) based on the gray level co-occurrence matrix, 10 percentile is a first-order statistical feature that represents 10% of the image intensity values are below this feature value and is calculated after applying a Laplacian of Gaussian filter (with sigma values of 5.0 mm), and correlation is a feature derived from the gray level co-occurrence matrix and measures the linear dependency of gray levels between neighboring pixels in the original image. (Fig 4 continues).
图4:一位58岁男性大梁状大块型(MTM)肝细胞癌(HCC)阴性患者(A–C顶行)和一位62岁女性MTM HCC阳性患者(A–C底行)的示例特征图。每行中,右侧的图像显示了左侧图像红色框内区域的约两倍放大视图。红色框标出了含有HCC的区域。额外的图像展示了基于体素的放射组学特征映射,这些特征映射基于前三个手工制作的放射组学特征,这些特征具有高的最小绝对收缩和选择算子权重系数。在这些图像中,颜色代表标准化的特征值。蓝色调表示较低的特征值,红色调表示较高的特征值。(A) 两位患者的动脉相(AP)虚拟单能图像(VMI)。前三个具有高权重系数的手工放射组学特征是繁忙度、高灰度级区域强调(HGLZE)和长程低灰度级强调(LRLGLE)。繁忙度是使用高斯滤波器的拉普拉斯(带有1.0毫米的西格玛值)根据相邻灰度差异矩阵计算的特征;高灰度级区域强调是使用小波滤波器(在三个维度上应用低高低)根据灰度级大小区域矩阵计算的特征。长程低灰度级强调是使用高斯滤波器的拉普拉斯(带有5.0毫米的西格玛值)根据灰度级运行长度矩阵计算的特征。(B) 两位患者的AP电子密度图。前三个具有高权重系数的手工放射组学特征是群集倾向、10百分位数和相关性。群集倾向是使用小波滤波器(在三个维度上应用低低低)根据灰度级共现矩阵计算的特征;10百分位数是一种一阶统计特征,代表图像强度值中有10%低于此特征值,是在应用高斯滤波器的拉普拉斯(带有5.0毫米的西格玛值)后计算得出的;相关性是从灰度级共现矩阵派生的特征,用于衡量原始图像中相邻像素间灰度级的线性依赖性。(图4继续)。
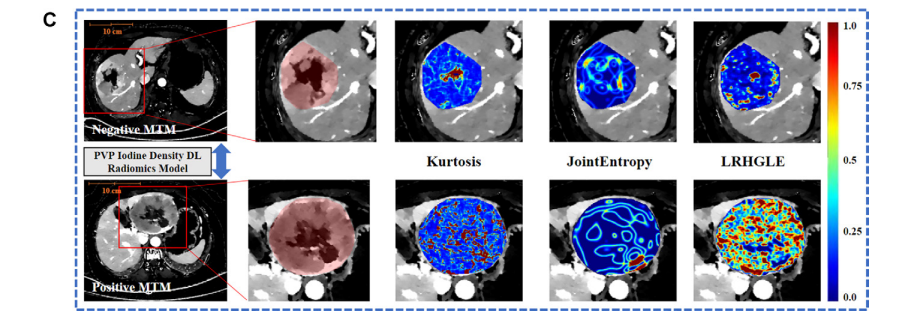
Figure 4 (continued): (C) Portal venous phase (PVP) iodine density maps from both patients. The top three handcrafted radiomics features with high weight coefficients are kurtosis, long run high gray level emphasis (LRHGLE), and joint entropy. Kurtosis is a first-order statistical feature and calculated after applying a wavelet filter (with lowlow-high applied across three dimensions), joint entropy is a feature calculated using the Laplacian of Gaussian filter (with sigma values of 5.0 mm) based on the gray level co-occurrence matrix, and long run high gray level emphasis is a feature calculated using the wavelet filter (with low-high-low applied across three dimensions) based on the gray level run length matrix. The features of the patient with positive MTM showed higher heterogeneity or textual pattern complexity within tumors than those of the patient with negative MTM. DL = deep learning(续)
图4:(C) 两位患者的门静脉相(PVP)碘密度图。前三个具有高权重系数的手工放射组学特征是峰度、长程高灰度级强调(LRHGLE)和联合熵。峰度是一种一阶统计特征,在应用小波滤波器(在三个维度上应用低低高)后计算得出;联合熵是使用高斯滤波器的拉普拉斯(带有5.0毫米的西格玛值)根据灰度级共现矩阵计算的特征;长程高灰度级强调是使用小波滤波器(在三个维度上应用低高低)根据灰度级运行长度矩阵计算的特征。MTM阳性患者的特征显示出比MTM阴性患者更高的异质性或肿瘤内部的纹理模式复杂性。DL = 深度学习。
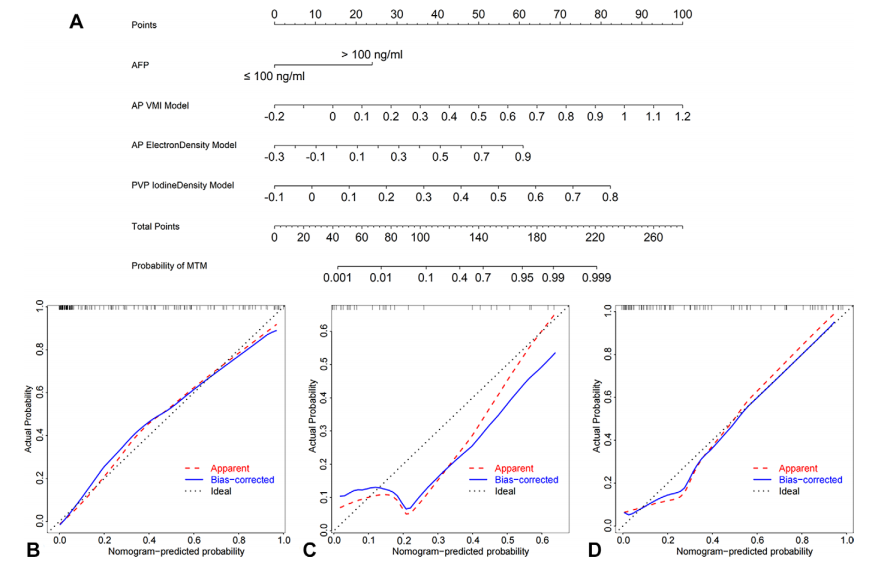
Figure 5: Deep learning (DL) radiomics nomogram and the calibration curves based on this model from the three patient data sets. (A) DL radiomics nomogram for predicting macrotabecular-massive (MTM) hepatocellular carcinoma developed based on the training data set (n = 146). The nomogram considers the arterial phase (AP) virtual monoenergetic image (VMI) model output score, the AP electron density map model output score, the portal venous phase (PVP) iodine density map model output score, and α-fetoprotein (AFP) levels of 100 ng/mL or less or more than 100 ng/mL. The points for each of these variables correspond with the top points bar with a scale of 0–100. Then, the four points are summed to calculate the total points. The predicted probability of MTM is obtained by mapping the total point to the total points bar and the probability of MTM bar. (B–D) Calibration curves of the DL radiomics nomogram for predicting MTM subtype status in the training data set (B), internal test data set (C), and external data set (D). In B–D*, the red line represents the initial performance of the model without any corrections. The blue line illustrates the model’s calibration after addressing the observed bias. The black line signifies a scenario in which the predicted probabilities perfectly align with the observed probabilities.
图5:基于三个患者数据集的深度学习(DL)放射组学列线图及其校准曲线。(A) 基于训练数据集(n* = 146)开发的用于预测大梁状大块型(MTM)肝细胞癌的DL放射组学列线图。该列线图考虑了动脉相(AP)虚拟单能图像(VMI)模型输出分数、AP电子密度图模型输出分数、门静脉相(PVP)碘密度图模型输出分数以及α-胎蛋白(AFP)水平是否100 ng/mL以下或超过100 ng/mL。这些变量的每一个都与顶部分数条对应,分数条的刻度为0-100。然后,将这四个分数相加以计算总分。通过将总分映射到总分条和MTM可能性条上,获得MTM的预测概率。(B–D) DL放射组学列线图在训练数据集(B)、内部测试数据集(C)和外部数据集(D)中预测MTM亚型状态的校准曲线。在B–D中,红线代表模型在未进行任何校正的初始性能。蓝线显示了解决观察到的偏差后模型的校准情况。黑线表示预测概率与观察概率完全对齐的情况。

Figure 6: Diagnostic performance of the deep learning (DL) radiomics nomogram. (A) Plots show the DL radiomics nomogram–predicted probabilities and actual diagnosis of macrotabecular-massive (MTM) hepatocellular carcinoma for each individual patient in the training data set (n = 146), internal test data set (n = 35), and external test data set (n = 81). The dotted line represents the cutoff value of 0.23. In the graphs for the training and internal test data sets, the arrow points toward the patient with the predicted probability closest to and less than 0.1%. In the graph for the external test data set, the arrow indicates the patient with a predicted probability closest to and greater than 99.9%. (B) Area under the receiver operating characteristic curve (AUC) analysis shows better performance for predicting MTM using the DL radiomics nomogram (red line) compared with the clinical-radiologic model (green line) in the training data set (P < .001), internal test data set (P = .04), and external test data set (P = .02). (C) Decision curve analysis shows that the DL radiomics nomogram (red line) has a higher net benefit than the clinical-radiologic model (blue line) in the training data set (P = .01). When the threshold probability is more than 20% in the internal test data set and more than 10% in the external test data set, the DL radiomics nomogram has higher net benefits than the clinical-radiologic model (internal test data set, P = .03; external test data set, P = .02). Plots also show that combining the DL radiomics nomogram model with substantial necrosis data (yellow line) does not yield an additional net benefit compared with using the DL radiomics nomogram alone (training data set, P = .96; internal test data set, P = .13; external test data set, P = .98). (D) Kaplan-Meier survival curve analysis shows the differences of recurrence-free survival between predicted negative and positive MTM groups (training data set, P = .04; internal test data set, P = .01; external test data set, P = .03).
图6:深度学习(DL)放射组学列线图的诊断性能。(A) 图表显示了DL放射组学列线图预测的概率和训练数据集(n* = 146)、内部测试数据集(n = 35)及外部测试数据集(n = 81)中每位患者的大梁状大块型(MTM)肝细胞癌的实际诊断。虚线代表0.23的截止值。在训练和内部测试数据集的图表中,箭头指向预测概率最接近且小于0.1%的患者。在外部测试数据集的图表中,箭头指示预测概率最接近且大于99.9%的患者。(B) 接收者操作特征曲线(AUC)分析显示,在训练数据集(P < .001)、内部测试数据集(P = .04)和外部测试数据集(P = .02)中,使用DL放射组学列线图(红线)预测MTM的性能优于临床-放射学模型(绿线)。(C) 决策曲线分析表明,在训练数据集中DL放射组学列线图(红线)的净效益高于临床-放射学模型(蓝线)(P = .01)。当内部测试数据集的阈值概率超过20%,外部测试数据集的阈值概率超过10%时,DL放射组学列线图的净效益高于临床-放射学模型(内部测试数据集,P = .03;外部测试数据集,P = .02)。图表还显示,将DL放射组学列线图模型与显著坏死数据(黄线)结合使用,与单独使用DL放射组学列线图相比没有额外的净效益(训练数据集,P = .96;内部测试数据集,P = .13;外部测试数据集,P = .98)。(D) Kaplan-Meier生存曲线分析显示预测阴性和阳性MTM组之间无复发生存的差异(训练数据集,P = .04;内部测试数据集,P = .01;外部测试数据集,P = .03)。
Table
表
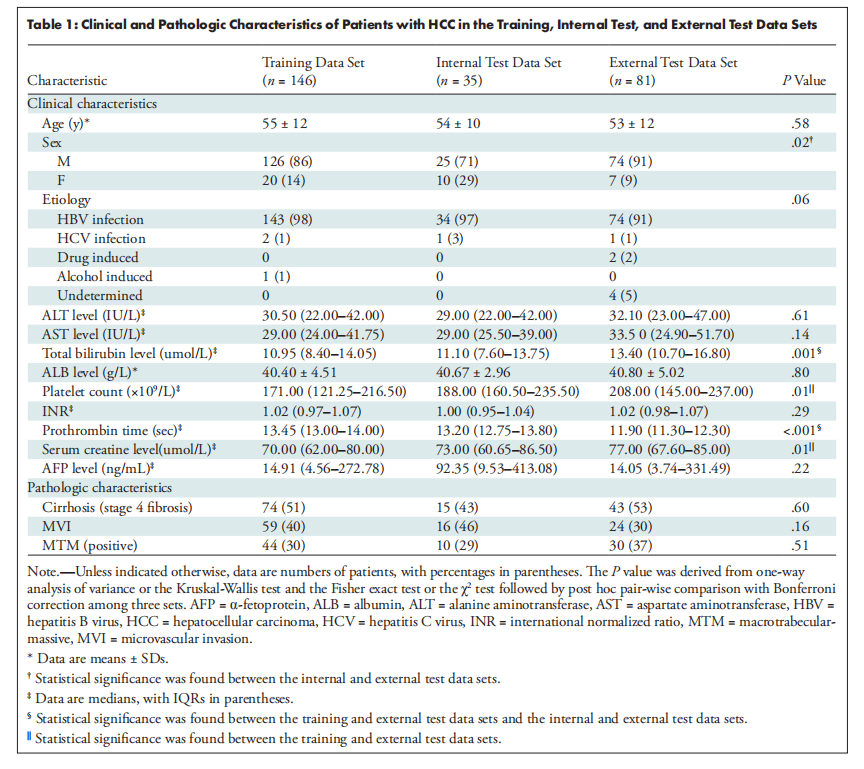
Table 1: Clinical and Pathologic Characteristics of Patients with HCC in the Training, Internal Test, and External Test Data Sets
表1:训练、内部测试和外部测试数据集中患有肝细胞癌(HCC)患者的临床和病理特征
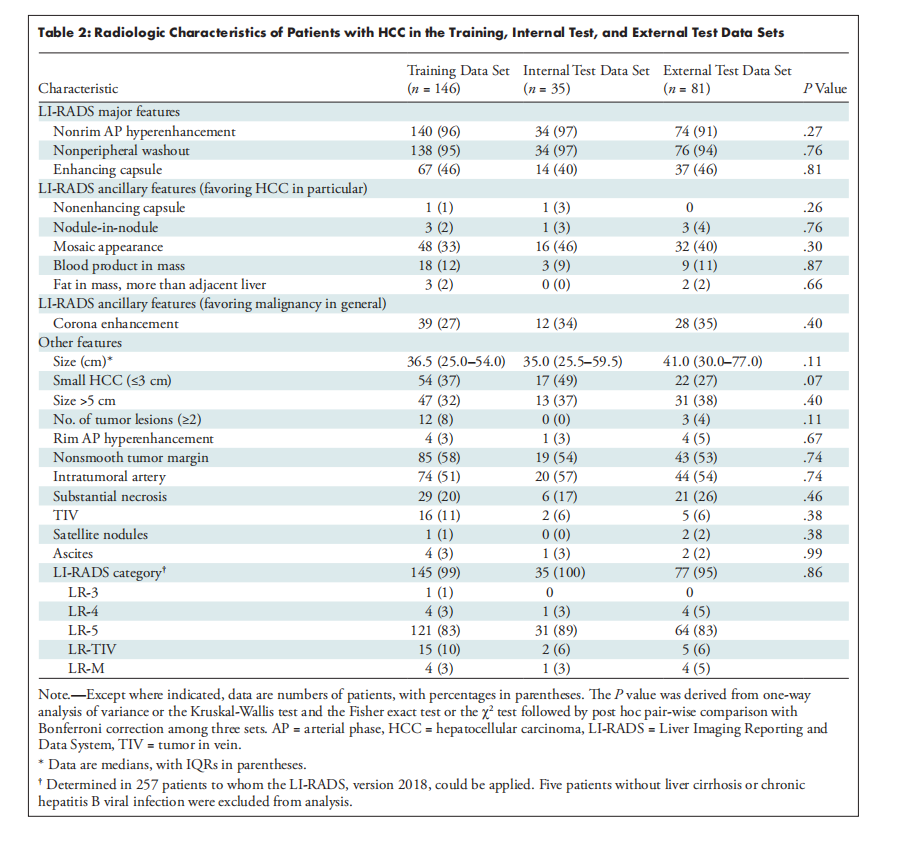
Table 2: Radiologic Characteristics of Patients with HCC in the Training, Internal Test, and External Test Data Sets
表2:训练、内部测试和外部测试数据集中患有肝细胞癌(HCC)患者的放射学特征
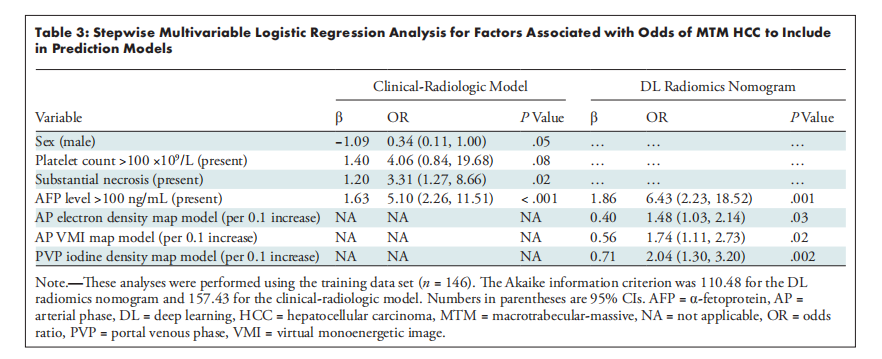
Table 3: Stepwise Multivariable Logistic Regression Analysis for Factors Associated with Odds of MTM HCC to Include *in Prediction Models
表3:用于预测模型中包含的与大梁状大块型肝细胞癌(MTM HCC)发病率相关因素的逐步多变量逻辑回归分析
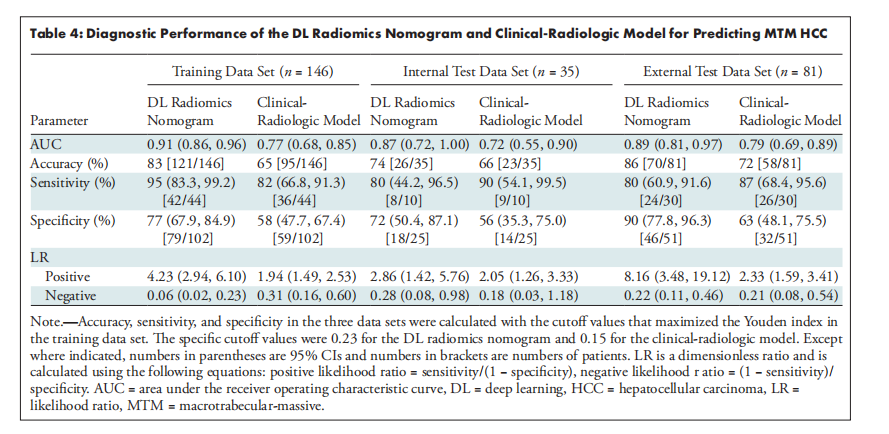
Table 4: Diagnostic Performance of the DL Radiomics Nomogram and Clinical-Radiologic Model for Predicting MTM HCC
表4:DL放射组学列线图和临床-放射学模型预测大梁状大块型肝细胞癌(MTM HCC)的诊断性能