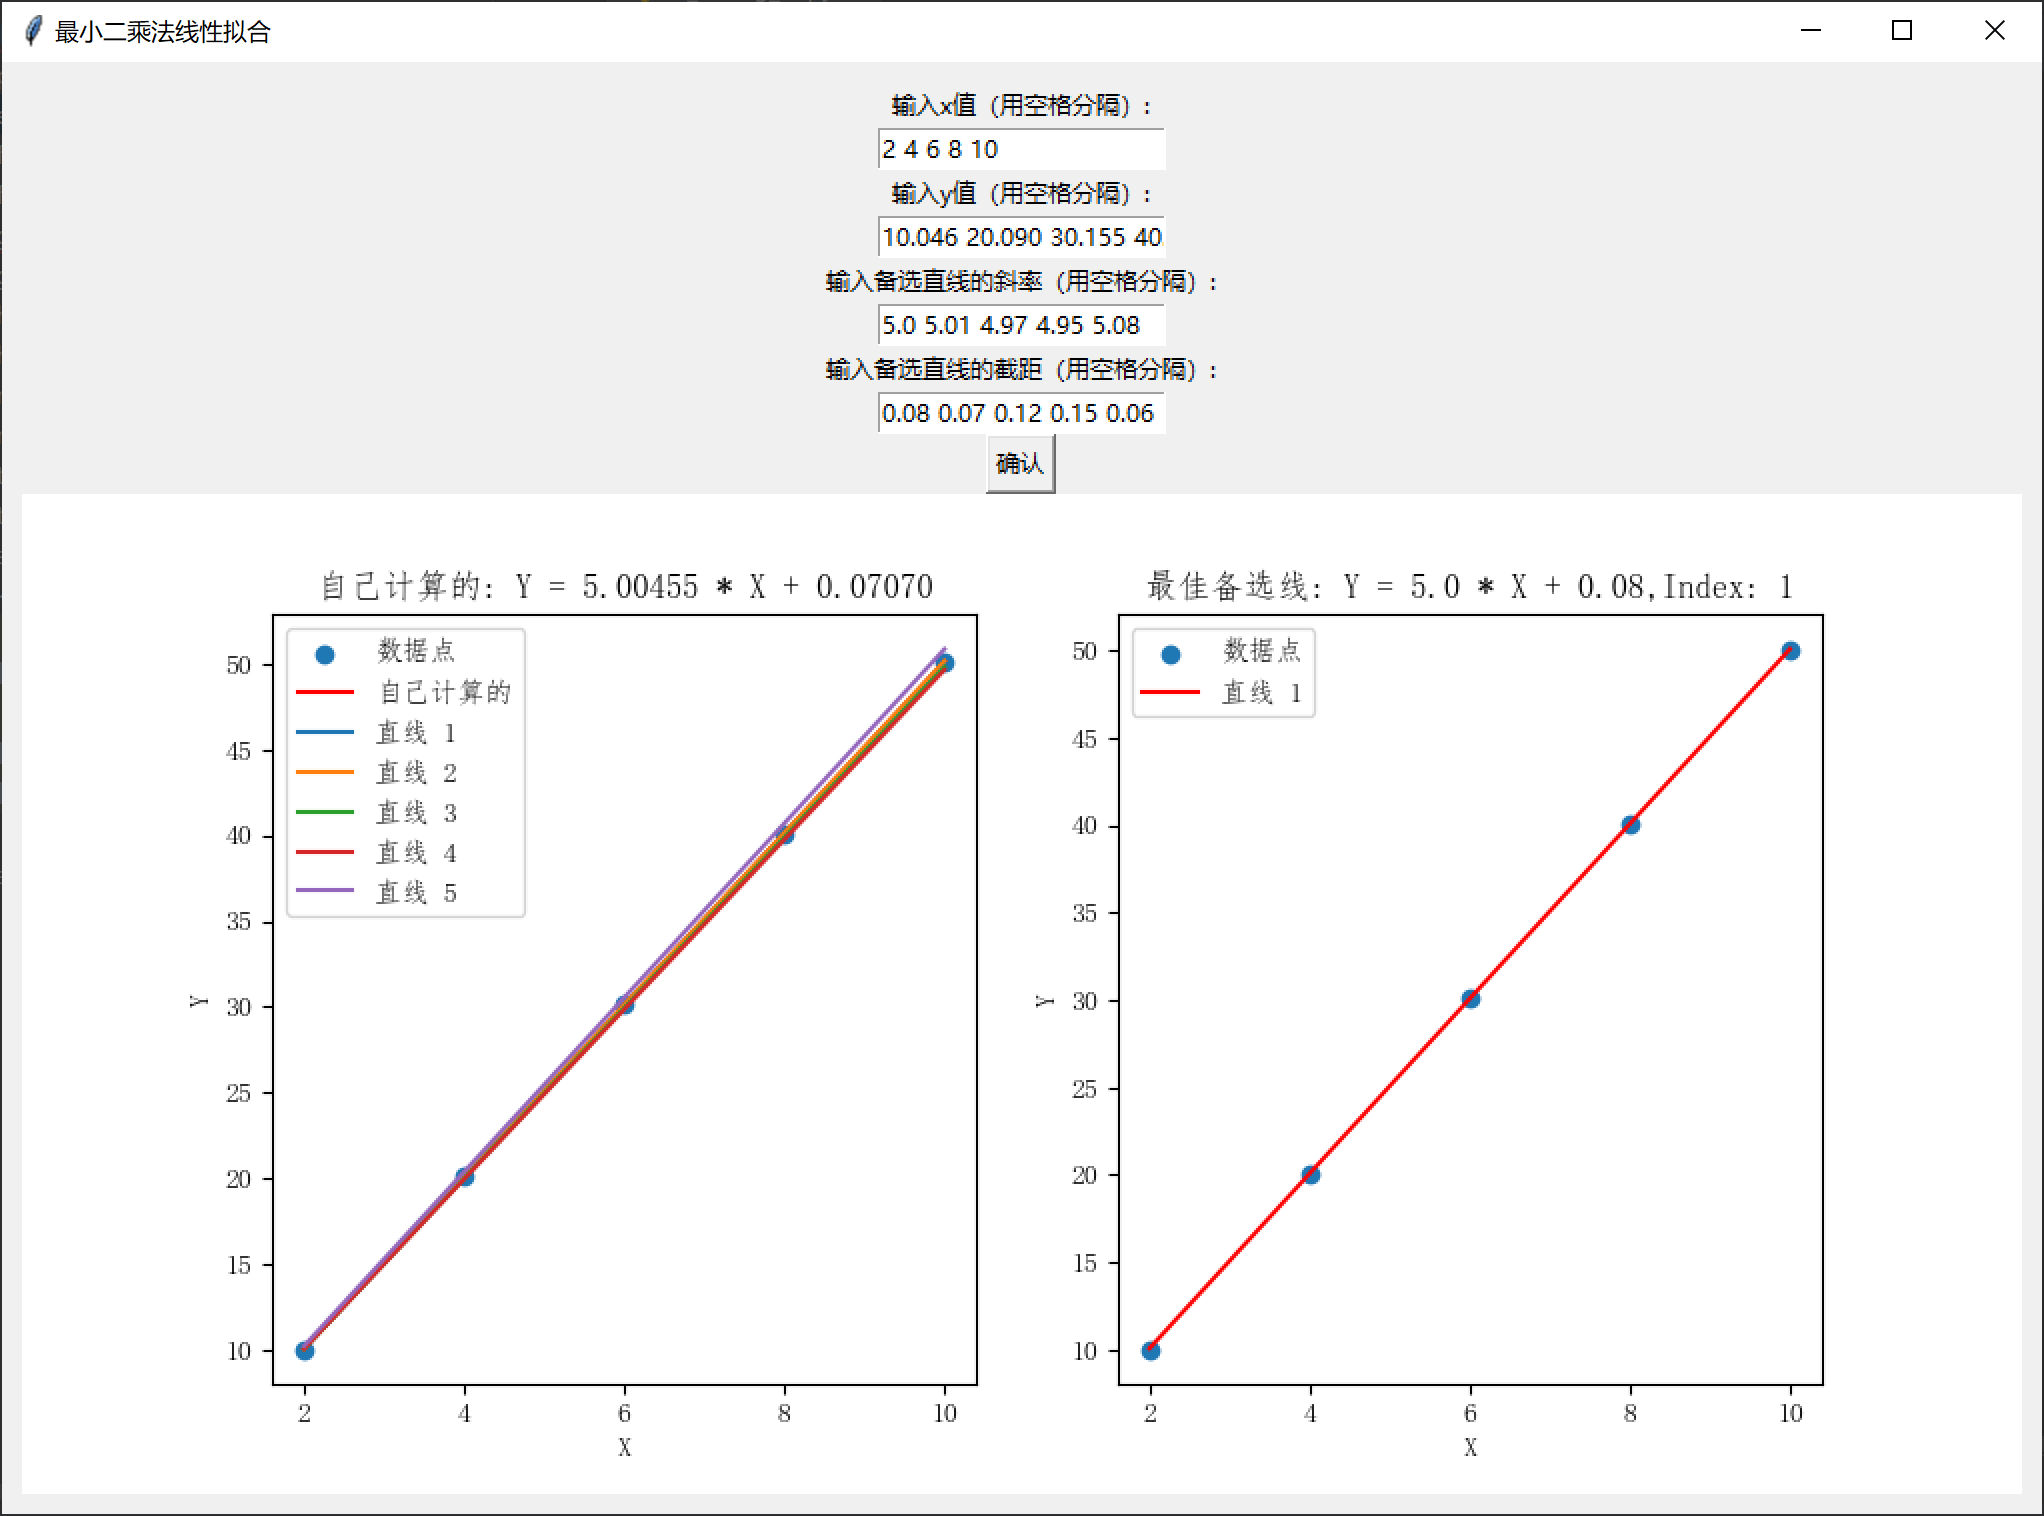
import tkinter as tk
import numpy as np
import matplotlib. pyplot as plt
from matplotlib. backends. backend_tkagg import FigureCanvasTkAgg
from pylab import mplmpl. rcParams[ 'font.sans-serif' ] = [ 'FangSong' ]
mpl. rcParams[ 'axes.unicode_minus' ] = False
def linear_regression ( ) : x_values = [ float ( x) for x in x_entry. get( ) . split( ) ] y_values = [ float ( y) for y in y_entry. get( ) . split( ) ] A = np. vstack( [ x_values, np. ones( len ( x_values) ) ] ) . Tm, c = np. linalg. lstsq( A, y_values, rcond= None ) [ 0 ] ax[ 0 ] . clear( ) ax[ 1 ] . clear( ) ax[ 0 ] . scatter( x_values, y_values, label= '数据点' ) ax[ 0 ] . plot( x_values, m * np. array( x_values) + c, 'r' , label= '自己计算的' ) ax[ 0 ] . set_title( f'自己计算的: Y = { m: .5f } * X + { c: .5f } ' ) lines_m = [ float ( m) for m in m_entry. get( ) . split( ) ] lines_c = [ float ( c) for c in c_entry. get( ) . split( ) ] for i in range ( len ( lines_m) ) : ax[ 0 ] . plot( x_values, lines_m[ i] * np. array( x_values) + lines_c[ i] , label= f'直线 { i + 1 } ' ) best_line_index = np. argmin( [ np. sum ( np. square( y_values - ( m * np. array( x_values) + c) ) ) for m, c in zip ( lines_m, lines_c) ] ) ax[ 0 ] . set_xlabel( 'X' ) ax[ 0 ] . set_ylabel( 'Y' ) ax[ 0 ] . legend( ) ax[ 1 ] . scatter( x_values, y_values, label= '数据点' ) ax[ 1 ] . plot( x_values, lines_m[ best_line_index] * np. array( x_values) + lines_c[ best_line_index] , 'r' , label= f'直线 { best_line_index + 1 } ' ) ax[ 1 ] . set_title( f'最佳备选线: Y = { lines_m[ best_line_index] } * X + { lines_c[ best_line_index] } ,Index: { best_line_index + 1 } ' ) ax[ 1 ] . set_xlabel( 'X' ) ax[ 1 ] . set_ylabel( 'Y' ) ax[ 1 ] . legend( ) canvas. draw( )
root = tk. Tk( )
root. title( '最小二乘法线性拟合' ) frame = tk. Frame( root)
frame. pack( padx= 10 , pady= 10 )
x_label = tk. Label( frame, text= '输入x值(用空格分隔):' )
x_label. pack( )
x_entry = tk. Entry( frame)
x_entry. insert( 0 , '2 4 6 8 10' )
x_entry. pack( ) y_label = tk. Label( frame, text= '输入y值(用空格分隔):' )
y_label. pack( )
y_entry = tk. Entry( frame)
y_entry. insert( 0 , '10.046 20.090 30.155 40.125 50.074' )
y_entry. pack( ) m_label = tk. Label( frame, text= '输入备选直线的斜率(用空格分隔):' )
m_label. pack( )
m_entry = tk. Entry( frame)
m_entry. insert( 0 , '5.0 5.01 4.97 4.95 5.08' )
m_entry. pack( ) c_label = tk. Label( frame, text= '输入备选直线的截距(用空格分隔):' )
c_label. pack( )
c_entry = tk. Entry( frame)
c_entry. insert( 0 , '0.08 0.07 0.12 0.15 0.06' )
c_entry. pack( )
calculate_button = tk. Button( frame, text= '确认' , command= linear_regression)
calculate_button. pack( )
fig, ax = plt. subplots( 1 , 2 , figsize= ( 10 , 5 ) )
canvas = FigureCanvasTkAgg( fig, master= frame)
canvas. get_tk_widget( ) . pack( )
canvas. draw( )
root. mainloop( ) 


