近期接到公司新需求,开发飞书小程序,并且原型中含有大量的图表,本想使用飞书内置图表组件 ——
chart-space,但官方表示已经停止维护了,无奈之下,只能另寻他路,于是乎,图表之王(文档最完整,api最透彻,社区最活跃)echarts映入我脑海中,决定就是你了!
echarts_5">下载echarts代码
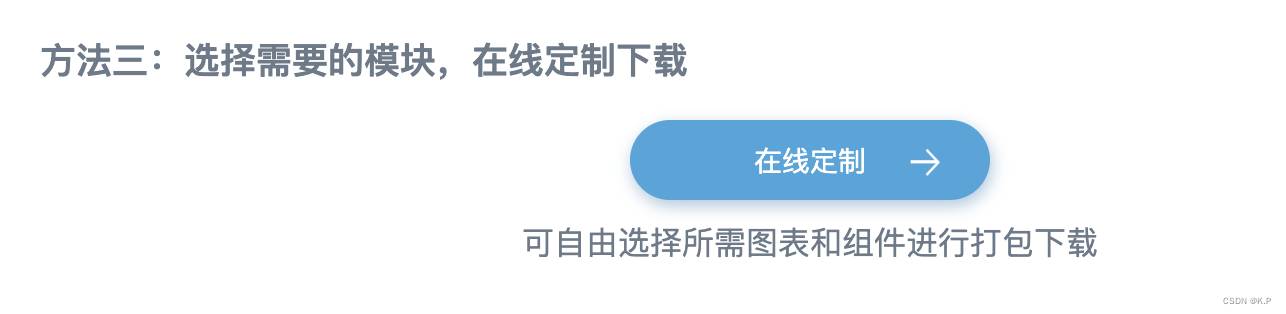
进入echarts下载地址,点击在线定制
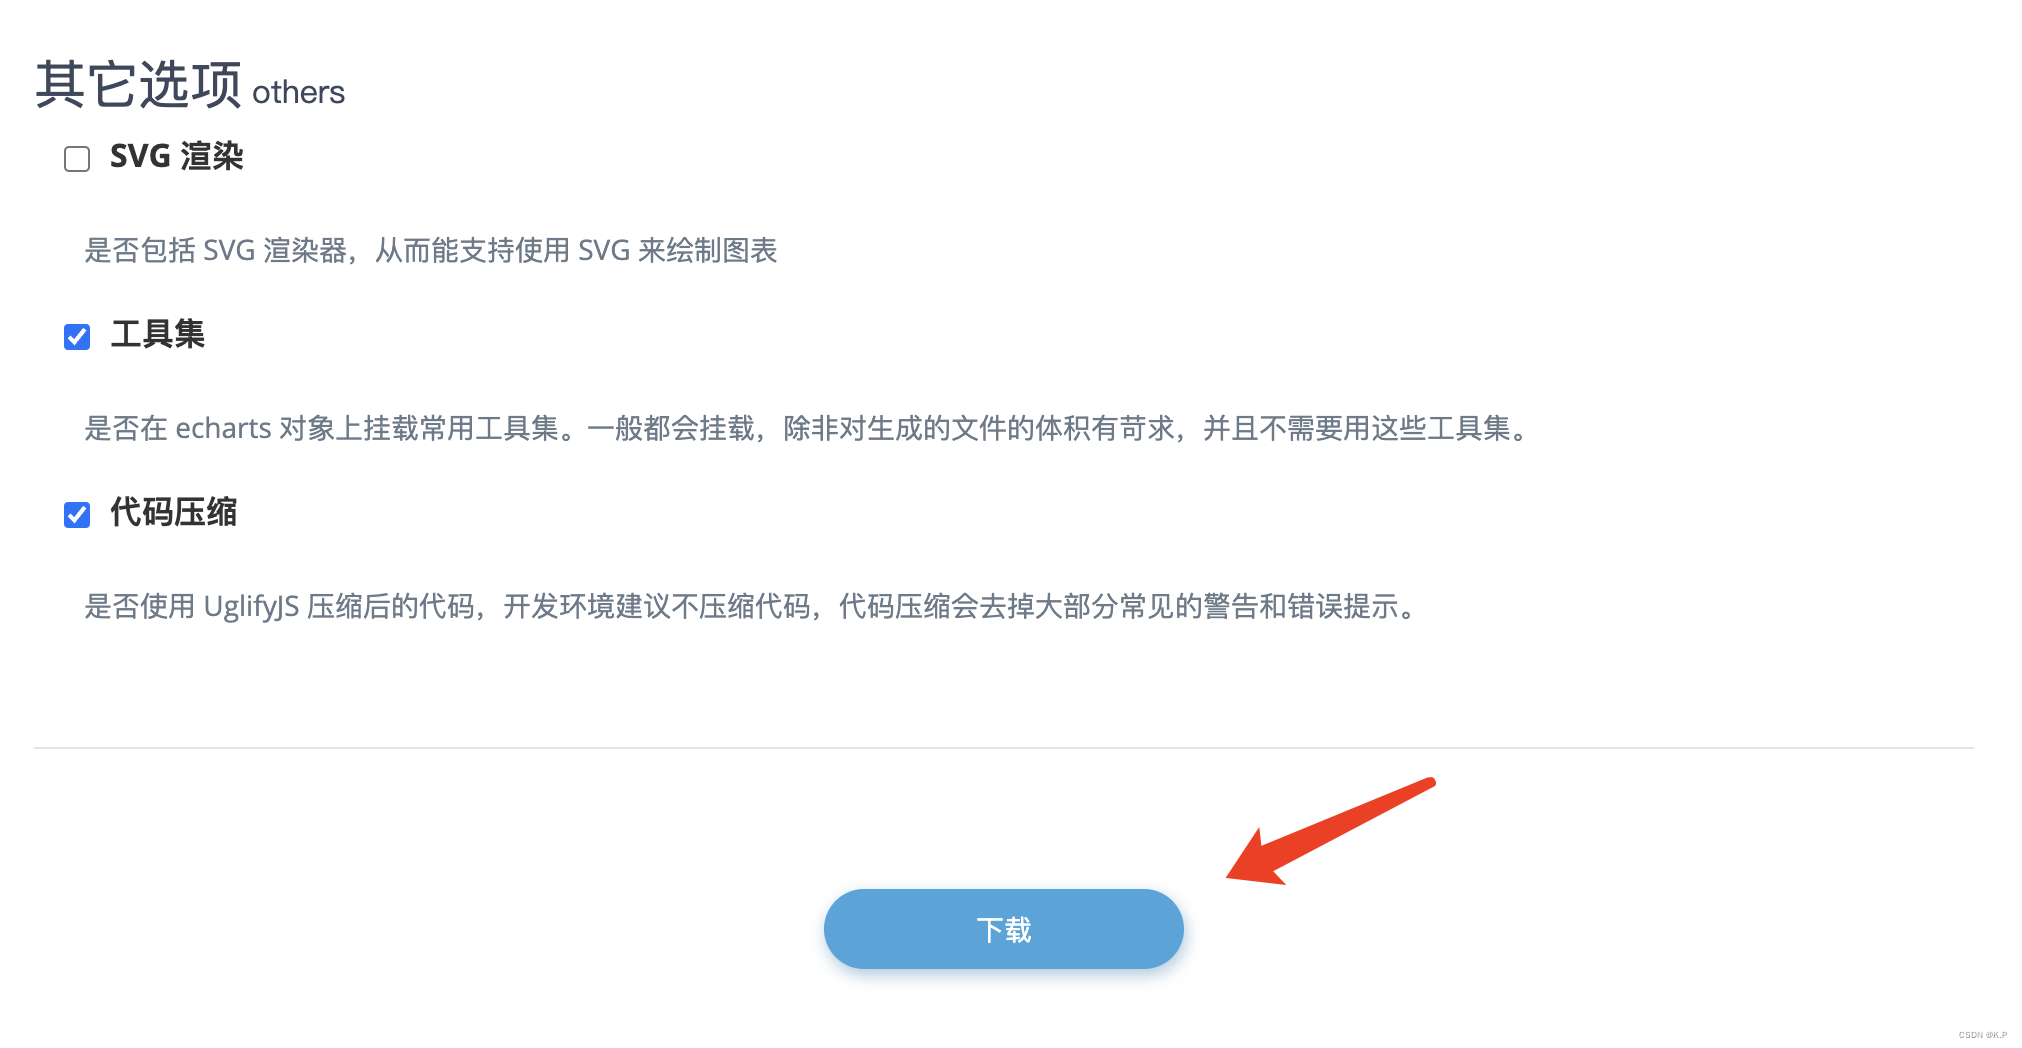
勾选你需要的图表和组件,点击下载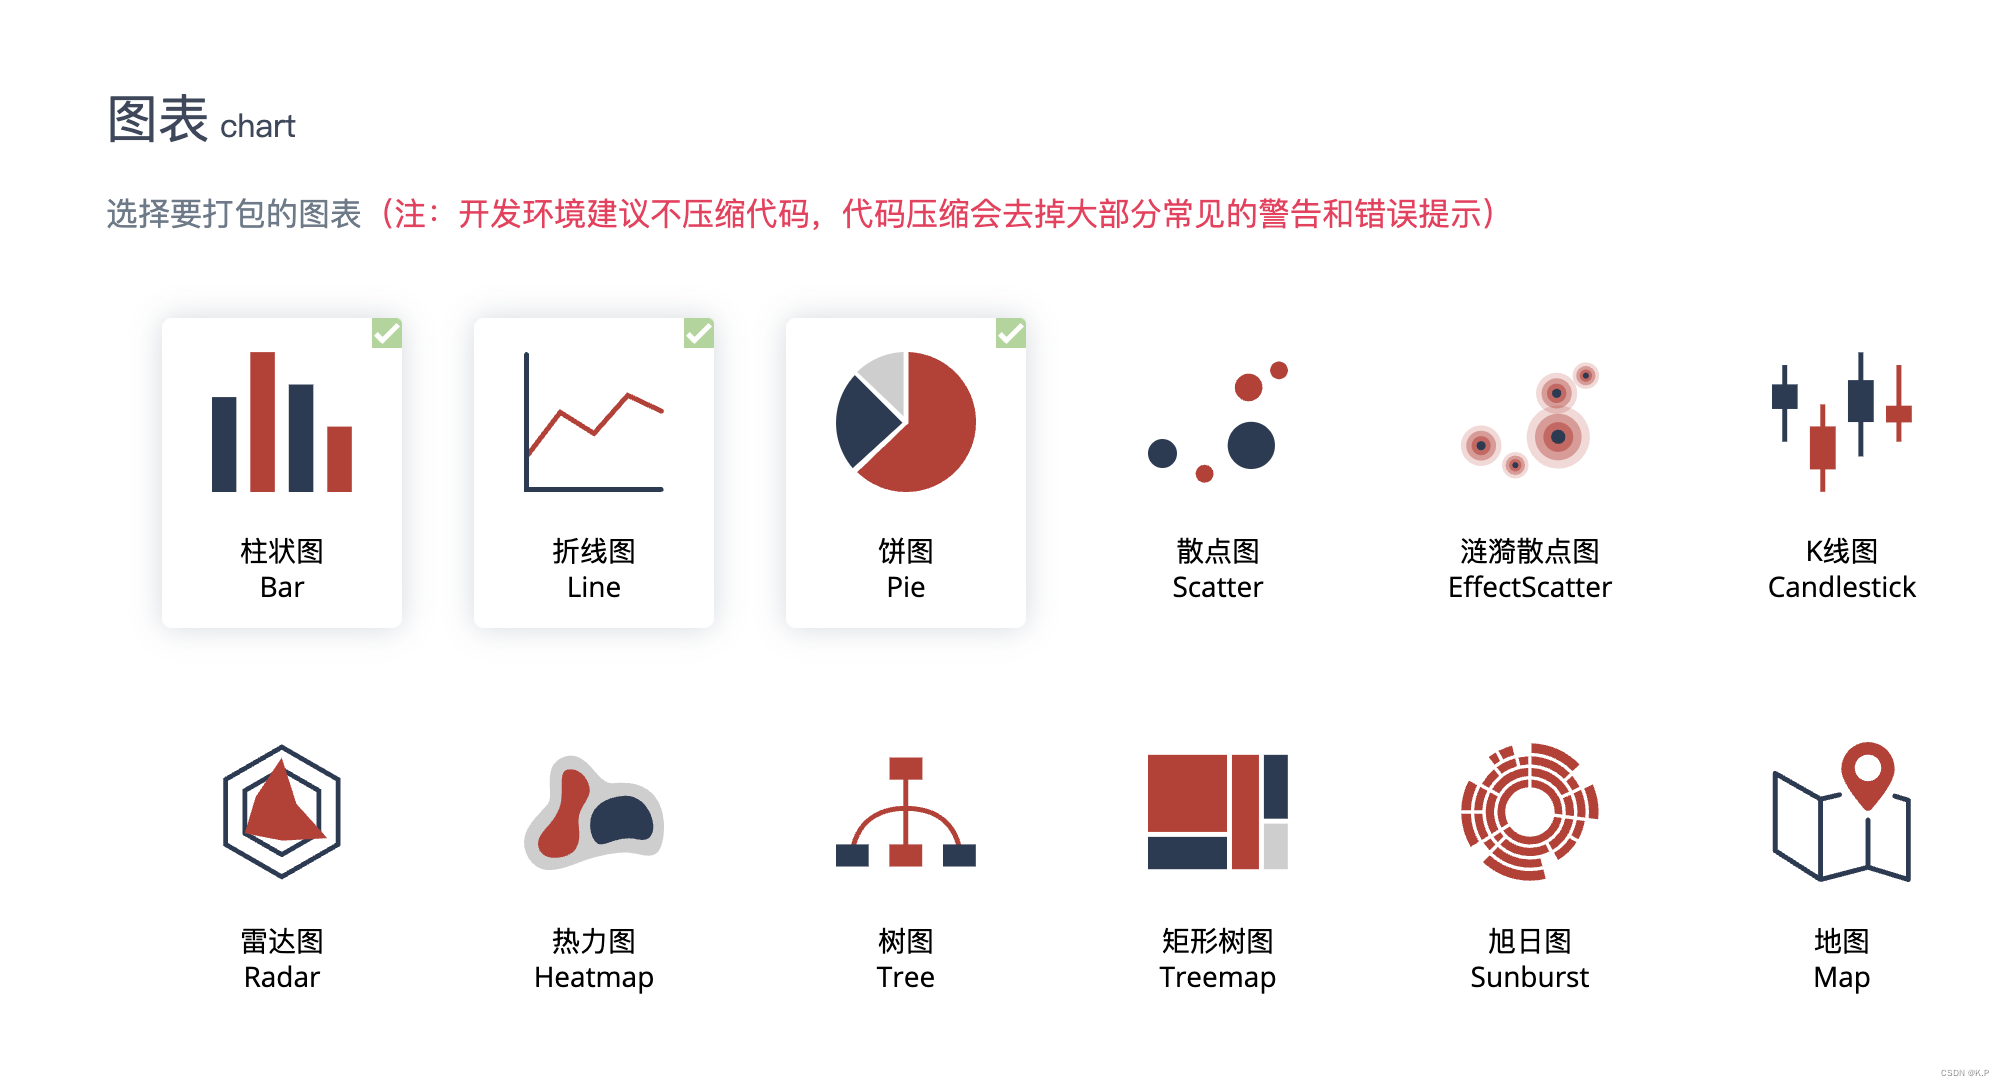
echarts_11">echarts引入项目
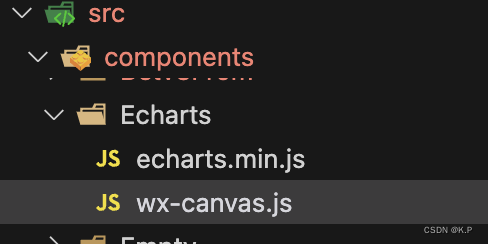
在开发项目中,components中创建Echarts文件,放入下载后的js包,并在该目录下创建wx-canvas.js,编写canvas构造函数代码,如下
export default class WxCanvas {constructor(ctx, canvasId, isNew, canvasNode) {this.ctx = ctx;this.canvasId = canvasId;this.chart = null;this.isNew = isNewif (isNew) {this.canvasNode = canvasNode;}else {this._initStyle(ctx);}// this._initCanvas(zrender, ctx);this._initEvent();}getContext(contextType) {if (contextType === '2d') {return this.ctx;}}// canvasToTempFilePath(opt) {//   if (!opt.canvasId) {//     opt.canvasId = this.canvasId;//   }//   return wx.canvasToTempFilePath(opt, this);// }setChart(chart) {this.chart = chart;}addEventListener() {// noop}attachEvent() {// noop}detachEvent() {// noop}_initCanvas(zrender, ctx) {zrender.util.getContext = function () {return ctx;};zrender.util.$override('measureText', function (text, font) {ctx.font = font || '12px sans-serif';return ctx.measureText(text);});}_initStyle(ctx) {ctx.createRadialGradient = () => {return ctx.createCircularGradient(arguments);};}_initEvent() {this.event = {};const eventNames = [{wxName: 'touchStart',ecName: 'mousedown'}, {wxName: 'touchMove',ecName: 'mousemove'}, {wxName: 'touchEnd',ecName: 'mouseup'}, {wxName: 'touchEnd',ecName: 'click'}];eventNames.forEach(name => {this.event[name.wxName] = e => {const touch = e.touches[0];this.chart.getZr().handler.dispatch(name.ecName, {zrX: name.wxName === 'tap' ? touch.clientX : touch.x,zrY: name.wxName === 'tap' ? touch.clientY : touch.y,preventDefault: () => {},stopImmediatePropagation: () => {},stopPropagation: () => {}});};});}set width(w) {if (this.canvasNode) this.canvasNode.width = w}set height(h) {if (this.canvasNode) this.canvasNode.height = h}get width() {if (this.canvasNode)return this.canvasNode.widthreturn 0}get height() {if (this.canvasNode)return this.canvasNode.heightreturn 0}
}
目录结构如下图
在Echarts文件中,创建ec-canvas.vue文件,创建canvas对象
<template><!--  // 多个echarts时将canvasId作为唯一标识,动态获取canvasId用于多个echarts可同时显示    --><canvastype="2d"class="ec-canvas":id="canvasId":canvas-id="canvasId"@touchStart="touchStart"@touchMove="touchMove"@touchEnd="touchEnd"></canvas>
</template><script lang="js">
import Taro from "@tarojs/taro";
import WxCanvas from "@/components/Echarts/wx-canvas";
import * as echarts from "@/components/Echarts/echarts.min";export default {name: "EcCanvas",props: {canvasId: {type: String,default: "",},chartData: {type: Array,default: () => [],},option: {type: Object,default: () => {}}},data() {return {}},watch: {chartData: function() {console.log('chartData', this.chartData)this.handleCreate()},},mounted() {echarts.registerPreprocessor(option => {if (option && option.series) {if (option.series.length > 0) {option.series.forEach(series => {series.progressive = 0;});} else if (typeof option.series === "object") {option.series.progressive = 0;}}})},methods: {init(callback) {this.initByNewWay(callback);},// eslint-disable-next-line complexityhandleCreate() {const option = this.optionconst v = thisv.init((canvas, width, height, canvasDpr) => {const chart = echarts.init(canvas, null, {width: width,height: height,devicePixelRatio: canvasDpr,})canvas.setChart(chart);chart.setOption(option);chart.on('click', (params) => {console.log('params', params)this.$emit('clickEChartItem', params)});return chart;})},initByNewWay(callback) {const query = Taro.createSelectorQuery();query.select(`#${this.canvasId}`) // 根据canvasId动态获取不同的echarts图表.fields({// node: true, // 飞书里面没有nodedataset: true,size: true,})// eslint-disable-next-line complexity.exec(res => {console.log('query res', res)// eslint-disable-next-line eqeqeq// if (!res || res.length == 0 || res[0] == null || res[0].node == null) {//   console.error('未获取到canvas的dom节点,请确认在页面渲染完成后或节点,taro中页面渲染完成的生命周期是useReady');//   return// }// const canvasNode = res[0].node;// this.canvasNode = canvasNode;console.log(11,this.option.height);const canvasDpr = Taro.getSystemInfoSync().pixelRatio;const canvasWidth = res[0].width;const canvasHeight = res[0].height;// const ctx = canvasNode.getContext("2d");const ctx = tt.createCanvasContext(this.canvasId)console.log('ctx', ctx)// const canvas = new WxCanvas(ctx, this.canvasId, true, canvasNode) // 不给canvasNode也可以const canvas = new WxCanvas(ctx, this.canvasId, true);echarts.setCanvasCreator(() => {return canvas;});this.chart = callback(canvas, canvasWidth, canvasHeight, canvasDpr)});},touchStart(e) {if (this.chart && e.touches.length > 0) {var touch = e.touches[0];var handler = this.chart.getZr().handler;handler.dispatch("mousedown", {zrX: touch.x,zrY: touch.y,});handler.dispatch("mousemove", {zrX: touch.x,zrY: touch.y,});handler.processGesture(this.wrapTouch(e), "start");}},touchMove(e) {if (this.chart && e.touches.length > 0) {var touch = e.touches[0];var handler = this.chart.getZr().handler;handler.dispatch("mousemove", {zrX: touch.x,zrY: touch.y,});handler.processGesture(this.wrapTouch(e), "change");}},touchEnd(e) {if (this.chart) {const touch = e.changedTouches ? e.changedTouches[0] : {};var handler = this.chart.getZr().handler;handler.dispatch("mouseup", {zrX: touch.x,zrY: touch.y,});handler.dispatch("click", {zrX: touch.x,zrY: touch.y,});handler.processGesture(this.wrapTouch(e), "end");}},wrapTouch(event) {for (let i = 0; i < event.touches.length; ++i) {const touch = event.touches[i];touch.offsetX = touch.x;touch.offsetY = touch.y;}return event;},},
};
</script><style>
.ec-canvas {width: 100%;height: 100%;min-height: 208px;flex: 1;
}
</style>echarts_313">二次封装echarts组件
使用创建的echart组件,稍微进行二次封装,大佬可以用自己的方法封装更好的,我的思路是,页面只要给echarts传入不同option,就可以进行渲染,代码如下:
// eChart.vue
<template><EcCanvas :ref="canvasId" :canvasId="canvasId" :option="option"></EcCanvas>
</template><script>
import EcCanvas from './ec-canvas.vue'
import { watch, ref, toRefs } from 'vue'export default {components: {EcCanvas,},props: {canvasId: {type: String,default: () => '',},option: {type: Object,default: () => {},},},watch: {option: {handler(value) {this.$nextTick(() => { // 没有下一帧会出现无法渲染的问题 页面没有挂载完成this.$refs[this.canvasId] && this.$refs[this.canvasId].handleCreate()})},deep: true,},},
}
</script><style lang="scss">
</style>
echarts_356">使用echarts组件渲染页面
<template>
<view class="chart"><e-chart canvasId="canvasId" :option="option"></e-chart></view></template><script>import eChart from '@/componets/Echart/eChart.vue'import { reactive}  from 'vue'export default {components: { eChart },setup() {const state =  reactive({option: {}})onMounted(async () => {// 模拟在挂载后,进行数据请求,这边我直接对option赋值// 数据来源于echarts官方实例中,最基础的柱状图state.option = {xAxis: {type: 'category',data: ['Mon', 'Tue', 'Wed', 'Thu', 'Fri', 'Sat', 'Sun']},yAxis: {type: 'value'},series: [{data: [120, 200, 150, 80, 70, 110, 130],type: 'bar'}]}})return {...toRefs(state),}}
}</script>
<style>
.chart {width: 100%;height: 300px;}
</style>
最后,需要进行各种各样的渲染与修改,可直接参看echarts官网
希望此文对大家有帮助,也请大佬不吝赐教~