前言
系列专栏:机器学习:高级应用与实践【项目实战100+】【2024】✨︎
在本专栏中不仅包含一些适合初学者的最新机器学习项目,每个项目都处理一组不同的问题,包括监督和无监督学习、分类、回归和聚类,而且涉及创建深度学习模型、处理非结构化数据以及指导复杂的模型,如卷积神经网络、门控递归单元、大型语言模型和强化学习模型
本文旨在实现一个强大的机器学习模型,该模型可以预测乳腺癌患者是良性肿瘤还是恶性肿瘤。
目录
- 1. 相关库和数据集
- 1.1 相关库介绍
- 1.2 数据集介绍
- 1.3 数据清理
- 2. 数据探索分析(可视化)
- 2.1 特征 features_mean
- 2.2 特征 features_se
- 2.3 特征 features_worst
- 3. 数据建模(XGBClassifier、SVC、DecisionTreeClassifier)
- 3.1 数据准备(拆分为训练集和测试集)
- 3.2 模型建立
- 3.3 模型评估
- 4. 总结
1. 相关库和数据集
1.1 相关库介绍
XGBClassifier、支持向量分类器和决策树分类器用于根据给定数据集中的属性预测给定患者是患有恶性肿瘤还是良性肿瘤。
Pandas– 该库有助于以 2D 数组格式加载数据框,并具有多种功能,可一次性执行分析任务。Numpy– Numpy 数组速度非常快,可以在很短的时间内执行大型计算。Matplotlib/Seaborn– 此库用于绘制可视化效果。Sklearn– 包含多个库,这些库具有预实现的功能,用于执行从数据预处理到模型开发和评估的任务。XGBoost– 包含eXtreme Gradient Boosting 机器学习算法,能帮助我们实现高精度预测。
import numpy as np
import pandas as pd
import matplotlib.pyplot as plt
import seaborn as snsfrom sklearn.model_selection import train_test_split
from sklearn.preprocessing import StandardScaler, MinMaxScalerfrom sklearn.svm import SVC
from xgboost import XGBClassifier
from sklearn.tree import DecisionTreeClassifier
from sklearn import metrics
from sklearn.metrics import accuracy_score, classification_report, confusion_matrix, ConfusionMatrixDisplayimport warnings
warnings.filterwarnings('ignore')
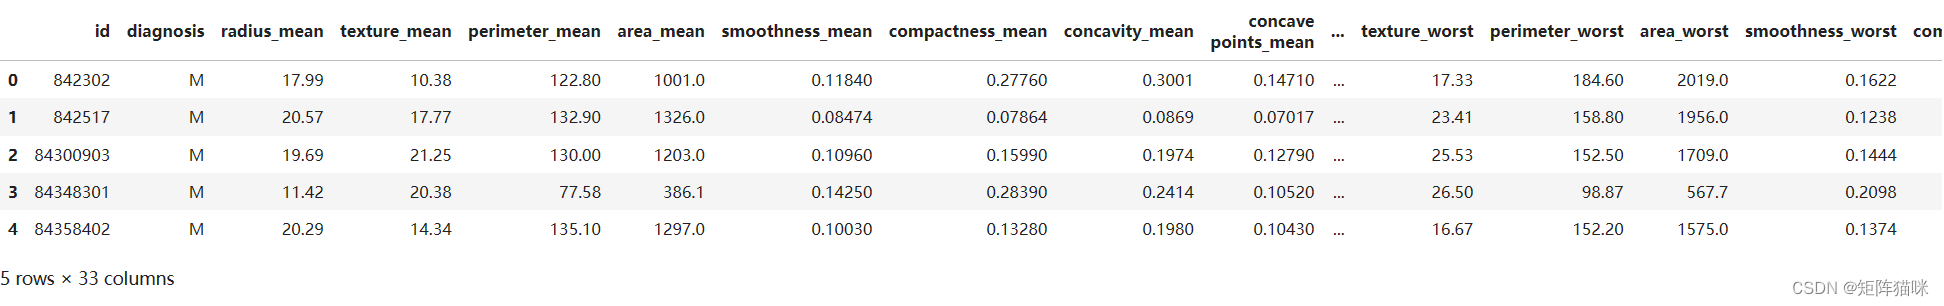
1.2 数据集介绍
我们将在此处使用的UCI机器学习存储库中的数据集,它是患有恶性和良性肿瘤的乳腺癌患者的数据集。这些列中的值是其他一些诊断的一部分,这些诊断通常用于捕获健康人与受影响的人之间的差异。现在,让我们将数据集加载到Pandas的数据框中。
data = pd.read_table('wdbc.data', sep=',', header=None, names=['id', 'diagnosis', 'radius_mean', 'texture_mean', 'perimeter_mean','area_mean', 'smoothness_mean', 'compactness_mean', 'concavity_mean','concave points_mean', 'symmetry_mean', 'fractal_dimension_mean','radius_se', 'texture_se', 'perimeter_se', 'area_se', 'smoothness_se','compactness_se', 'concavity_se', 'concave points_se', 'symmetry_se','fractal_dimension_se', 'radius_worst', 'texture_worst','perimeter_worst', 'area_worst', 'smoothness_worst','compactness_worst', 'concavity_worst', 'concave points_worst','symmetry_worst', 'fractal_dimension_worst', 'Unnamed: 32'])
data.head()
由于数据集的维度比较高。让我们检查数据集的哪一列包含哪种类型的数据。
df.info()
输出
<class 'pandas.core.frame.DataFrame'>
RangeIndex: 569 entries, 0 to 568
Data columns (total 33 columns):#   Column                   Non-Null Count  Dtype
---  ------                   --------------  -----  0   id                       569 non-null    int64  1   diagnosis                569 non-null    object 2   radius_mean              569 non-null    float643   texture_mean             569 non-null    float644   perimeter_mean           569 non-null    float645   area_mean                569 non-null    float646   smoothness_mean          569 non-null    float647   compactness_mean         569 non-null    float648   concavity_mean           569 non-null    float649   concave points_mean      569 non-null    float6410  symmetry_mean            569 non-null    float6411  fractal_dimension_mean   569 non-null    float6412  radius_se                569 non-null    float6413  texture_se               569 non-null    float6414  perimeter_se             569 non-null    float6415  area_se                  569 non-null    float6416  smoothness_se            569 non-null    float6417  compactness_se           569 non-null    float6418  concavity_se             569 non-null    float6419  concave points_se        569 non-null    float6420  symmetry_se              569 non-null    float6421  fractal_dimension_se     569 non-null    float6422  radius_worst             569 non-null    float6423  texture_worst            569 non-null    float6424  perimeter_worst          569 non-null    float6425  area_worst               569 non-null    float6426  smoothness_worst         569 non-null    float6427  compactness_worst        569 non-null    float6428  concavity_worst          569 non-null    float6429  concave points_worst     569 non-null    float6430  symmetry_worst           569 non-null    float6431  fractal_dimension_worst  569 non-null    float6432  Unnamed: 32              0 non-null      float64
dtypes: float64(31), int64(1), object(1)
memory usage: 146.8+ KB.4 MB
根据上述有关每列数据的信息,我们可以观察到没有空值。
data.diagnosis.unique()
输出
array(['M', 'B'], dtype=object)
1.3 数据清理
从主要来源获得的数据被称为原始数据,需要大量的预处理,然后才能从中得出任何结论或对其进行一些建模。这些预处理步骤称为数据清理,它包括异常值删除、空值插补以及删除数据输入中的任何类型的差异。我们将删除列 ‘id’ 和 ‘Unnamed: 32’,因为它们在预测中没有作用
features = data.drop(['Unnamed: 32', 'id', 'diagnosis'], axis = 1) # diagnosis为target列
data.diagnosis = [1 if each == "M" else 0 for each in data.diagnosis]
target = data['diagnosis']
2. 数据探索分析(可视化)
这些特征如果要探索其相关性,可以借助seaborn可视化工具进行探索。在下面的代码块中,实现了一个热力图表,可以大略看出数据之间的高度相关特征。
fig = plt.figure(figsize=(20,20), dpi=250)
sns.heatmap(features.corr(), cmap="Blues", annot=True)
输出

2.1 特征 features_mean
fig = plt.figure(figsize=(10,5), dpi=250)
sns.heatmap(data[features_mean].corr(), cmap=sns.cubehelix_palette(dark=.20, light=.95, as_cmap=True), annot=True)
输出

2.2 特征 features_se
接下来,让我们检查一下数据集features_se的相关性。
fig = plt.figure(figsize=(10,5), dpi=250)
sns.heatmap(data[features_se].corr(), cmap=sns.cubehelix_palette(dark=.20, light=.95, as_cmap=True), annot=True)
输出

2.3 特征 features_worst
接下来,检查一下数据集features_worst的相关性。

3. 数据建模(XGBClassifier、SVC、DecisionTreeClassifier)
3.1 数据准备(拆分为训练集和测试集)
X_train, X_val,\Y_train, Y_val = train_test_split(features, target,test_size=0.2,random_state=10)
X_train.shape, X_val.shape
输出
((455, 30), (114, 30))
3.2 模型建立
models = [XGBClassifier(), SVC(kernel='rbf'), DecisionTreeClassifier(random_state=42)]# 循环遍历每个分类器
for i in range(len(models)):# 训练分类器models[i].fit(X_train, Y_train)# 在验证集上进行预测val_preds = models[i].predict(X_val)# 计算混淆矩阵#cm = confusion_matrix(Y_val, Y_pred)# 显示混淆矩阵metrics.ConfusionMatrixDisplay.from_estimator(models[i], X_val, Y_val, cmap=sns.cubehelix_palette(dark=.20, light=.95, as_cmap=True))plt.title(f'Confusion Matrix for {models[i].__class__.__name__}')plt.show()print(f'{models[i]} : ')print('Validation Accuracy : ', accuracy_score(Y_val, val_preds))print(metrics.classification_report(Y_val, models[i].predict(X_val)))
3.3 模型评估
让我们使用XGBClassifier、SVC、DecisionTreeClassifier为验证数据绘制混淆矩阵。

4. 总结
从上述准确度来看,我们可以说XGBClassifier在验证数据上的准确率表现更好,高达97%。
完整源码:机器学习:基于Sklearn、XGBoost框架,使用XGBClassifier、支持向量分类器和决策树分类器预测乳腺癌是良性还是恶性【源码】✨︎