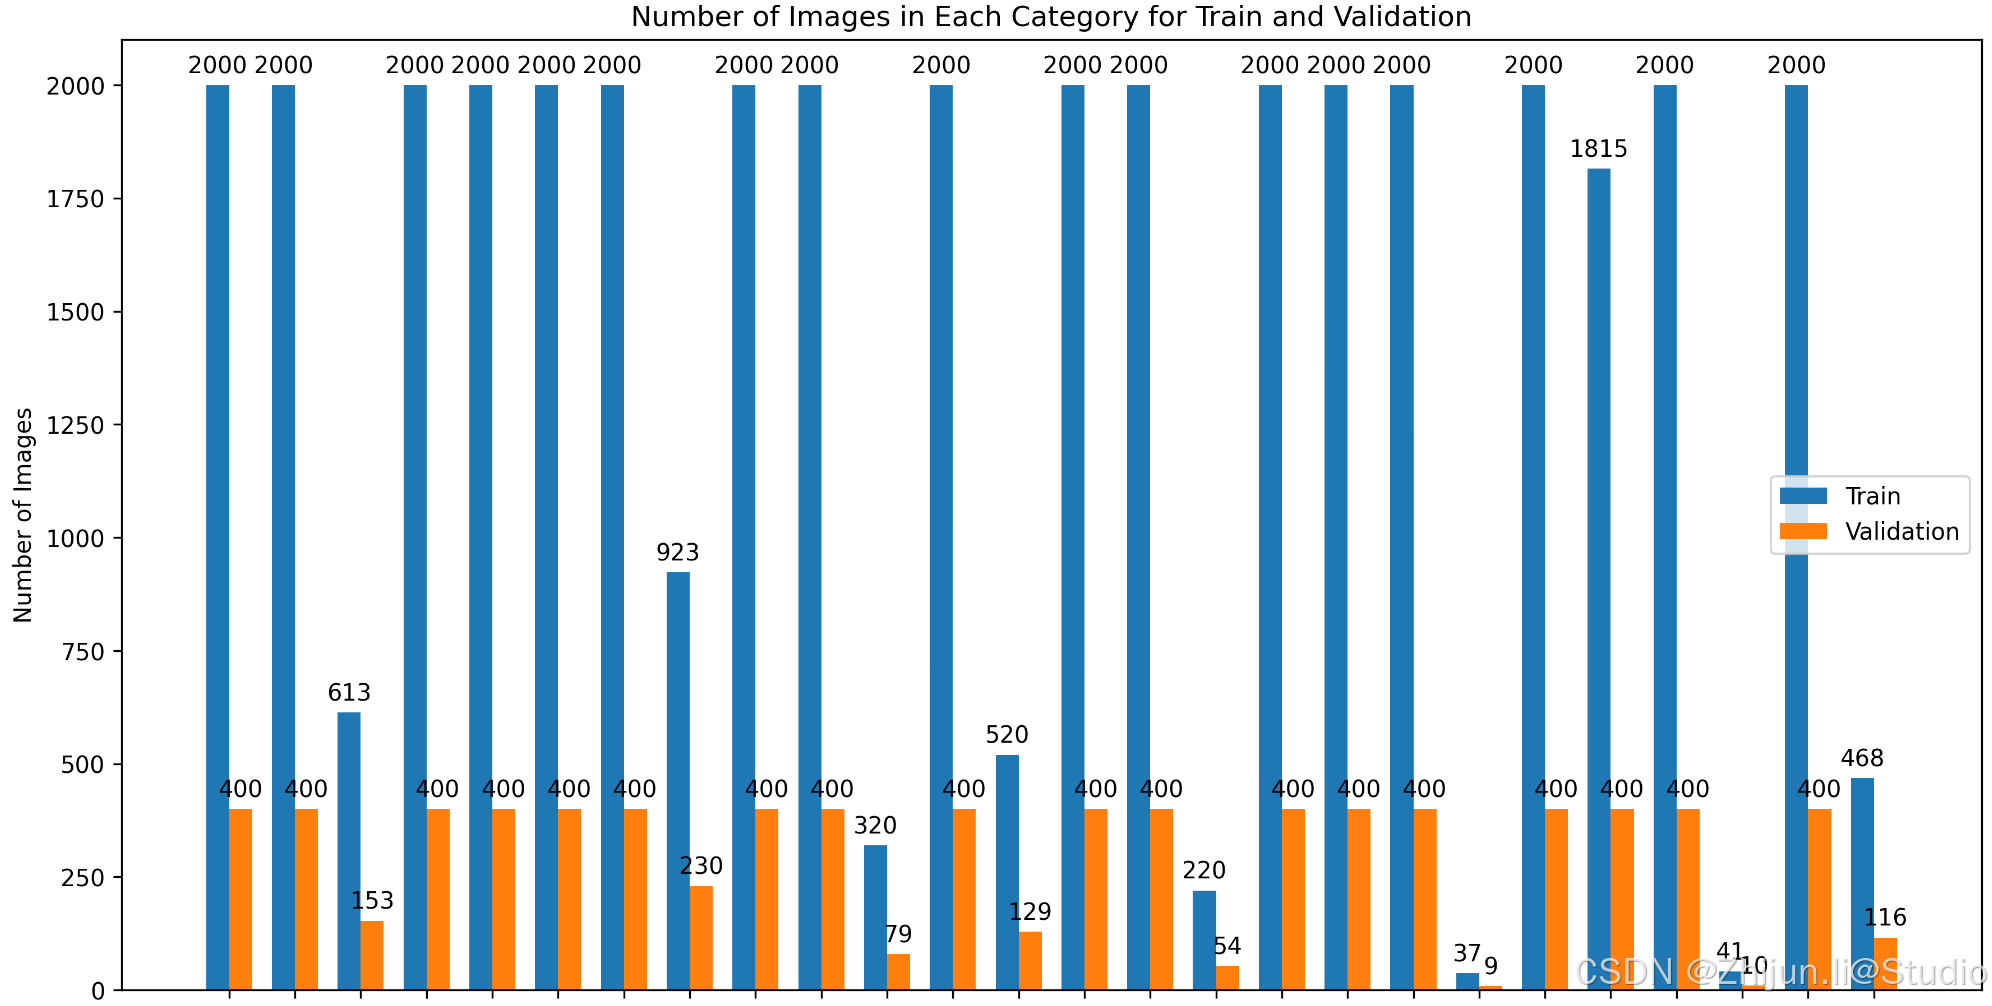
图像分类时,如果某个类别或者某些类别的数量远大于其他类别的话,模型在计算的时候,更倾向于拟合数量更多的类别;因此,观察类别数量以及对数据量多的类别进行截断是很有必要的。
1.准备数据
数据的格式为图像分类数据集格式,根目录下分为train和val文件夹,每个文件夹下以类别名命名的子文件夹:
.
├── ./datasets
│ ├── ./datasets/train/A
│ │ ├── ./datasets/train/A/1.jpg
│ │ ├── ./datasets/train/A/2.jpg
│ │ ├── ./datasets/train/A/3.jpg
│ │ ├── …
│ ├── ./datasets/train/B
│ │ ├── ./datasets/train/B/1.jpg
│ │ ├── ./datasets/train/B/1.jpg
│ │ ├── ./datasets/train/B/1.jpg
│ │ ├── …
│ ├── ./datasets/val/A
│ │ ├── ./datasets/val/A/1.jpg
│ │ ├── ./datasets/val/A/2.jpg
│ │ ├── ./datasets/val/A/3.jpg
│ │ ├── …
│ ├── ./datasets/val/B
│ │ ├── ./datasets/val/B/1.jpg
│ │ ├── ./datasets/val/B/1.jpg
│ │ ├── ./datasets/val/B/1.jpg
│ │ ├── …
2.查看数据分布
import os
import matplotlib.pyplot as plt
import numpy as np
import pandas as pddef count_images(directory, image_extensions):"""统计每个子文件夹中的图像数量。:param directory: 主目录路径(train或val):param image_extensions: 允许的图像文件扩展名元组:return: 一个字典,键为类别名,值为图像数量"""counts = {}if not os.path.exists(directory):print(f"目录不存在: {directory}")return countsfor class_name in os.listdir(directory):class_path = os.path.join(directory, class_name)if os.path.isdir(class_path):# 统计符合扩展名的文件数量image_count = sum(1 for file in os.listdir(class_path)if file.lower().endswith(image_extensions))counts[class_name] = image_countreturn countsdef count_images_in_single_directory(directory, image_extensions):"""统计单个目录下每个类别的图像数量。:param directory: 主目录路径:param image_extensions: 允许的图像文件扩展名元组:return: 一个字典,键为类别名,值为图像数量"""counts = {}if not os.path.exists(directory):print(f"目录不存在: {directory}")return countsfor class_name in os.listdir(directory):class_path = os.path.join(directory, class_name)if os.path.isdir(class_path):image_count = sum(1 for file in os.listdir(class_path)if file.lower().endswith(image_extensions))counts[class_name] = image_countreturn countsdef autolabel(ax, rects):"""在每个柱状图上方添加数值标签。:param ax: Matplotlib 的轴对象:param rects: 柱状图对象"""for rect in rects:height = rect.get_height()ax.annotate(f'{height}',xy=(rect.get_x() + rect.get_width() / 2, height),xytext=(0, 3),  # 3 points vertical offsettextcoords="offset points",ha='center', va='bottom')def plot_distribution(all_classes, train_values, val_values, output_path, has_val=False):"""绘制并保存训练集和验证集中每个类别的图像数量分布柱状图。如果没有验证集数据,则只绘制训练集数据。:param all_classes: 所有类别名称列表:param train_values: 训练集中每个类别的图像数量列表:param val_values: 验证集中每个类别的图像数量列表(如果有的话):param output_path: 保存图表的文件路径:param has_val: 是否包含验证集数据"""x = np.arange(len(all_classes))  # 类别位置width = 0.35  # 柱状图的宽度fig, ax = plt.subplots(figsize=(12, 8))if has_val:rects1 = ax.bar(x - width/2, train_values, width, label='Train')rects2 = ax.bar(x + width/2, val_values, width, label='Validation')else:rects1 = ax.bar(x, train_values, width, label='Count')# 添加一些文本标签ax.set_xlabel('Category')ax.set_ylabel('Number of Images')title = 'Number of Images in Each Category for Train and Validation' if has_val else 'Number of Images in Each Category'ax.set_title(title)ax.set_xticks(x)ax.set_xticklabels(all_classes, rotation=45, ha='right')ax.legend() if has_val else ax.legend(['Count'])# 自动标注柱状图上的数值autolabel(ax, rects1)if has_val:autolabel(ax, rects2)fig.tight_layout()# 保存图表为图片文件plt.savefig(output_path, dpi=300, bbox_inches='tight')print(f"图表已保存到 {output_path}")def compute_and_display_statistics(counts_dict, dataset_name, save_csv=False):"""计算并展示统计数据,包括总图像数量、类别数量、平均每个类别的图像数量和类别占比。:param counts_dict: 类别名称与图像数量的字典:param dataset_name: 数据集名称(例如 'Train', 'Validation', 'Dataset'):param save_csv: 是否保存统计结果为 CSV 文件"""total_images = sum(counts_dict.values())num_classes = len(counts_dict)avg_per_class = total_images / num_classes if num_classes > 0 else 0# 计算每个类别的占比category_proportions = {cls: (count / total_images * 100) if total_images > 0 else 0 for cls, count in counts_dict.items()}# 创建 DataFramedf = pd.DataFrame({'类别名称': list(counts_dict.keys()),'图像数量': list(counts_dict.values()),'占比 (%)': [f"{prop:.2f}" for prop in category_proportions.values()]})# 排序 DataFrame 按图像数量降序df = df.sort_values(by='图像数量', ascending=False)print(f"\n===== {dataset_name} 数据统计 =====")print(df.to_string(index=False))print(f"总图像数量: {total_images}")print(f"类别数量: {num_classes}")print(f"平均每个类别的图像数量: {avg_per_class:.2f}")# 根据 save_csv 参数决定是否保存为 CSV 文件if save_csv:# 将数据集名称转换为小写并去除空格,以作为文件名的一部分sanitized_name = dataset_name.lower().replace(" ", "_").replace("(", "").replace(")", "")csv_filename = f"{sanitized_name}_statistics.csv"df.to_csv(csv_filename, index=False, encoding='utf-8-sig')print(f"统计表已保存为 {csv_filename}\n")def main():# ================== 配置参数 ==================# 设置数据集的根目录路径dataset_root = 'datasets/device_cls_merge_manual_with_21w_1218'  # 替换为你的数据集路径# 定义train和val目录train_dir = os.path.join(dataset_root, 'train')val_dir = os.path.join(dataset_root, 'val')# 定义允许的图像文件扩展名image_extensions = ('.jpg', '.jpeg', '.png', '.bmp', '.gif')# 输出图表的路径output_path = 'dataset_distribution.png'  # 你可以更改为你想要的文件名和路径# 是否保存统计结果为 CSV 文件(默认不保存)SAVE_CSV = False  # 设置为 True 以启用保存 CSV# ================== 统计图像数量 ==================has_train = os.path.exists(train_dir) and os.path.isdir(train_dir)has_val = os.path.exists(val_dir) and os.path.isdir(val_dir)if has_train and has_val:print("检测到 'train' 和 'val' 目录。统计训练集和验证集中的图像数量...")train_counts = count_images(train_dir, image_extensions)val_counts = count_images(val_dir, image_extensions)# 获取所有类别的名称(确保train和val中的类别一致)all_classes = sorted(list(set(train_counts.keys()) | set(val_counts.keys())))# 准备绘图数据train_values = [train_counts.get(cls, 0) for cls in all_classes]val_values = [val_counts.get(cls, 0) for cls in all_classes]# ================== 计算并展示统计数据 ==================compute_and_display_statistics(train_counts, '训练集 (Train)', save_csv=SAVE_CSV)compute_and_display_statistics(val_counts, '验证集 (Validation)', save_csv=SAVE_CSV)# ================== 绘制并保存图表 ==================print("绘制并保存训练集和验证集的图表...")plot_distribution(all_classes, train_values, val_values, output_path, has_val=True)else:print("未检测到 'train' 和 'val' 目录。将统计主目录下的图像数量...")# 如果没有train和val目录,则统计主目录下的图像分布main_counts = count_images_in_single_directory(dataset_root, image_extensions)# 获取所有类别的名称all_classes = sorted(main_counts.keys())# 准备绘图数据main_values = [main_counts.get(cls, 0) for cls in all_classes]# 定义输出图表路径(可以区分不同的输出文件名)output_path_single = 'dataset_distribution_single.png'  # 或者使用与train_val相同的output_path# ================== 计算并展示统计数据 ==================compute_and_display_statistics(main_counts, '数据集 (Dataset)', save_csv=SAVE_CSV)# ================== 绘制并保存图表 ==================print("绘制并保存主目录的图表...")plot_distribution(all_classes, main_values, [], output_path_single, has_val=False)if __name__ == "__main__":main()
下图为原始数据集运行结果,可以看到数据存在严重不均衡问题

3.数据截断
import os
import shutil
import randomdef count_images(directory, image_extensions):"""统计每个子文件夹中的图像文件路径列表。:param directory: 主目录路径(train或val):param image_extensions: 允许的图像文件扩展名列表:return: 一个字典,键为类别名,值为图像文件路径列表"""counts = {}if not os.path.exists(directory):print(f"目录不存在: {directory}")return countsfor class_name in os.listdir(directory):class_path = os.path.join(directory, class_name)if os.path.isdir(class_path):# 获取符合扩展名的文件列表images = [file for file in os.listdir(class_path)if file.lower().endswith(tuple(image_extensions))]image_paths = [os.path.join(class_path, img) for img in images]counts[class_name] = image_pathsreturn countsdef truncate_dataset(class_images, threshold, seed=42):"""对每个类别的图像进行截断,如果超过阈值则随机选择一定数量的图像。:param class_images: 一个字典,键为类别名,值为图像文件路径列表:param threshold: 每个类别的图像数量阈值:param seed: 随机种子:return: 截断后的类别图像字典"""truncated = {}random.seed(seed)for class_name, images in class_images.items():if len(images) > threshold:truncated_images = random.sample(images, threshold)truncated[class_name] = truncated_imagesprint(f"类别 '{class_name}' 超过阈值 {threshold},已随机选择 {threshold} 张图像。")else:truncated[class_name] = imagesprint(f"类别 '{class_name}' 不超过阈值 {threshold},保留所有 {len(images)} 张图像。")return truncateddef copy_images(truncated_data, subset, output_root):"""将截断后的图像复制到输出目录,保持原有的目录结构。:param truncated_data: 截断后的类别图像字典:param subset: 'train' 或 'val':param output_root: 输出根目录路径"""for class_name, images in truncated_data.items():dest_dir = os.path.join(output_root, subset, class_name)os.makedirs(dest_dir, exist_ok=True)for img_path in images:img_name = os.path.basename(img_path)dest_path = os.path.join(dest_dir, img_name)shutil.copy2(img_path, dest_path)print(f"'{subset}' 子集已复制到 {output_root}")def main():"""主函数,执行数据集截断和复制操作。"""# ================== 配置参数 ==================# 原始数据集根目录路径input_dir = 'datasets/device_cls_merge_manual_with_21w_1218_train_val_224'  # 替换为你的原始数据集路径# 截断后数据集的输出根目录路径output_dir = 'datasets/device_cls_merge_manual_with_21w_1218_train_val_224_truncate'  # 替换为你希望保存截断后数据集的路径# 训练集每个类别的图像数量阈值train_threshold = 2000  # 设置为你需要的训练集阈值# 验证集每个类别的图像数量阈值val_threshold = 400  # 设置为你需要的验证集阈值# 允许的图像文件扩展名image_extensions = ['.jpg', '.jpeg', '.png', '.bmp', '.gif', '.tiff']# 随机种子以确保可重复性random_seed = 42# ================== 脚本实现 ==================# 设置随机种子random.seed(random_seed)# 定义train和val目录路径train_input_dir = os.path.join(input_dir, 'train')val_input_dir = os.path.join(input_dir, 'val')# 统计train和val中的图像print("统计训练集中的图像数量...")train_counts = count_images(train_input_dir, image_extensions)print("统计验证集中的图像数量...")val_counts = count_images(val_input_dir, image_extensions)# 截断train和val中的图像print("\n截断训练集中的图像...")truncated_train = truncate_dataset(train_counts, train_threshold, random_seed)print("\n截断验证集中的图像...")truncated_val = truncate_dataset(val_counts, val_threshold, random_seed)# 复制截断后的图像到输出目录print("\n复制截断后的训练集图像...")copy_images(truncated_train, 'train', output_dir)print("复制截断后的验证集图像...")copy_images(truncated_val, 'val', output_dir)print("\n数据集截断完成。")if __name__ == "__main__":main()
再次查看已经符合截断后的数据分布了


