ELK概述
ELK是一套开源的日志分析系统,由elasticsearch+logstash+Kibana组成。
官网说明:https://www.elastic.co/cn/products
首先: 先一句话简单了解E,L,K这三个软件
elasticsearch: 分布式搜索引擎
logstash: 日志收集与过滤,输出给elasticsearch
Kibana: 图形化展示

elk下载地址:https://www.elastic.co/cn/downloads
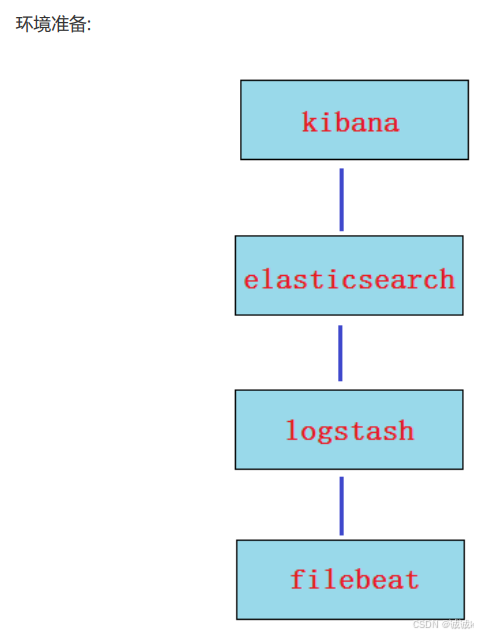
环境准备,四台主机
主机名及主机名绑定
[root@vm1 ~]# cat /etc/hosts
127.0.0.1   localhost localhost.localdomain localhost4 localhost4.localdomain4
::1         localhost localhost.localdomain localhost6 localhost6.localdomain6
192.168.100.10	vm1.cluster.com	kibana
192.168.100.20	vm2.cluster.com	elasticsearch
192.168.100.30	vm2.cluster.com	logstash
192.168.100.50	vm2.cluster.com	filebeat传到各个主机下中
scp /etc/hosts root@192.168.100.20:/etc/hosts
scp /etc/hosts root@192.168.100.30:/etc/hosts
scp /etc/hosts root@192.168.100.50:/etc/hosts
实现各个主机之间都能ping通
关闭防火墙和selinux
时钟同步
elasticsearch
elasticsearch简介
Elasticsearch(简称ES)是一个开源的分布式搜索引擎,Elasticsearch还是一个分布式文档数据库。所以它 提供了大量数据的存储功能,快速的搜索与分析功能。
elasticsearch单机部署
第1步
在elasticsearch服务器上(vm2),确认jdk
[root@vm2 ~]# yum -y install java-1.8.0*
[root@vm2 ~]# java -version
openjdk version "1.8.0_422"
OpenJDK Runtime Environment (build 1.8.0_422-b05)
OpenJDK 64-Bit Server VM (build 25.422-b05, mixed mode)
第2步
es的安装,配置(我这里事前下载了他的包,直接进行安装就可以)
[root@vm2 ~]# rz -E
rz waiting to receive.
[root@vm2 ~]# ls
anaconda-ks.cfg  elasticsearch-6.5.2.rpm
[root@vm2 ~]# rpm -ivh elasticsearch-6.5.2.rpm 如果没有软件包也可以通过
wget https://artifacts.elastic.co/downloads/elasticsearch/elasticsearch-6.5.2.rpm
来进行下载
第3步
单机es的配置与服务启动
[root@vm2 ~]# cat /etc/elasticsearch/elasticsearch.yml |grep -v "#"
cluster.name: elk-cluster     可以自定义一个集群名称,不配置的话默认会取名为elasticsearch
path.data: /var/lib/elasticsearch
path.logs: /var/log/elasticsearch
network.host: 0.0.0.0             打开注释,并修改为监听所有
http.port: 9200                     打开注释,监听端口9200
重启服务
[root@vm2 ~]# systemctl restart elasticsearch
[root@vm2 ~]# systemctl enable elasticsearch
Created symlink /etc/systemd/system/multi-user.target.wants/elasticsearch.service → /usr/lib/systemd/system/elasticsearch.service.
[root@vm2 ~]# ss -anlt
State     Recv-Q    Send-Q       Local Address:Port         Peer Address:Port    Process
LISTEN    0         128                0.0.0.0:22                0.0.0.0:*
LISTEN    0         4096                     *:9200                    *:*
LISTEN    0         128                   [::]:22                   [::]:*
LISTEN    0         4096                     *:9300                    *:*                  此时9200和9300已启动9200则是数据传输端口
9300端口是集群通信端口(我们暂时还没有配置集群,现在是单点elasticsearch)
第4步
查看状态,使用curl命令或浏览器访问http://192.168.100.20:9200/_cluster/health?pretty地址(IP为ES服务器IP)
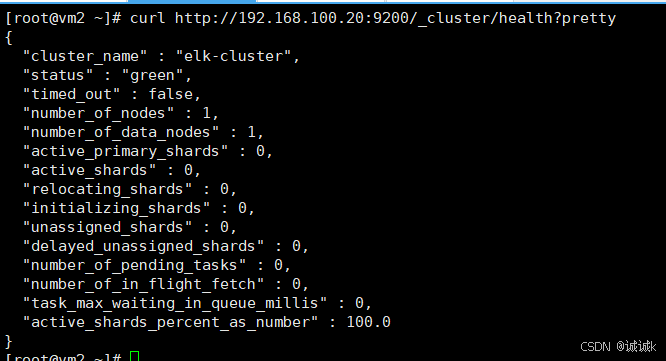
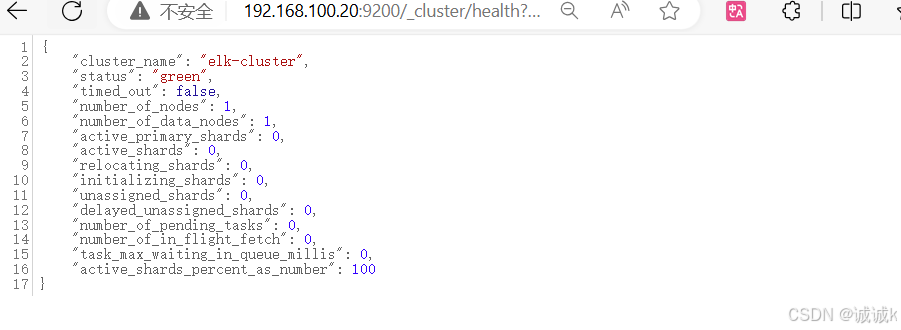
此时"number_of_nodes": 1,
"number_of_data_nodes": 1,都为1,算不上是集群
elasticsearch集群部署
集群部署需要注意的
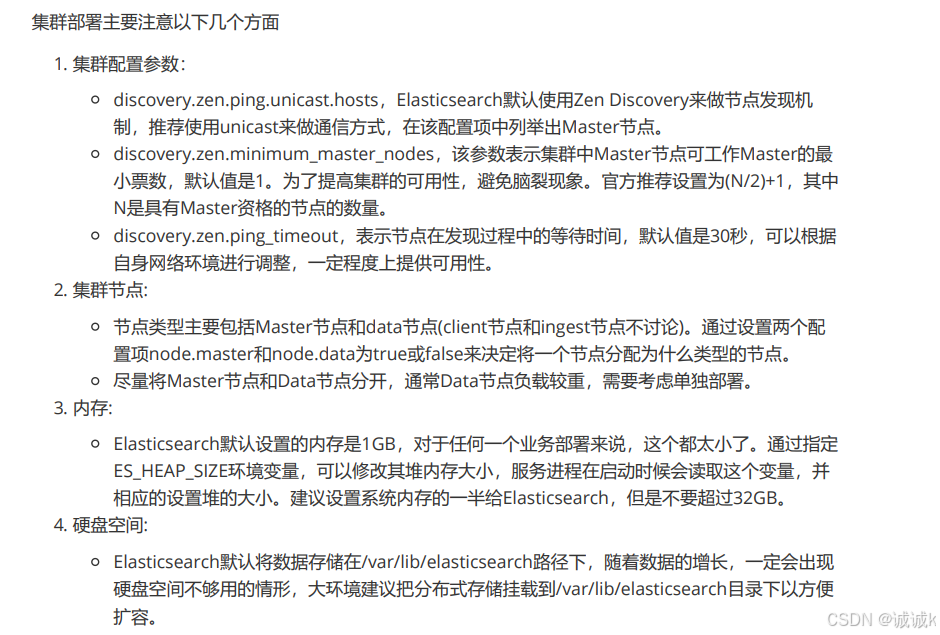
配置参考文档: https://www.elastic.co/guide/en/elasticsearch/reference/index.html
首先在ES集群所有节点都安装ES
也需要像vm2主机一样下载java-1.8.0*
可以使用两台或两台以上ES做集群, 以下就是两台ES做集群的配置
vm1
[root@vm1 ~]# cat /etc/elasticsearch/elasticsearch.yml |grep -v "#"
cluster.name: elk-cluster
node.name: 192.168.100.10                 本机IP或主机名
node.master: false                         指定不为master节点
path.data: /var/lib/elasticsearch
path.logs: /var/log/elasticsearch
network.host: 0.0.0.0
http.port: 9200
discovery.zen.ping.unicast.hosts: ["192.168.100.10", "192.168.100.20"]     集群所有节点IP
vm2
[root@vm2 ~]# cat /etc/elasticsearch/elasticsearch.yml |grep -v "#"
cluster.name: elk-cluster
node.name: 192.168.100.20                本机IP或主机名
node.master: true                         指定为master节点
path.data: /var/lib/elasticsearch
path.logs: /var/log/elasticsearch
network.host: 0.0.0.0
http.port: 9200
discovery.zen.ping.unicast.hosts: ["192.168.100.10", "192.168.100.20"]        集群所有节点IP
两台主机重启服务
[root@vm1 ~]# systemctl restart elasticsearch
[root@vm1 ~]# systemctl enable elasticsearch
[root@vm2 ~]# systemctl restart elasticsearch
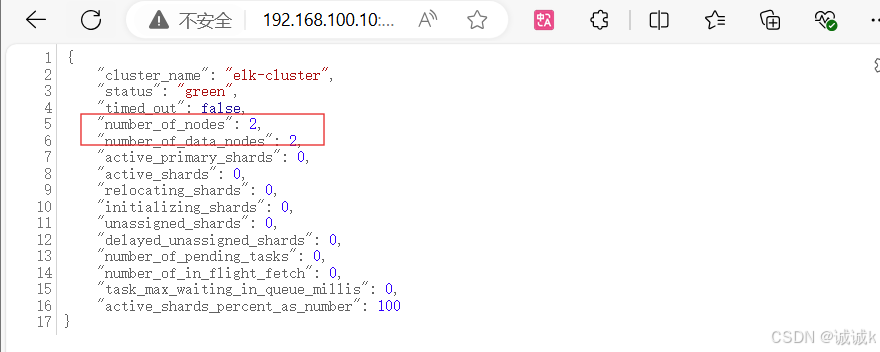
查看状态,访问集群中的任何一个节点都可以,集群中两个节点,都为数据节点
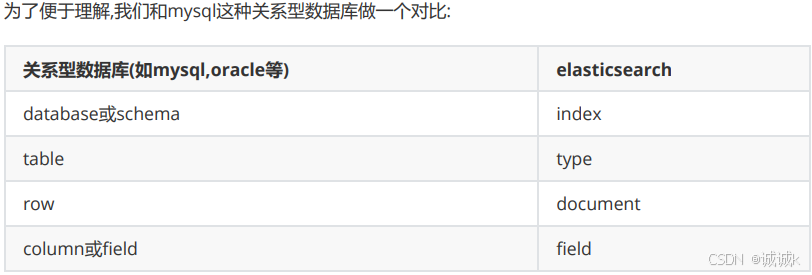
elasticsearch基础概念
主要的基础概念有:Node, Index,Type,Document,Field,shard和replicas
- Node(节点):运行单个ES实例的服务器
- Cluster(集群):一个或多个节点构成集群
- Index(索引):索引是多个文档的集合
- Type(类型):一个Index可以定义一种或多种类型,将Document逻辑分组
- Document(文档):Index里每条记录称为Document,若干文档构建一个
- Index Field(字段):ES存储的最小单元
- Shards(分片):ES将Index分为若干份,每一份就是一个分片
- Replicas(副本):Index的一份或多份副本
ES是分布式搜索引擎,每个索引有一个或多个分片(shard),索引的数据被分配到各个分片上。你可以看 作是一份数据分成了多份给不同的节点。
当ES集群增加或删除节点时,shard会在多个节点中均衡分配。默认是5个primary shard(主分片)和1个 replica shard(副本,用于容错)。
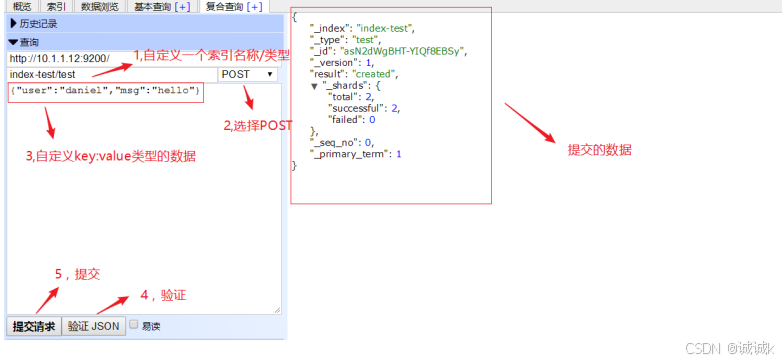
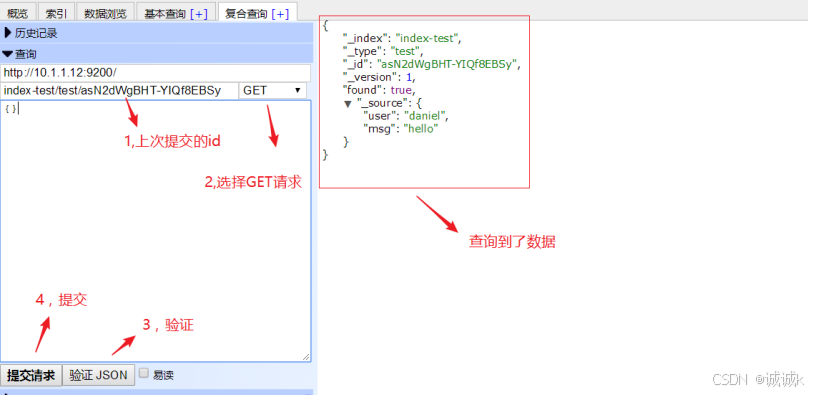
elaticsearch基础API操作
前面我们通过http://192.168.100.10:9200/_cluster/health?pretty查看ES集群状态,其实就是它的一种API操作。
API是什么
API(Application Programming Interface)应用程序编程接口,就是无需访问程序源码或理解内部工 作机制就能实现一些相关功能的接口。
RestFul API 格式
elasticseearch的API很多,举例如下
更多API参考: https://www.elastic.co/guide/en/elasticsearch/reference/6.2/index.html
查看节点信息
[root@vm2 ~]# curl http://192.168.100.20:9200/_cat/nodes?v
ip             heap.percent ram.percent cpu load_1m load_5m load_15m node.role master name
192.168.100.10           15          78   0    0.00    0.00     0.00 di        -      192.168.100.10
192.168.100.20           13          72   0    0.00    0.00     0.00 mdi       *      192.168.100.20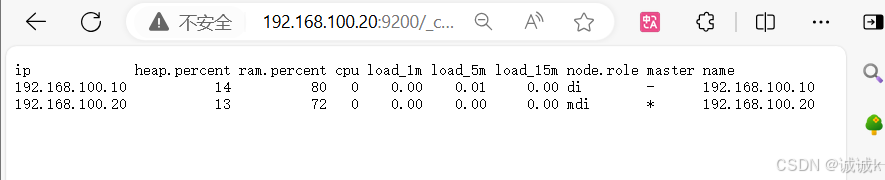
查看索引信息
此时无任何索引
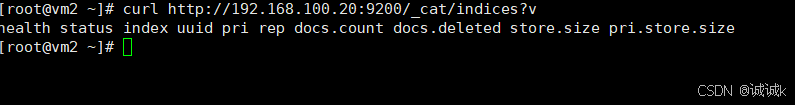
新增索引
[root@vm2 ~]# curl -X PUT http://192.168.100.20:9200/nginx_access_log
/// 新增索引
{"acknowledged":true,"shards_acknowledged":true,"index":"nginx_access_log"}[root@vm2 ~]# 查看[root@vm2 ~]# curl http://192.168.100.20:9200/_cat/indices?v
health status index            uuid                   pri rep docs.count docs.deleted store.size pri.store.size
green  open   nginx_access_log 5GyRdXX8TgC7nknkth_azw   5   1          0            0      2.2kb          1.1kb
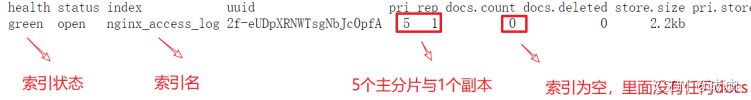
索引状态
green:所有的主分片和副本分片都已分配。你的集群是100%可用的。
yellow:所有的主分片已经分片了,但至少还有一个副本是缺失的。不会有数据丢失,所以搜索结果依 然是完整的。不过,你的高可用性在某种程度上被弱化。如果 更多的 分片消失,你就会丢数据了。把 yellow 想象成一个需要及时调查的警告。
red:至少一个主分片(以及它的全部副本)都在缺失中。这意味着你在缺少数据:搜索只能返回部分数 据,而分配到这个分片上的写入请求会返回一个异常。
删除索引
[root@vm2 ~]# curl -X DELETE http://192.168.100.20:9200/nginx_access_log
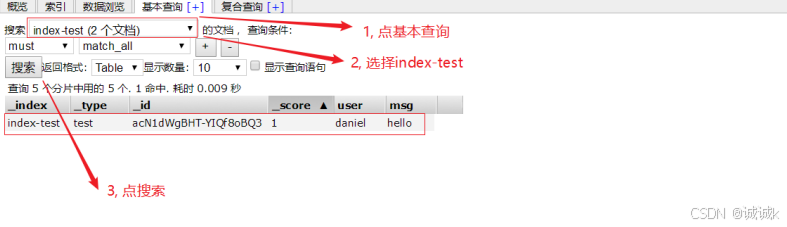
{"acknowledged":trueES查询语句-(参考)
ES提供一种可用于执行查询JSON式的语言,被称为Query DSL。
查询匹配条件: match_all
- from
- size
- match
- bool
- range
查询应用案例:
导入数据源
使用官方提供的示例数据:
下载并导入进elasticsearch,此时accounts.json已经下载好了
//导入进elasticsearch[root@vm2 ~]# curl -H "Content-Type: application/json" -XPOST "192.168.100.20:9200/bank/_doc/_bulk?pretty&refresh" --data-binary "@accounts.json"查询确认
[root@vm2 ~]# curl "192.168.100.20:9200/_cat/indices?v"
health status index            uuid                   pri rep docs.count docs.deleted store.size pri.store.size
green  open   nginx_access_log F59JRNR3SeGmEtacdMAxAA   5   1          0            0      2.5kb          1.2kb
green  open   bank             SaC5YDx_RMitUazz1-GPQw   5   1       1000            0    957.6kb        482.8kb
查询bank索引的数据(使用查询字符串进行查询)
[root@vm2 ~]# curl -X GET "192.168.100.20:9200/bank/_search?q=*&sort=account_number:asc&pretty"说明:
默认结果为10条
_search 属于一类API,用于执行查询操作
q=* ES批量索引中的所有文档
sort=account_number:asc 表示根据account_number按升序对结果排序
pretty调整显示格式
查询bank索引的数据 (使用json格式进行查询)
[root@vm2 ~]# curl -X GET "192.168.100.20:9200/bank/_search" -H 'Content-Type:application/json' -d'
> {
> "query": { "match_all": {} },
> "sort": [
> { "account_number": "asc" }
> ]
> }
> '
查询结果

查询匹配动作及案例:
- from
- size
- 除了query参数外,还可以传递其他参数影响查询结果,比如前面提到的sort,接下来使用的 size
[root@vm2 ~]# curl -X GET "192.168.100.20:9200/bank/_search?pretty" -H 'Content-Type:application/json' -d'{
"query": { "match_all": {} },
"size": 1
}'查询结果
{"took" : 7,"timed_out" : false,"_shards" : {"total" : 5,"successful" : 5,"skipped" : 0,"failed" : 0},"hits" : {"total" : 1000,"max_score" : 1.0,"hits" : [{"_index" : "bank","_type" : "_doc","_id" : "25","_score" : 1.0,"_source" : {"account_number" : 25,"balance" : 40540,"firstname" : "Virginia","lastname" : "Ayala","age" : 39,"gender" : "F","address" : "171 Putnam Avenue","employer" : "Filodyne","email" : "virginiaayala@filodyne.com","city" : "Nicholson","state" : "PA"}}]}
}
指定位置与查询条数
[root@vm2 ~]# curl -X GET "192.168.100.20:9200/bank/_search?pretty" -H 'Content-Type:
application/json' -d'
{
"query": { "match_all": {} },
"from": 0,
"size": 2
}
'
from 0表示从第1个开始
size 指定查询的个数
示例: 查询account_number从第501条到510条的数据
curl -X GET "192.168.100.20:9200/bank/_search?pretty" -H 'Content-Type:
application/json' -d'
{
"query": { "match_all": {} },
"from": 500,
"size": 10,
"sort": [
{ "account_number": "asc" }
]
}
' 2>/dev/null |grep account_number
- 匹配查询字段
返回_source字段中的片段字段
[root@vm2 ~]# curl -X GET "192.168.100.20:9200/bank/_search?pretty" -H 'Content-Type:
application/json' -d'
{
"query": { "match_all": {} },
"_source": ["account_number", "balance"]
}
'- match 基本搜索查询
- 针对特定字段或字段集合进行搜索
查询编号为20的账户
[root@vm2 ~]# curl -X GET "192.168.100.20:9200/bank/_search?pretty" -H 'Content-Type:
application/json' -d'
{
"query": { "match": { "account_number": 20 } }
}
'
返回地址中包含mill的账户
[root@vm2 ~]# curl -X GET "192.168.100.20:9200/bank/_search?pretty" -H 'Content-Type:
application/json' -d'
{
"query": { "match": { "address": "mill" } }
}
'
返回地址有包含mill或lane的所有账户
[root@vm2 ~]# curl -X GET "192.168.100.20:9200/bank/_search?pretty" -H 'Content-Type:
application/json' -d'
{
"query": { "match": { "address": "mill lane" } } # 空格就是或的关系
}
'
bool
bool must 查询的字段必须同时存在
查询包含mill和lane的所有账户
[root@vm2 ~]# curl -X GET "192.168.100.20:9200/bank/_search?pretty" -H 'Content-Type:
application/json' -d'
{
"query": {
"bool": {
"must": [
{ "match": { "address": "mill" } },
{ "match": { "address": "lane" } }
]
}
}
}
'
bool should 查询的字段仅存在一即可
查询包含mill或lane的所有账户
[root@vm2 ~]# curl -X GET "192.168.100.20:9200/bank/_search?pretty" -H 'Content-Type:
application/json' -d'
{
"query": {
"bool": {
"should": [
{ "match": { "address": "mill" } },
{ "match": { "address": "lane" } }
]
}
}
}
'
range
- 指定区间内的数字或者时间
- 操作符:gt大于,gte大于等于,lt小于,lte小于等于
查询余额大于或等于20000且小于等于30000的账户
[root@vm2 ~]# curl -X GET "10.1.1.12:9200/bank/_search?pretty" -H 'Content-Type:
application/json' -d'
{
"query": {
"bool": {
"must": { "match_all": {} },
"filter": {
"range": {
"balance": {
"gte": 20000,
"lte": 30000
}
}
}
}
}
}
'
elasticsearch-head
elasticsearch-head是集群管理、数据可视化、增删改查、查询语句可视化工具。从ES5版本后安装方式 和ES2以上的版本有很大的不同,在ES2中可以直接在bin目录下执行plugin install xxxx 来进行安装,但是 在ES5中这种安装方式变了,要想在ES5中安装Elasticsearch Head必须要安装NodeJs,然后通过NodeJS来 启动Head。
官网地址:https://github.com/mobz/elasticsearch-head
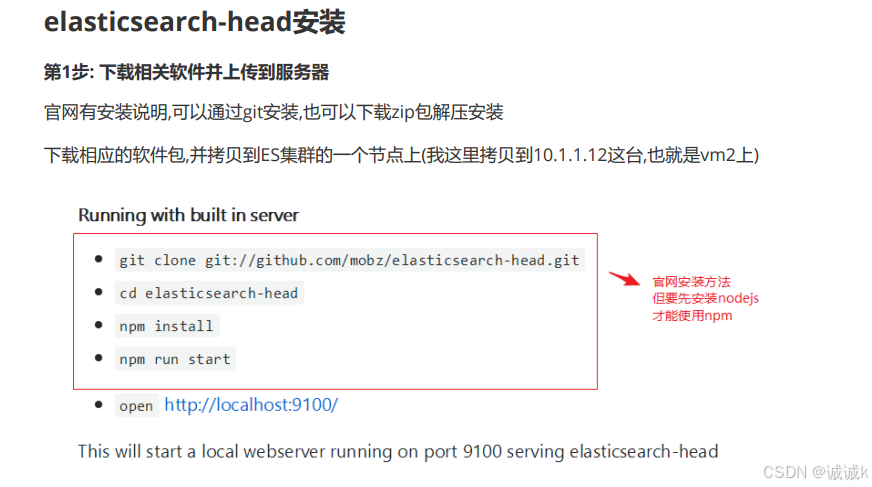
elasticsearch-head安装
第一步
nodejs下载页面: https://nodejs.org/en/download/
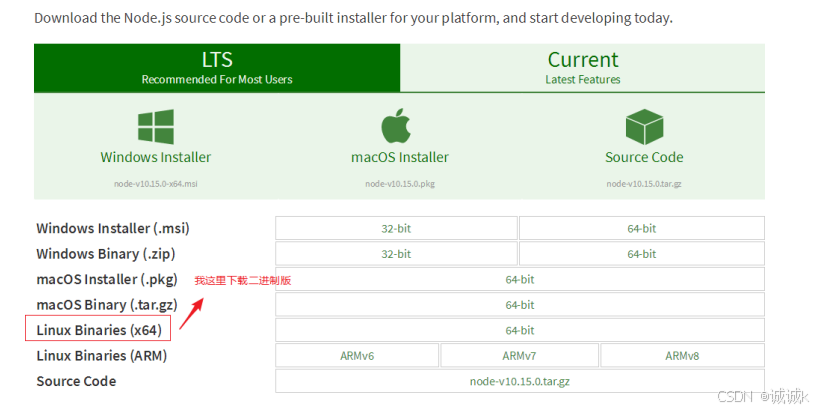
这里我们已经下载好了,直接上传到终端
第二步
安装nodejs
[root@vm2 ~]# ls
accounts.json  anaconda-ks.cfg  elasticsearch-6.5.2.rpm  node-v10.24.1-linux-x64.tar.xz
[root@vm2 ~]# tar -xf node-v10.24.1-linux-x64.tar.xz -C /usr/local/
[root@vm2 ~]# cd /usr/local/
[root@vm2 local]# ls
bin  etc  games  include  lib  lib64  libexec  node-v10.24.1-linux-x64  sbin  share  src
[root@vm2 local]# mv /usr/local/node-v10.24.1-linux-x64/ /usr/local/nodejs/
[root@vm2 local]# ls /usr/local/nodejs/bin/npm
/usr/local/nodejs/bin/npm                        // 确认有此命令
[root@vm2 local]# ln -s /usr/local/nodejs/bin/npm /bin/npm
[root@vm2 local]# ln -s /usr/local/nodejs/bin/node /bin/node
第三步
安装es-head
安装方法1(需要网速好)
[root@vm2 ~]# git clone git://github.com/mobz/elasticsearch-head.git
[root@vm2 ~]# cd elasticsearch-head
先使用npm安装grunt
npm(node package manager):node包管理工具,类似yum
Grunt是基于Node.js的项目构建工具
[root@vm2 elasticsearch-head]# npm install -g grunt-cli
安装时间较久,还会在网上下载phantomjs包
[root@vm2 elasticsearch-head]# npm install
安装可能有很多错误,(重点是注意红色的ERR!,黄色的WARN不用管
解决方法
npm install phantomjs-prebuilt@2.1.16 --ignore-script --registry=http://registry.npm.taobao.org安装方法二
将下载好的包上传上去,再进行解压安装
适用于网速慢
下载好需要用到的工具
[root@vm2 local]# yum -y install unzip[root@vm2 ~]# rz -E
rz waiting to receive.
[root@vm2 ~]# ls
accounts.json elasticsearch-6.5.2.rpm node-v10.24.1-linux-x64.tar.xz
anaconda-ks.cfg elasticsearch-head-master.zip安装
[root@vm2 ~]# unzip elasticsearch-head-master.zip -d /usr/local/[root@vm2 ~]# mv /usr/local/elasticsearch-head-master/ /usr/local/es-head/
[root@vm2 ~]# cd /usr/local/es-head/
[root@vm2 es-head]# npm install -g grunt-cli --
registry=http://registry.npm.taobao.org[root@vm2 es-head]# npm install --registry=http://registry.npm.taobao.org
/// 安装的时候可能出现报错,上面又解决方法
解决以后再进行一次:npm install --registry=http://registry.npm.taobao.org启动
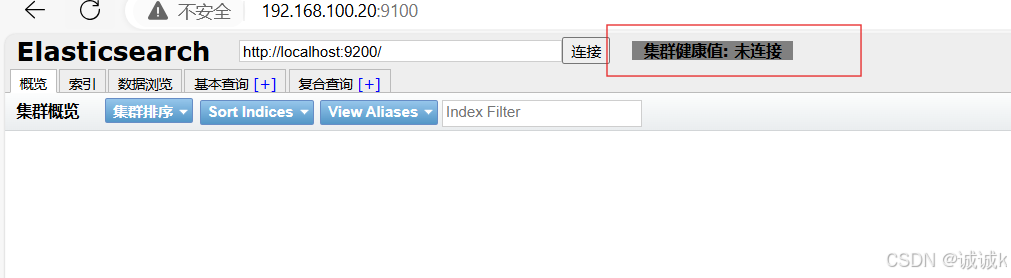
[root@vm2 es-head]# nohup npm run start &浏览器访问
浏览器访问 http://es-head节点IP:9100
此时健康值未连接
第四步
修改ES集群配置文件,并重启服务
[root@vm1 ~]# systemctl restart elasticsearch.service
[root@vm1 ~]# cat /etc/elasticsearch/elasticsearch.yml |grep -v "#"
cluster.name: elk-cluster
node.name: 192.168.100.10
node.master: false
path.data: /var/lib/elasticsearch
path.logs: /var/log/elasticsearch
network.host: 0.0.0.0
http.port: 9200
discovery.zen.ping.unicast.hosts: ["192.168.100.10", "192.168.100.20"]http.cors.enabled: true
http.cors.allow-origin: "*"加上这两行这一台主机也一样
[root@vm2 es-head]# cat /etc/elasticsearch/elasticsearch.yml |grep -v "#"
cluster.name: elk-cluster
node.name: 192.168.100.20
node.master: true
path.data: /var/lib/elasticsearch
path.logs: /var/log/elasticsearch
network.host: 0.0.0.0
http.port: 9200
discovery.zen.ping.unicast.hosts: ["192.168.100.10", "192.168.100.20"]
http.cors.enabled: true
http.cors.allow-origin: "*"
重启服务
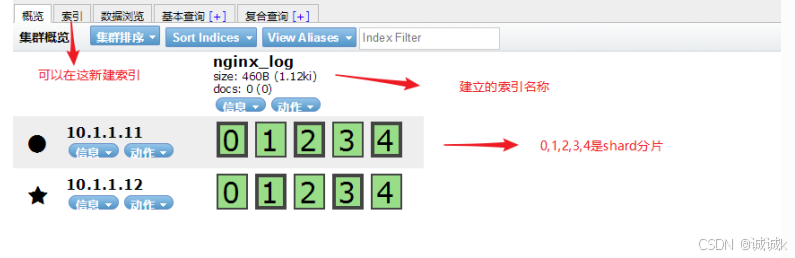
再次连接就可以查看到信息了
新建索引
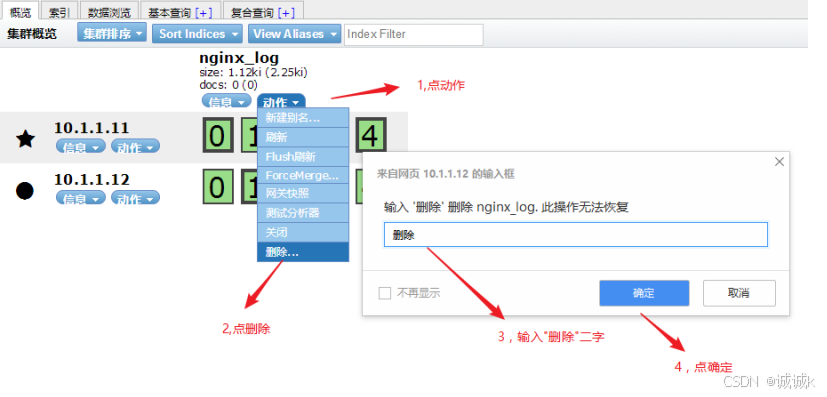
删除此索引
es-head查询验证

logstash
logstash简介
logstash是一个开源的数据采集工具,通过数据源采集数据.然后进行过滤,并自定义格式输出到目的地。
数据分为:
- 结构化数据 如:mysql数据库里的表等
- 半结构化数据 如: xml,yaml,json等
- 非结构化数据 如:文档,图片,音频,视频等
ogstash可以采集任何格式的数据,当然我们这里主要是讨论采集系统日志,服务日志等日志类型数据。
官方产品介绍:https://www.elastic.co/cn/products/logstash
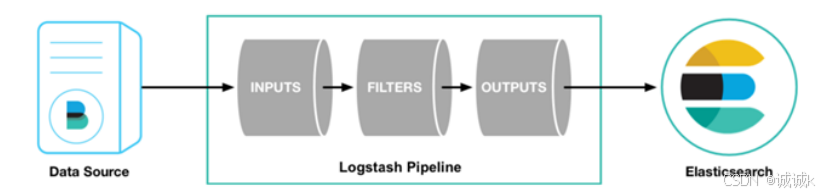
input插件: 用于导入日志源 (配置必须)
https://www.elastic.co/guide/en/logstash/current/input-plugins.html
filter插件: 用于过滤(不是配置必须的
https://www.elastic.co/guide/en/logstash/current/filter-plugins.html
output插件: 用于导出(配置必须)
https://www.elastic.co/guide/en/logstash/current/output-plugins.html
logstash部署
在logstash服务器上确认openjdk安装
[root@vm3 ~]# java -version
openjdk version "1.8.0_422"
OpenJDK Runtime Environment (build 1.8.0_422-b05)
OpenJDK 64-Bit Server VM (build 25.422-b05, mixed mode)
在logstash服务器上安装logstash
将下载好的包传到服务器进行安装
[root@vm3 ~]# rz -E
rz waiting to receive.
[root@vm3 ~]# ls
anaconda-ks.cfg  logstash-6.5.2.rpm
[root@vm3 ~]# rpm -ivh logstash-6.5.2.rpm
warning: logstash-6.5.2.rpm: Header V4 RSA/SHA512 Signature, key ID d88e42b4: NOKEY
Verifying...                          ################################# [100%]
Preparing...                          ################################# [100%]
Updating / installing...1:logstash-1:6.5.2-1               ################################# [100%]
Using provided startup.options file: /etc/logstash/startup.options
Successfully created system startup script for Logstash
配置logstash主配置文件
[root@vm3 logstash]# vim logstash.yml
[root@vm3 logstash]# cat /etc/logstash/logstash.yml |grep -v '#' |grep -v '^$'
path.data: /var/lib/logstash
path.config: /etc/logstash/conf.d/                打开注释,并加上配置目录路径
http.host: "192.168.100.30"                        打开注释,并改为本机IP
http.port: 9600-9700                                打开注释
path.logs: /var/log/logstash
启动测试
[root@vm3 logstash]# cd /usr/share/logstash/bin
[root@vm3 bin]#  ./logstash -e 'input {stdin {}} output {stdout {}}'
 关闭启动
关闭启动
CTRL+C可以关闭
另一种验证方法:
上述测试还可以使用如下方法进行:
[root@vm3]# vim /etc/logstash/conf.d/test.conf
input {
stdin {
}
}
filter {
}
output {
stdout {
codec => rubydebug
}
}
[root@vm3 bin]# pwd
/usr/share/logstash/bin
[root@vm3 bin]# ./logstash --path.settings /etc/logstash -f
/etc/logstash/conf.d/test.conf -t
......
Config Validation Result: OK. Exiting Logstash--path.settings 指定logstash主配置文件目录
-f 指定片段配置文件
-t 测试配置文件是否正确
codec => rubydebug这句可写可不定,默认就是这种输出方式[root@vm3 bin]#  ./logstash --path.settings /etc/logstash -r -f /etc/logstash/conf.d/test.conf
........
[2024-08-20T15:34:19,739][INFO ][logstash.agent           ] Successfully started Logstash API endpoint {:port=>9600}{"@version" => "1","@timestamp" => 2024-08-20T07:34:26.185Z,"message" => "","host" => "vm3.cluster.com"
}
chengcheng
{"@version" => "1","@timestamp" => 2024-08-20T07:34:30.725Z,"message" => "chengcheng","host" => "vm3.cluster.com"
}
apple
{"@version" => "1","@timestamp" => 2024-08-20T07:34:42.708Z,"message" => "apple","host" => "vm3.cluster.com"
}
-r参数很强大,会动态装载配置文件,也就是说启动后,可以不用重启修改配置文件
日志采集
采集messages日志
这里以/var/log/messages为例,只定义input输入和output输出,不考虑过滤
[root@vm3 bin]# vim /etc/logstash/conf.d/test.conf
[root@vm3 bin]# cat /etc/logstash/conf.d/test.conf
input {file {path => "/var/log/messages"start_position => "beginning"}
}
output {elasticsearch{hosts => ["192.168.100.20:9200"]index => "test-%{+YYYY.MM.dd}"}
}[root@vm3 bin]# ./logstash --path.settings /etc/logstash/ -r -f
/etc/logstash/conf.d/test.conf &
后台运行如果要杀掉,请使用pkill java或ps查看PID再kill -9清除
通过浏览器访问es-head验证
logstash输出到es的索引
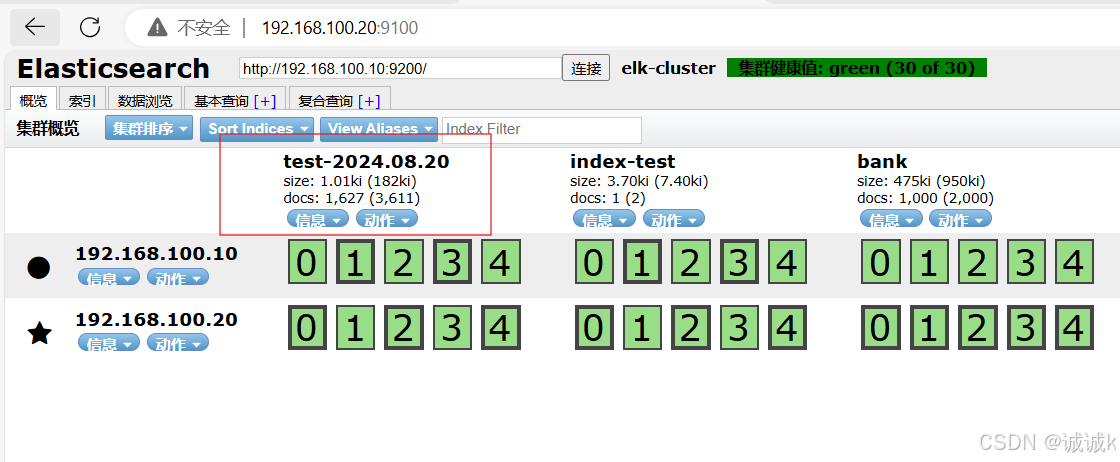
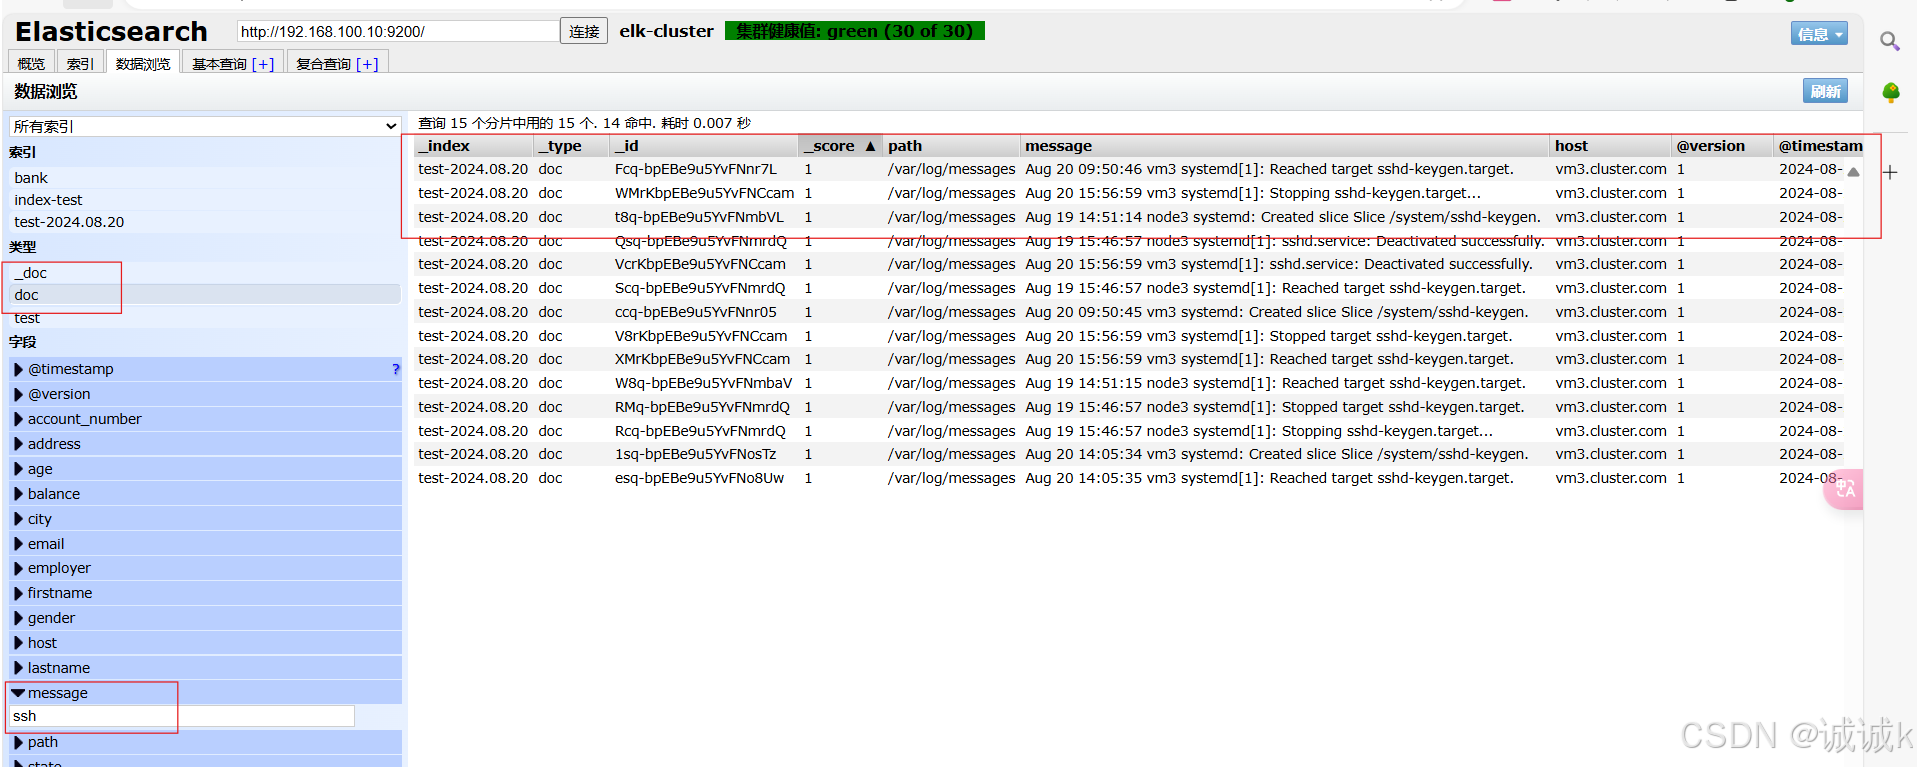
logstash上传上来的/var/log/messages里的日志文件
练习
在logstash那台服务器上做一些操作(比如,重启下sshd服务), 让/var/log/message有新的日志信息, 然后验证es-head里的数据。
[root@vm3 bin]# systemctl restart sshdes-head验证
kill掉logstash进程(相当于关闭), 也做一些操作让/var/log/message日志有更新,然后再次启动 logstash。
[root@vm3 bin]# ps -ef |grep java
找到进程号然后杀死
[root@vm3 bin]# kill -9 1496
[root@vm3 bin]# ps -ef |grep java
root        1561     675  0 16:09 pts/0    00:00:00 grep --color=auto java
[1]+  Killed                  ./logstash --path.settings /etc/logstash/ -r -f /etc/logstash/conf.d/test.conf
采集更多的日志
[root@vm3 ~]# cat /etc/logstash/conf.d/test.conf
input {file {path => "/var/log/messages"start_position => "beginning"type => "messages"}file {path => "/var/log/dnf.log"start_position => "beginning"type => "dnf"}
}filter {
}
output {if [type] == "messages" {elasticsearch {hosts => ["192.168.100.10:9200","192.168.100.20:9200"]index => "messages-%{+YYYY-MM-dd}"}}if [type] == "dnf" {elasticsearch {hosts => ["192.168.100.10:9200","192.168.100.20:9200"]index => "yum-%{+YYYY-MM-dd}"}}
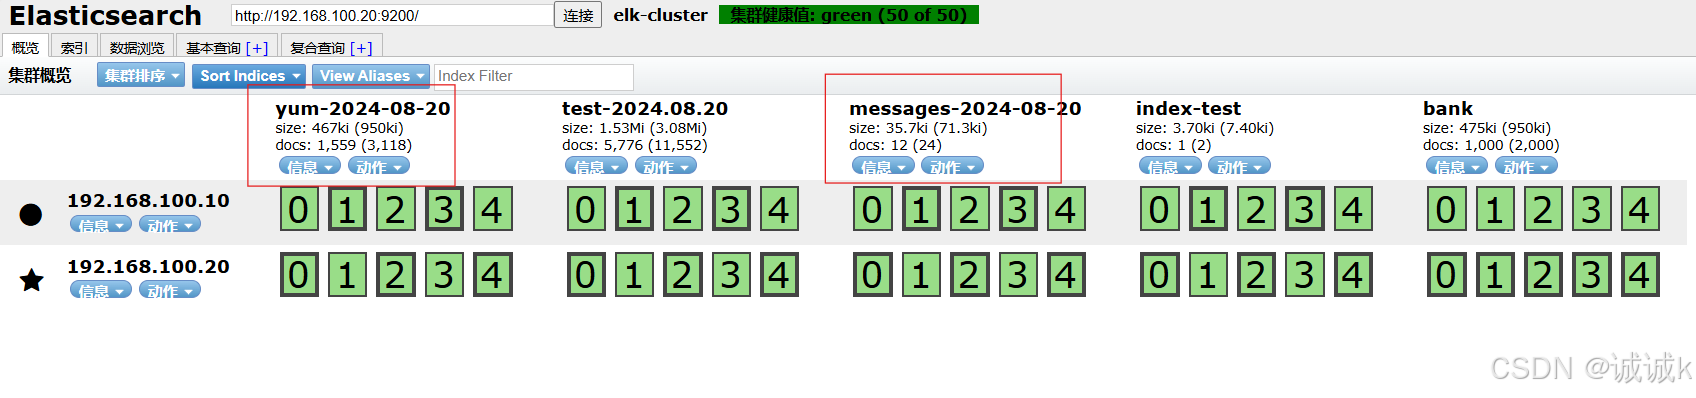
}启动
[root@vm3 bin]# ./logstash --path.settings /etc/logstash/ -r -f
/etc/logstash/conf.d/test.conf &
...........
[2024-08-20T16:30:38,396][INFO ][logstash.agent ] Successfully started Logstash API endpoint {:port=>9600}查看端口
[root@vm3 bin]# ss -anlt
State Recv-Q Send-Q Local Address:Port Peer Address:Port Process
LISTEN 0 128 0.0.0.0:22 0.0.0.0:*
LISTEN 0 50 [::ffff:192.168.100.30]:9600 *:*
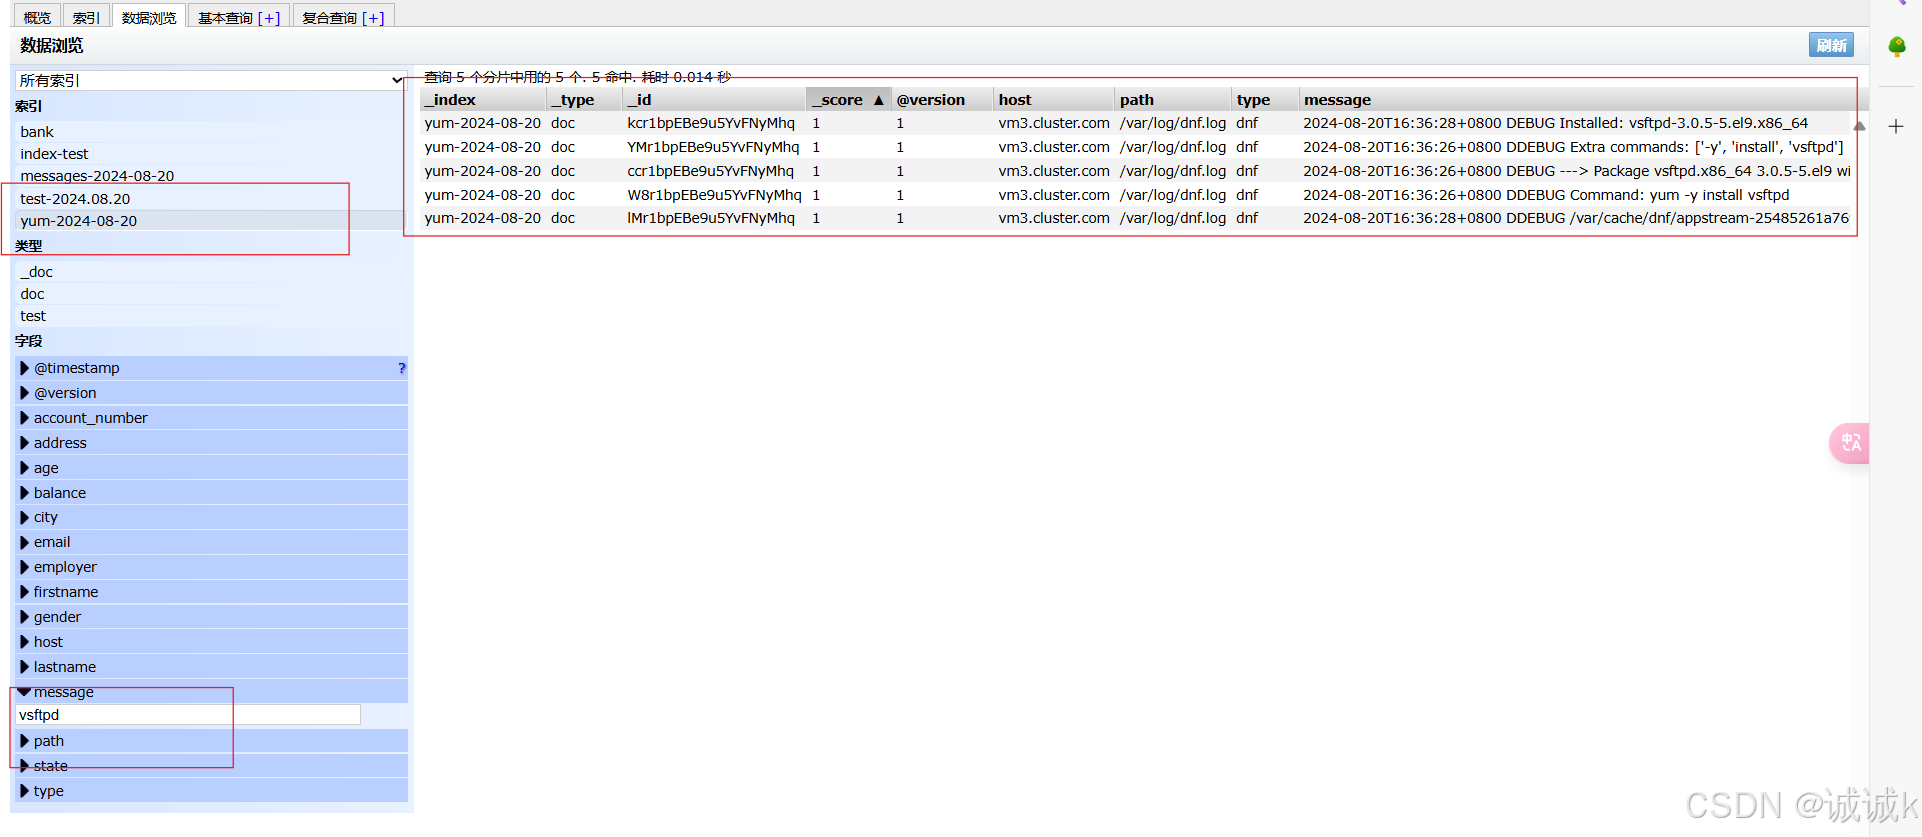
LISTEN 0 128 [::]:22 [::]:* 9600已启动通过浏览器访问es-head验证
此时执行一句
yum -y install vsftpd
来做验证
kibana
kibana介绍
Kibana是一个开源的可视化平台,可以为ElasticSearch集群的管理提供友好的Web界面,帮助汇总,分析和搜索重要的日志数据。
文档路径: https://www.elastic.co/guide/en/kibana/current/setup.html
kibana部署
第一步
: 在kibana服务器(VM1)上安装kibana
将提前下载好的包上传到vm1上进行安装
[root@vm1 ~]# rz -E
rz waiting to receive.
[root@vm1 ~]# ls
anaconda-ks.cfg  elasticsearch-6.5.2.rpm  kibana-6.5.2-x86_64.rpm安装
[root@vm1 ~]# rpm -ivh kibana-6.5.2-x86_64.rpm
warning: kibana-6.5.2-x86_64.rpm: Header V4 RSA/SHA512 Signature, key ID d88e42b4: NOKEY
Verifying...                          ################################# [100%]
Preparing...                          ################################# [100%]
Updating / installing...1:kibana-6.5.2-1                   ################################# [100%]
第二步
配置kibana
[root@vm1 ~]# cat /etc/kibana/kibana.yml |grep -v '#' |grep -v '^$'
server.port: 5601                                     端口
server.host: "0.0.0.0"                                 监听所有,允许所有人能访问
elasticsearch.url: "http://192.168.100.20:9200"      ES集群的路径
logging.dest: /var/log/kibana.log                    加了kibana日志,方便排错与调试日志要自己建立,并修改owner和group属性
[root@vm1 ~]# touch /var/log/kibana.log
[root@vm1 ~]# chown kibana.kibana /var/log/kibana.log
第三步
启动kibana
[root@vm1 ~]# systemctl restart kibana
[root@vm1 ~]# systemctl enable kibana
Created symlink /etc/systemd/system/multi-user.target.wants/kibana.service → /etc/systemd/system/kibana.service.
[root@vm1 ~]# ss -anlt
State      Recv-Q      Send-Q           Local Address:Port           Peer Address:Port     Process
LISTEN     0           511                    0.0.0.0:5601                0.0.0.0:*
LISTEN     0           128                    0.0.0.0:22                  0.0.0.0:*
LISTEN     0           4096                         *:9300                      *:*
LISTEN     0           128                       [::]:22                     [::]:*
LISTEN     0           4096                         *:9200                      *:*  此时5601已启动
第四步
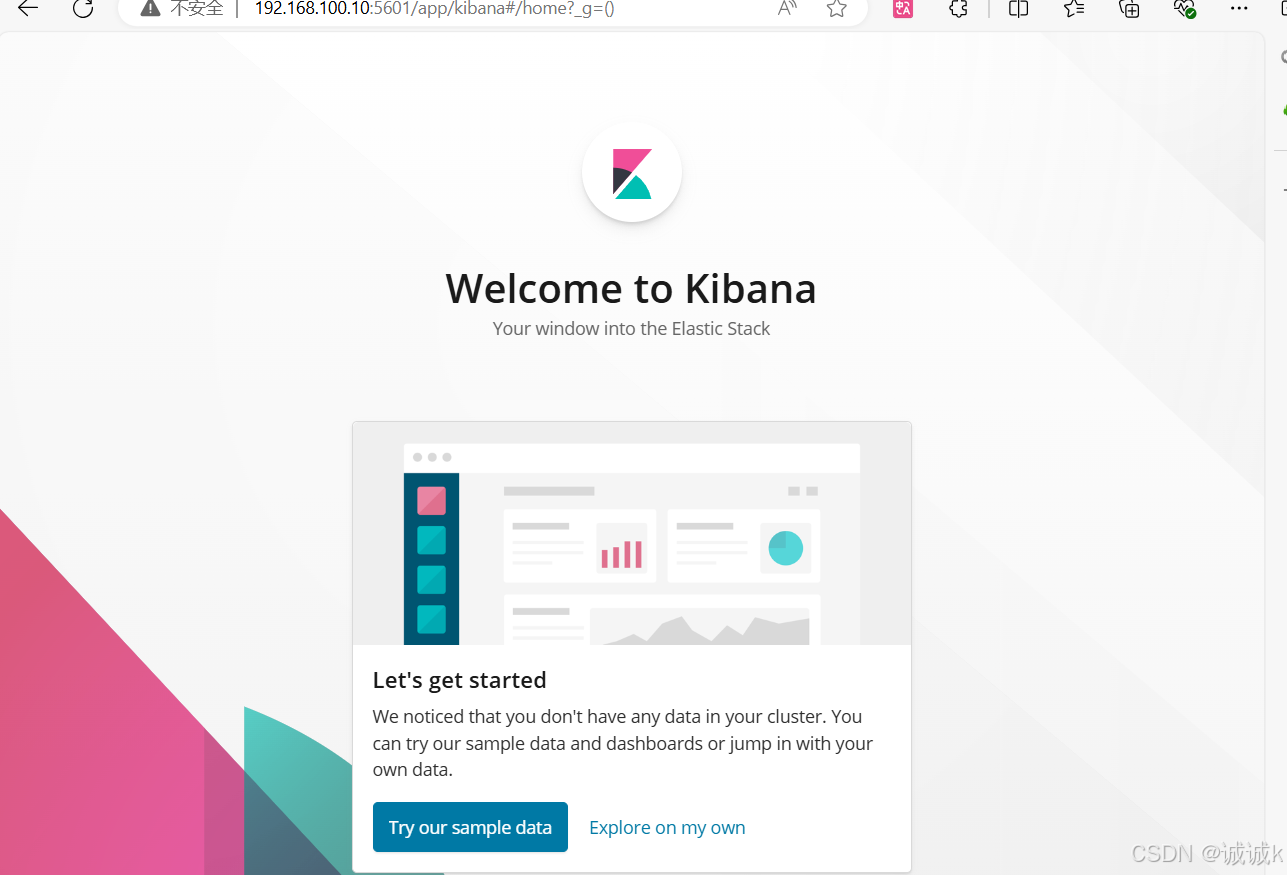
:通过浏览器访问 http://kibana服务器IP:5601
kibana汉化
https://github.com/anbai-inc/Kibana_Hanization/
提前下载好的包上传到vm1
[root@vm1 ~]# rz -E
rz waiting to receive.
[root@vm1 ~]# ls
anaconda-ks.cfg kibana-6.5.2-x86_64.rpm
elasticsearch-6.5.2.rpm kibana-6.5.4_hanization-master.zip[root@vm1 ~]# unzip Kibana_Hanization-master.zip -d /usr/local
[root@vm1 ~]# cd /usr/local/Kibana_Hanization-master/这里要注意:1,要安装python; 2,rpm版的kibana安装目录为/usr/share/kibana/
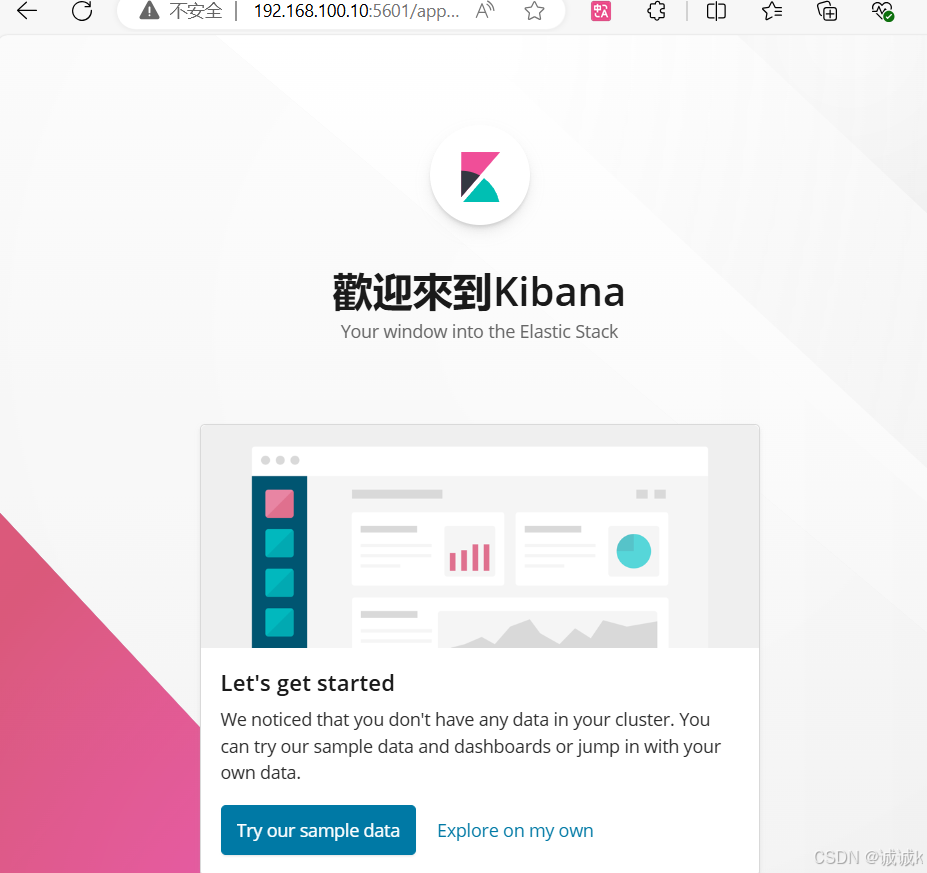
[root@vm1 Kibana_Hanization-master]# python main.py /usr/share/kibana/汉化完后需要重启
[root@vm1 Kibana_Hanization-master]# systemctl stop kibana
[root@vm1 Kibana_Hanization-master]# systemctl start kibana
再次通过浏览器访问 http://kibana服务器IP:5601
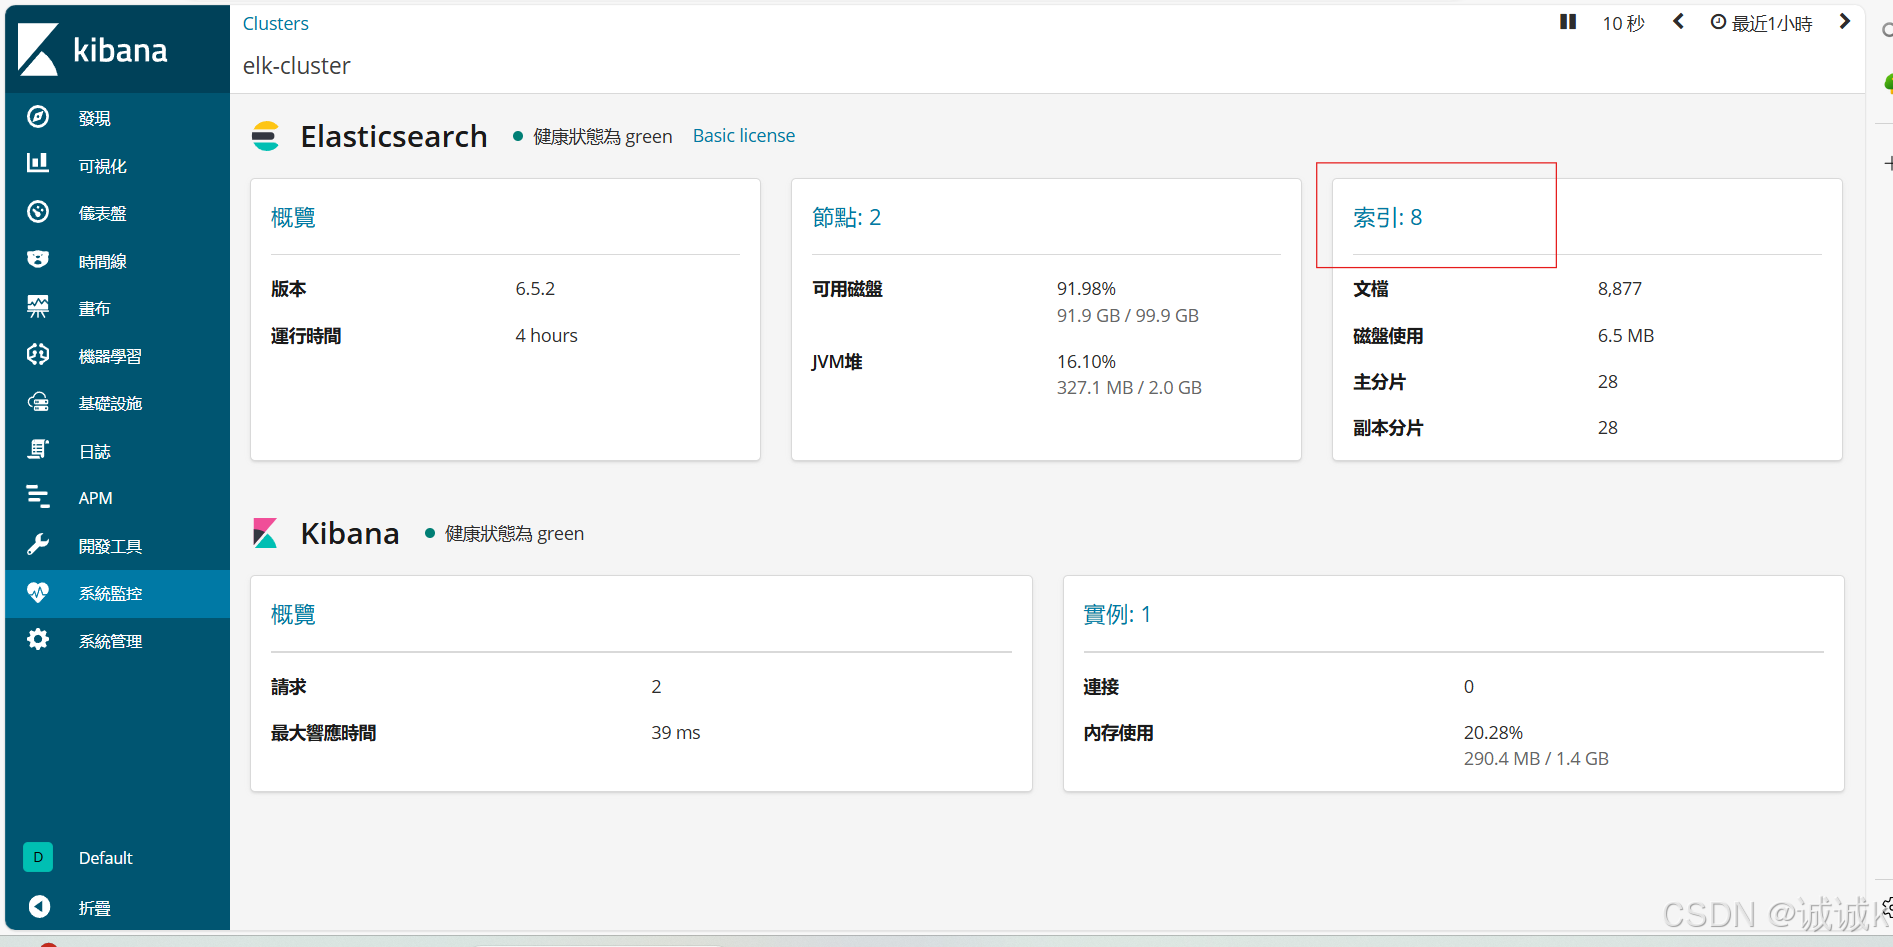
打开系统监控
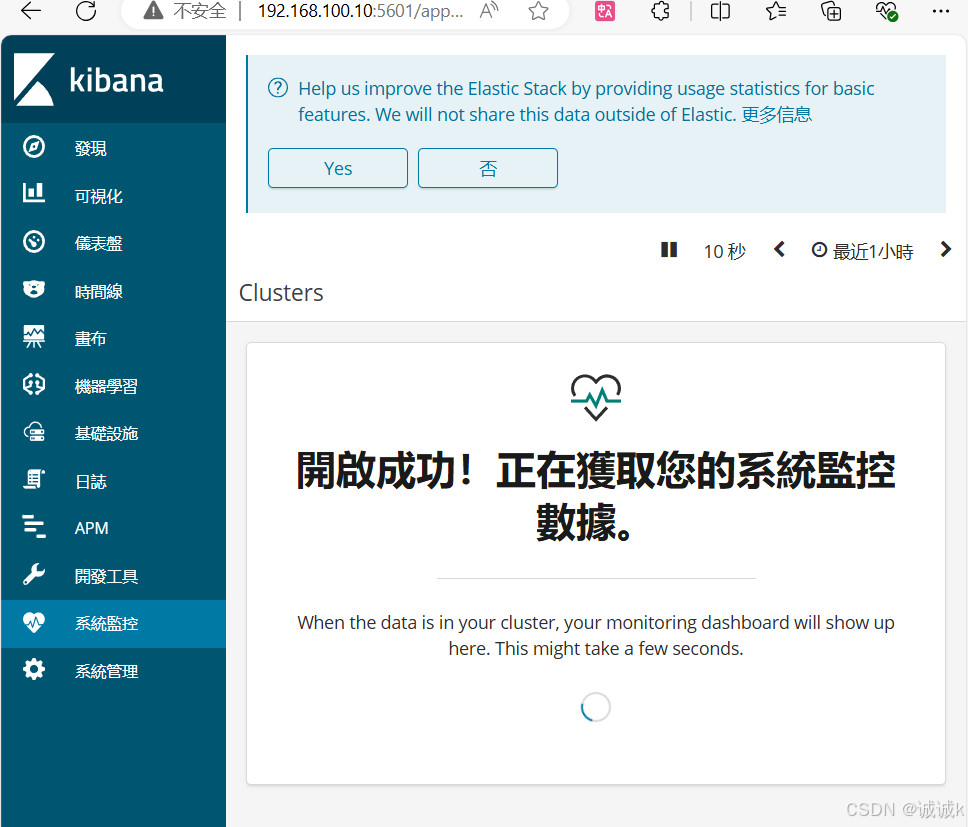
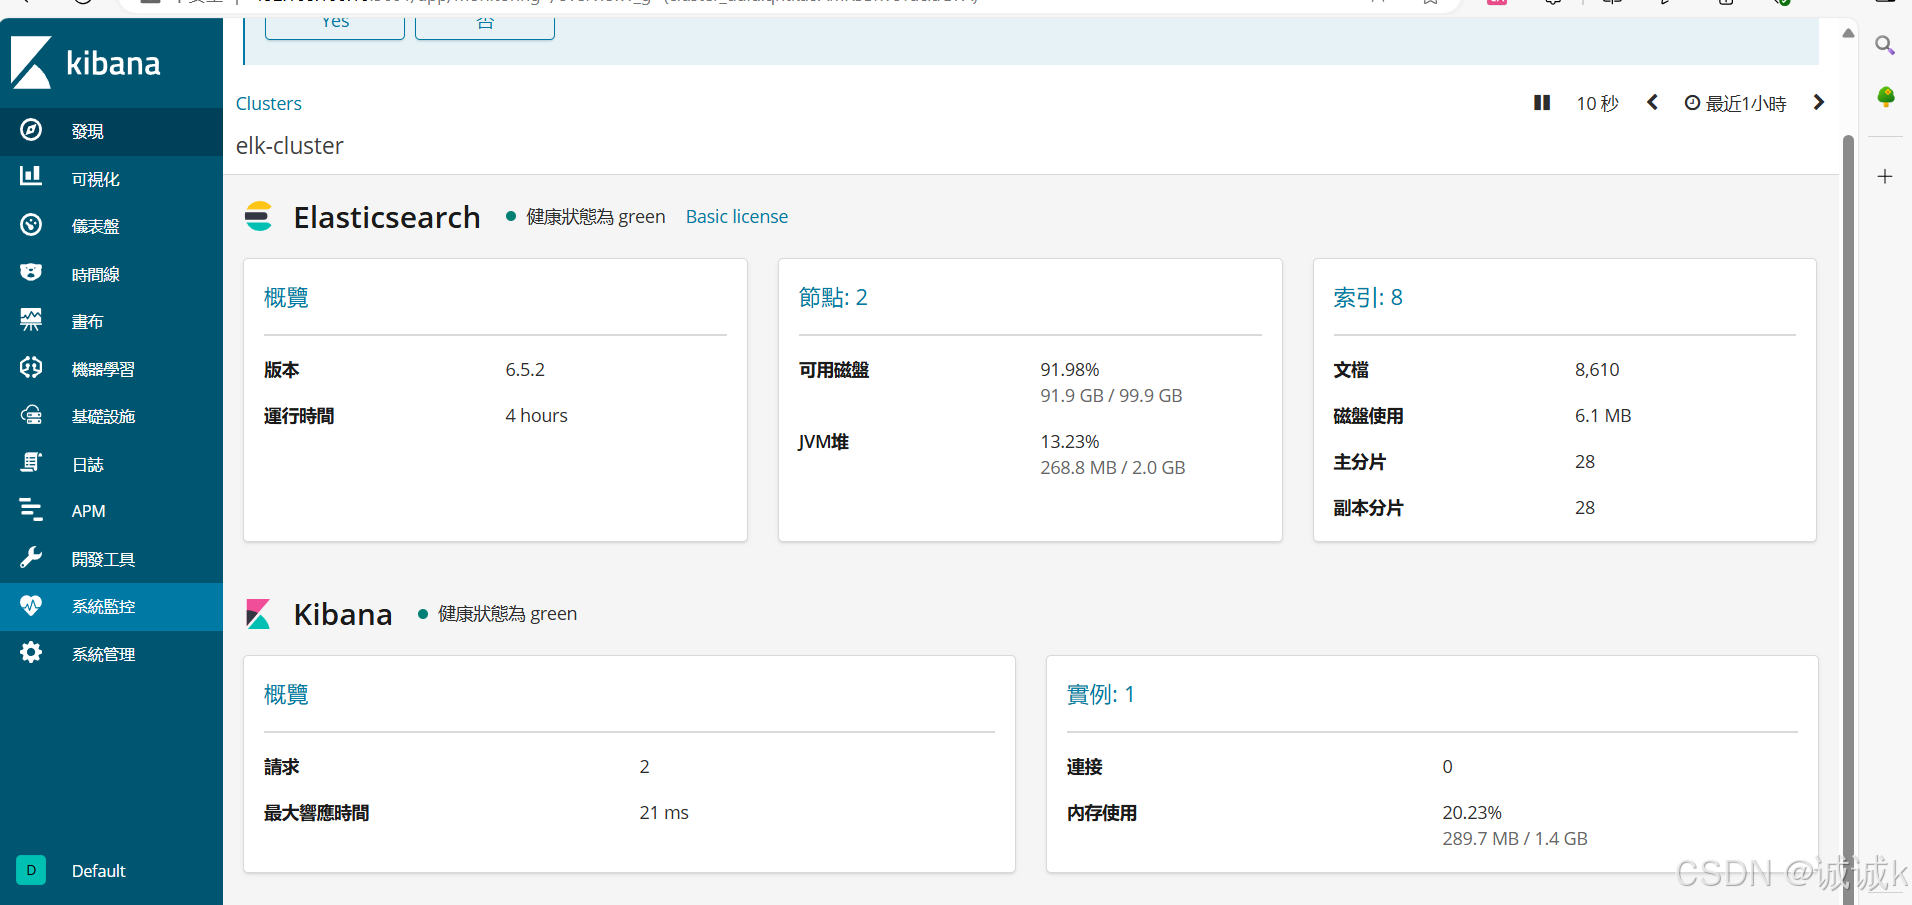
通过kibana查看集群信息
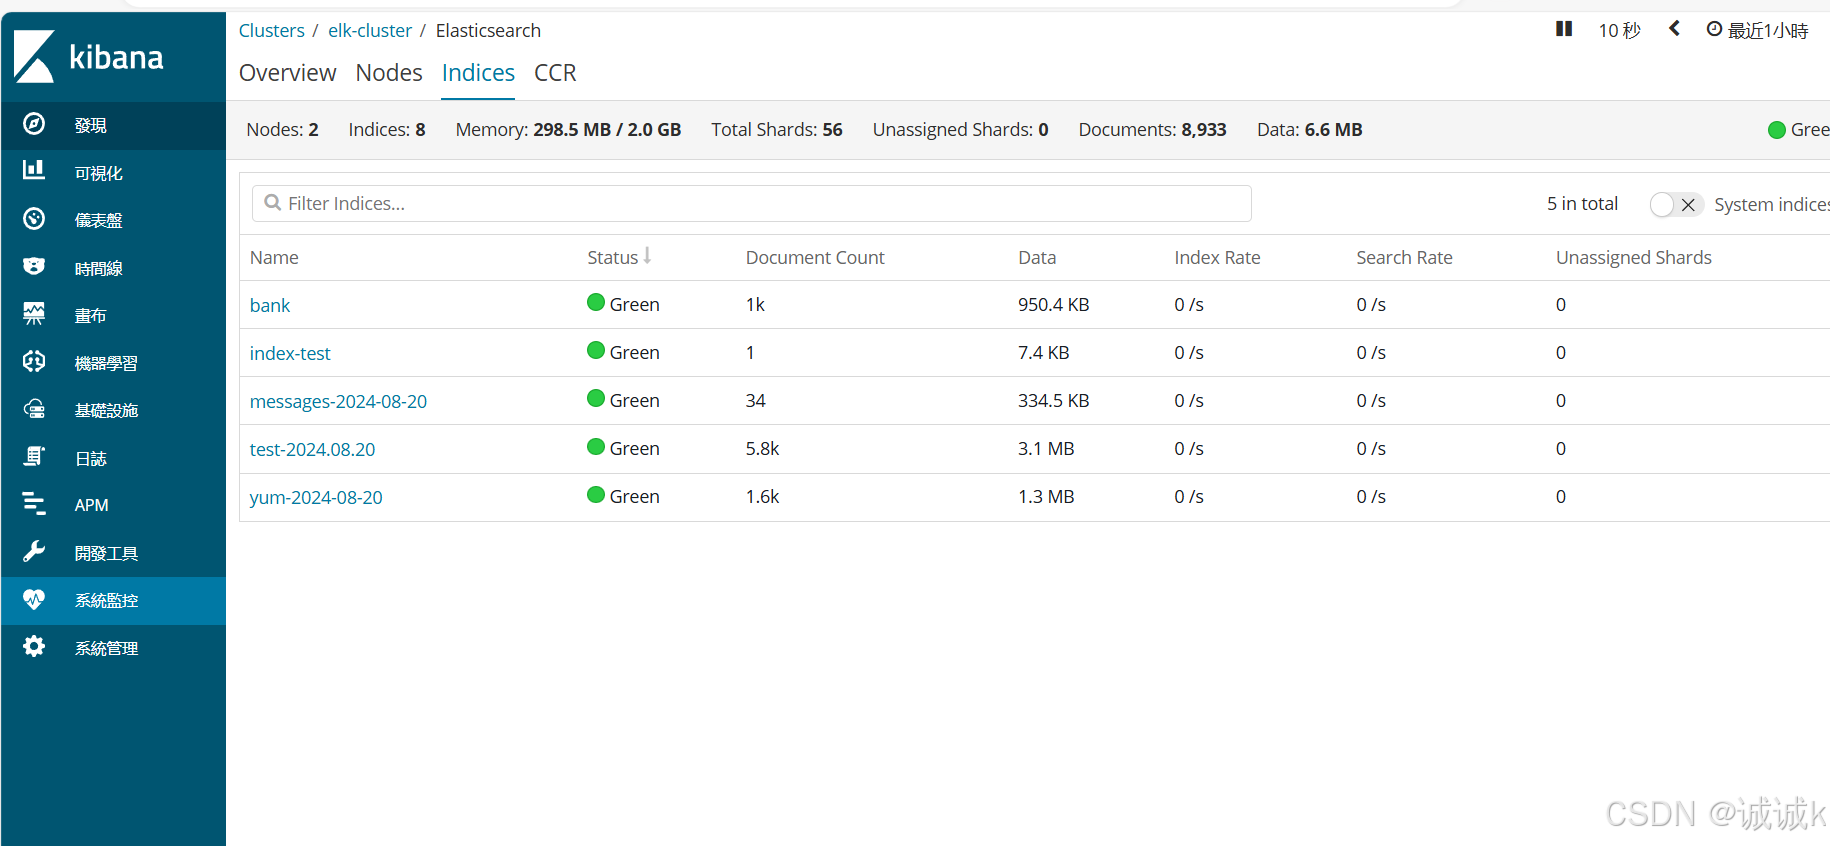
通过kibana查看logstash收集的日志索引
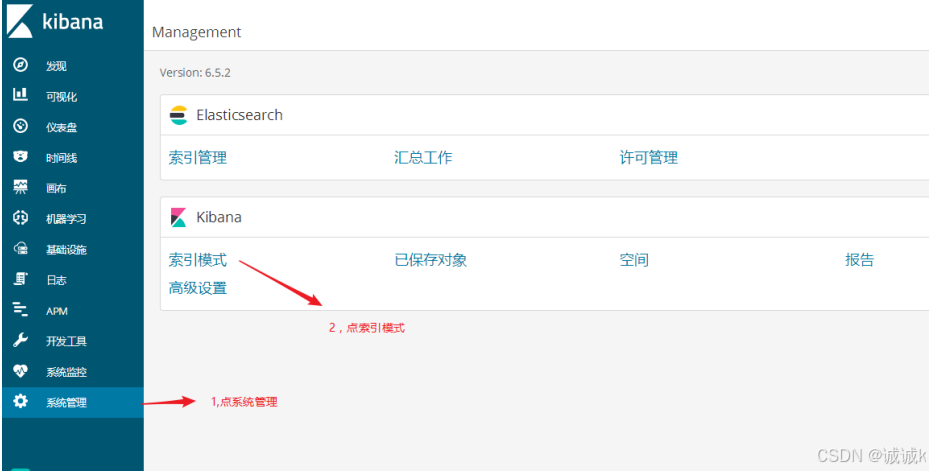
导入索引
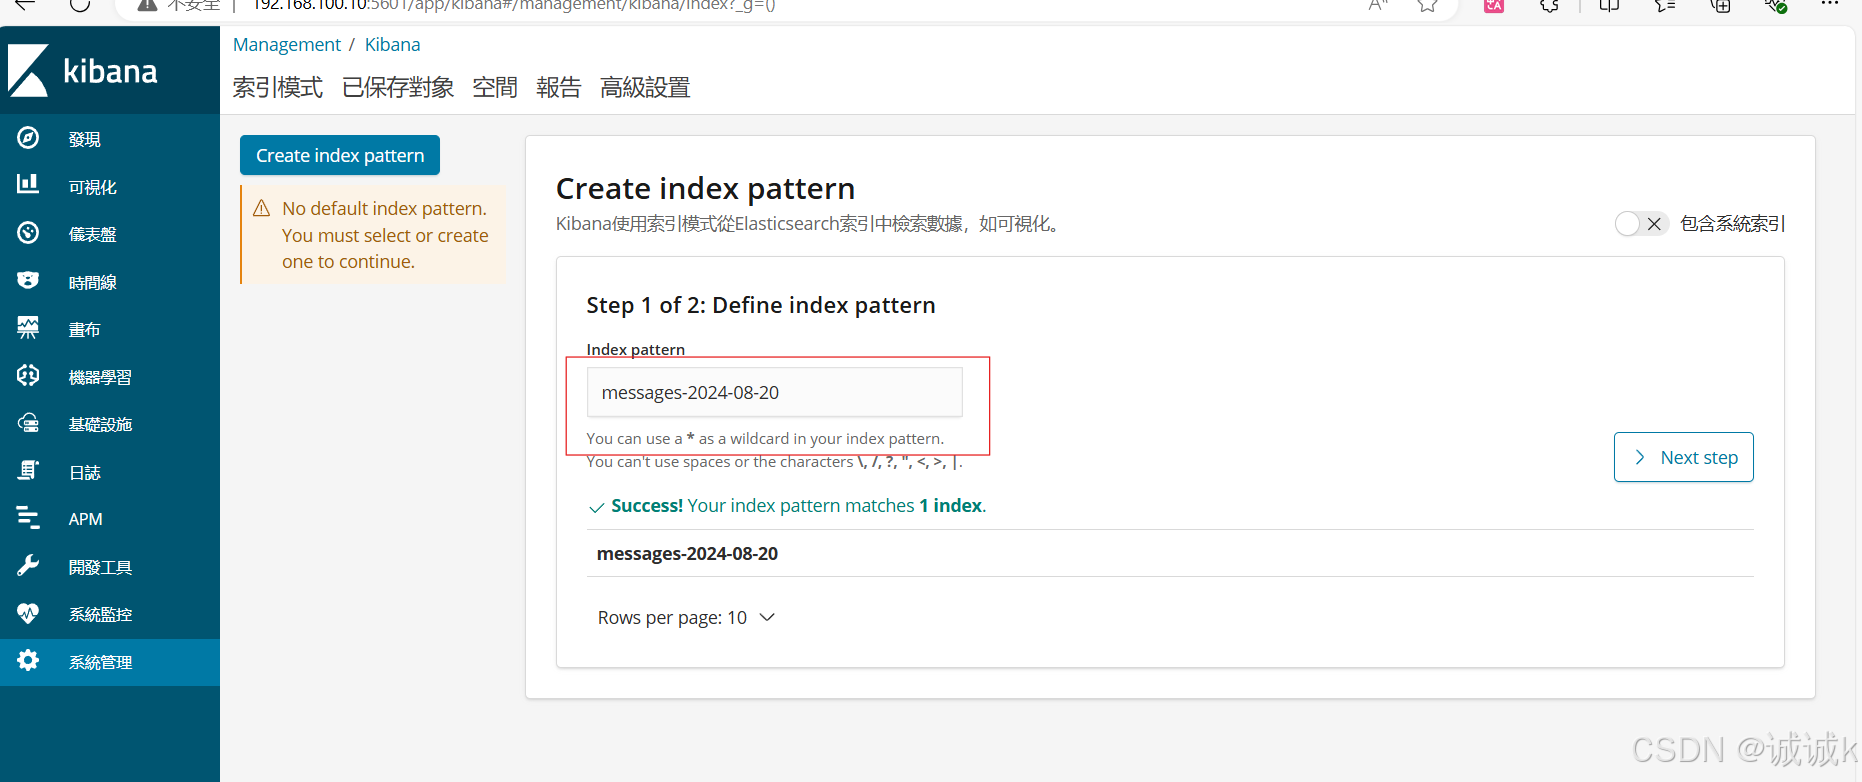
匹配到logstash传过来的索引,点击下一步
 用同样的方法导入三个
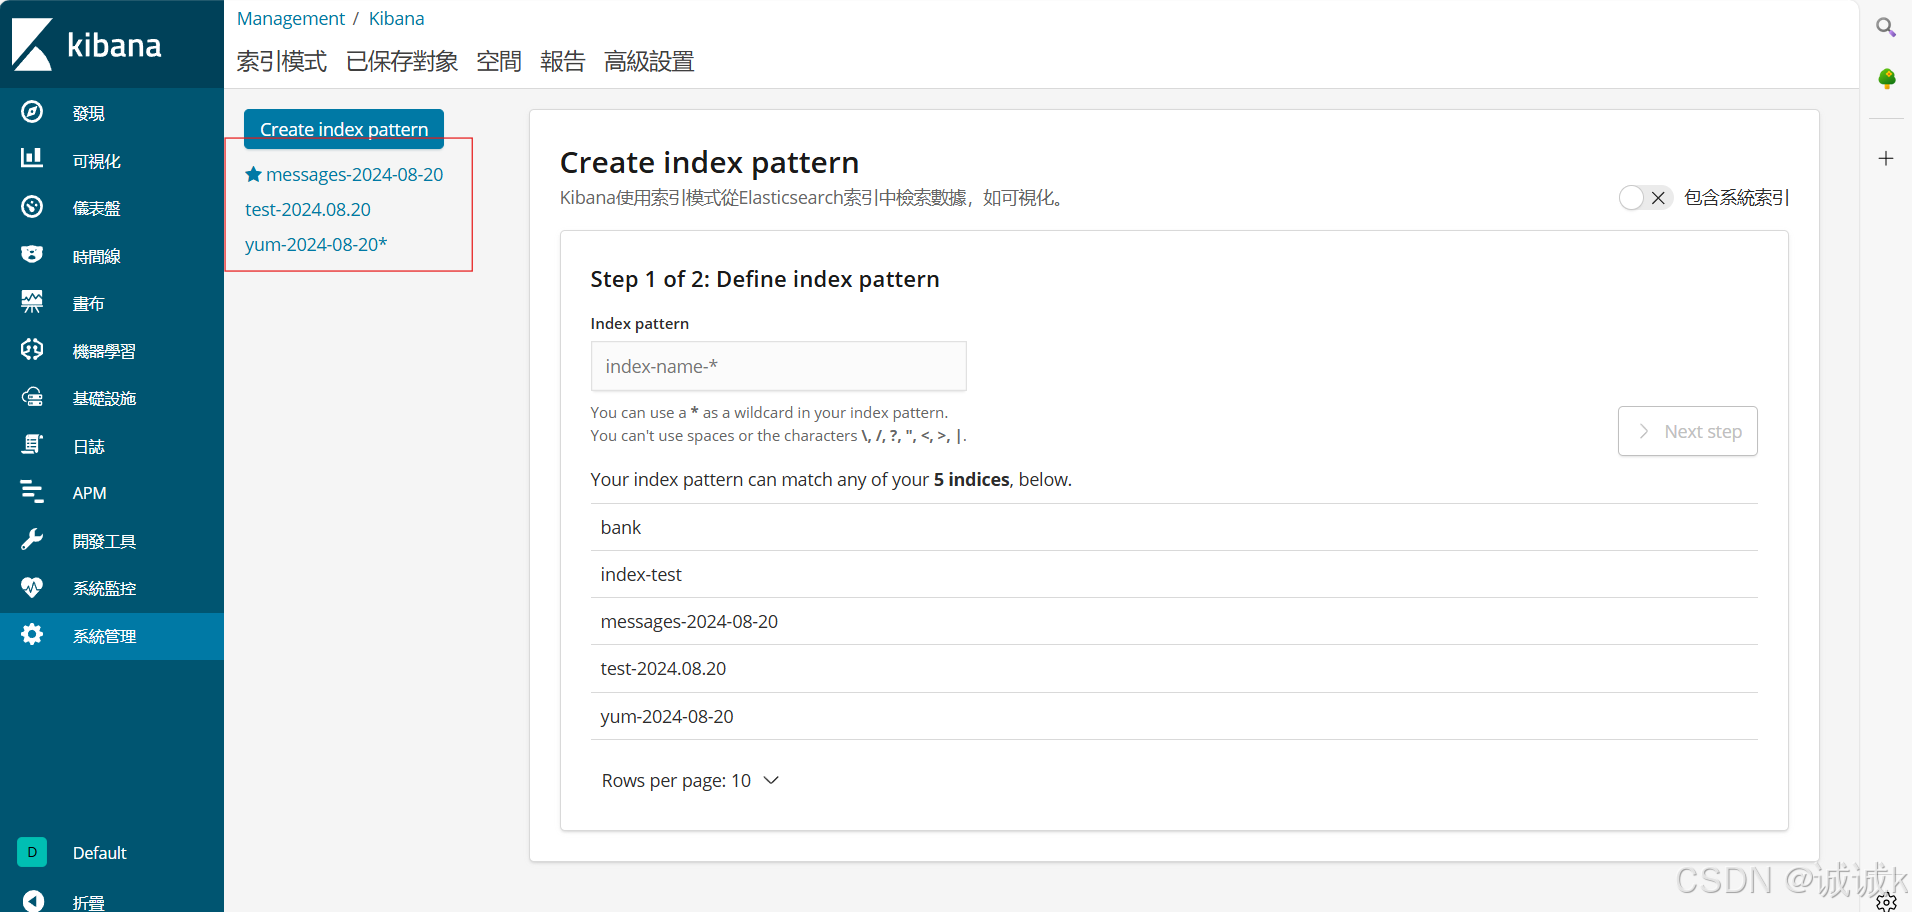
最后点发现查看 
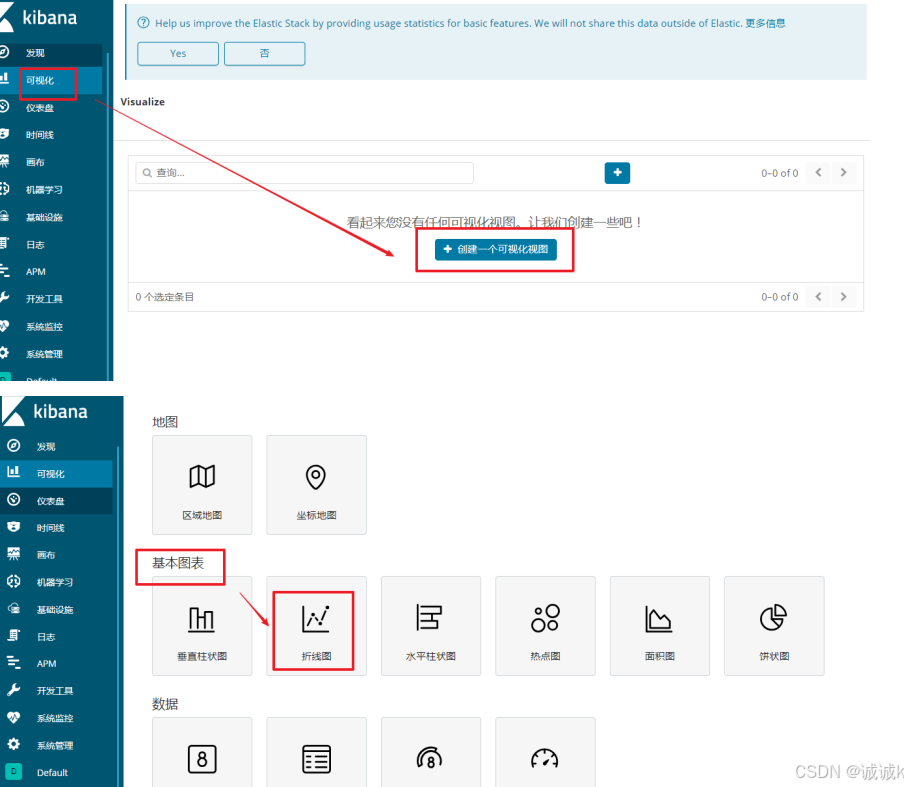
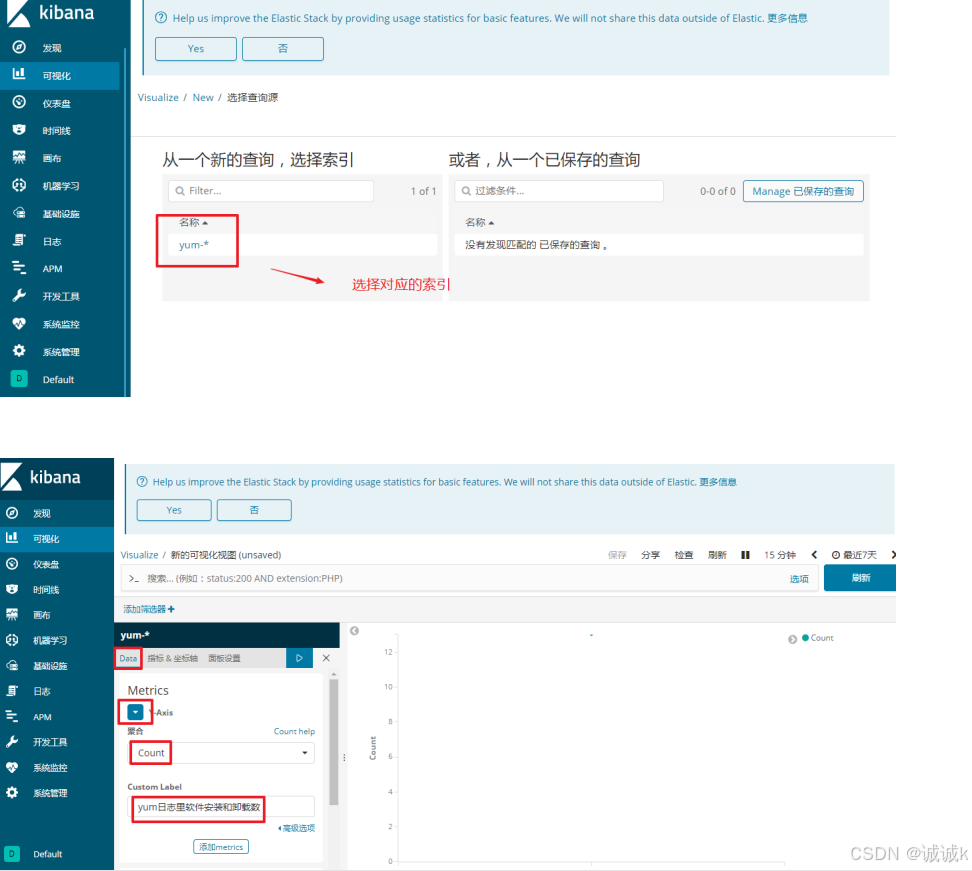
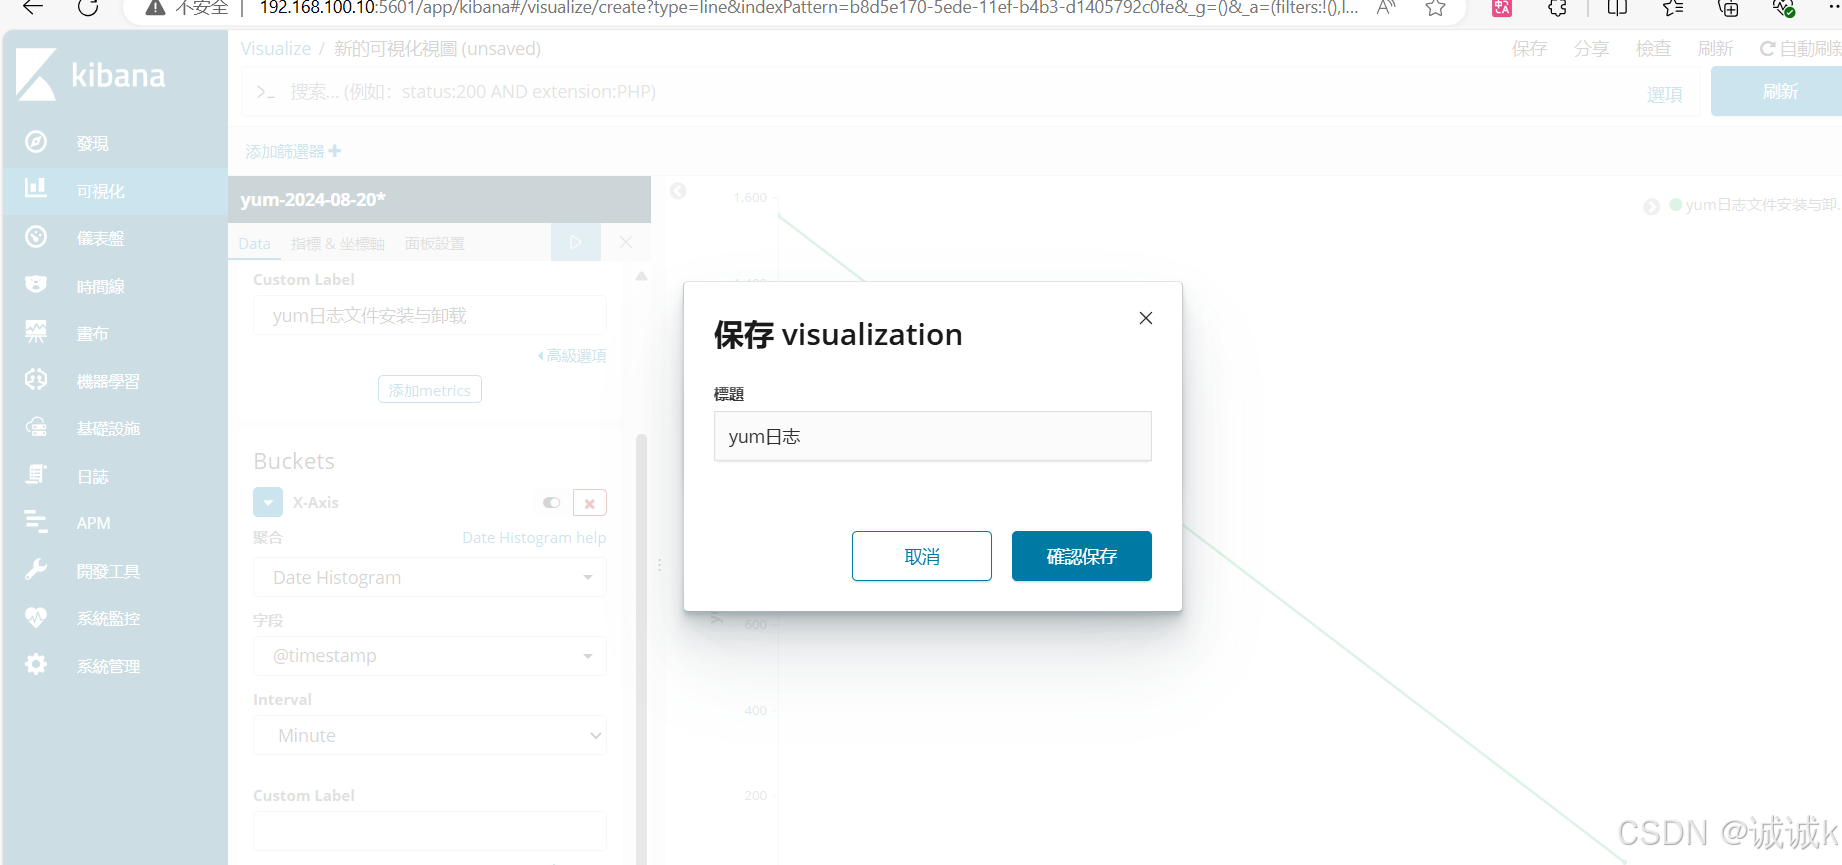
通过kibana做可视化图形
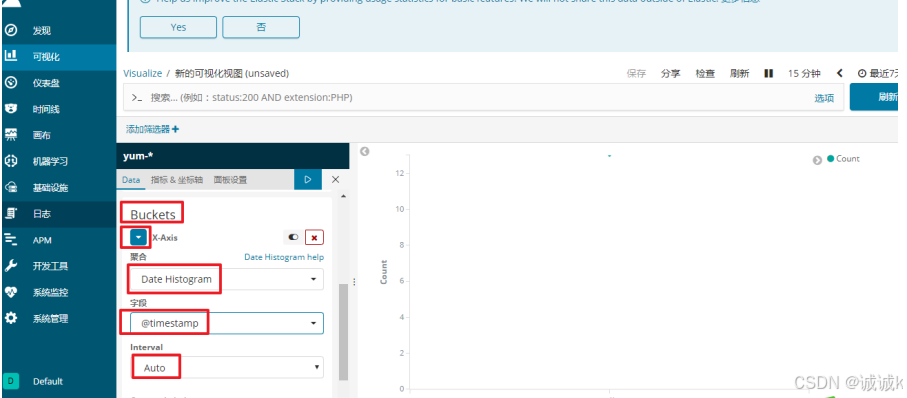
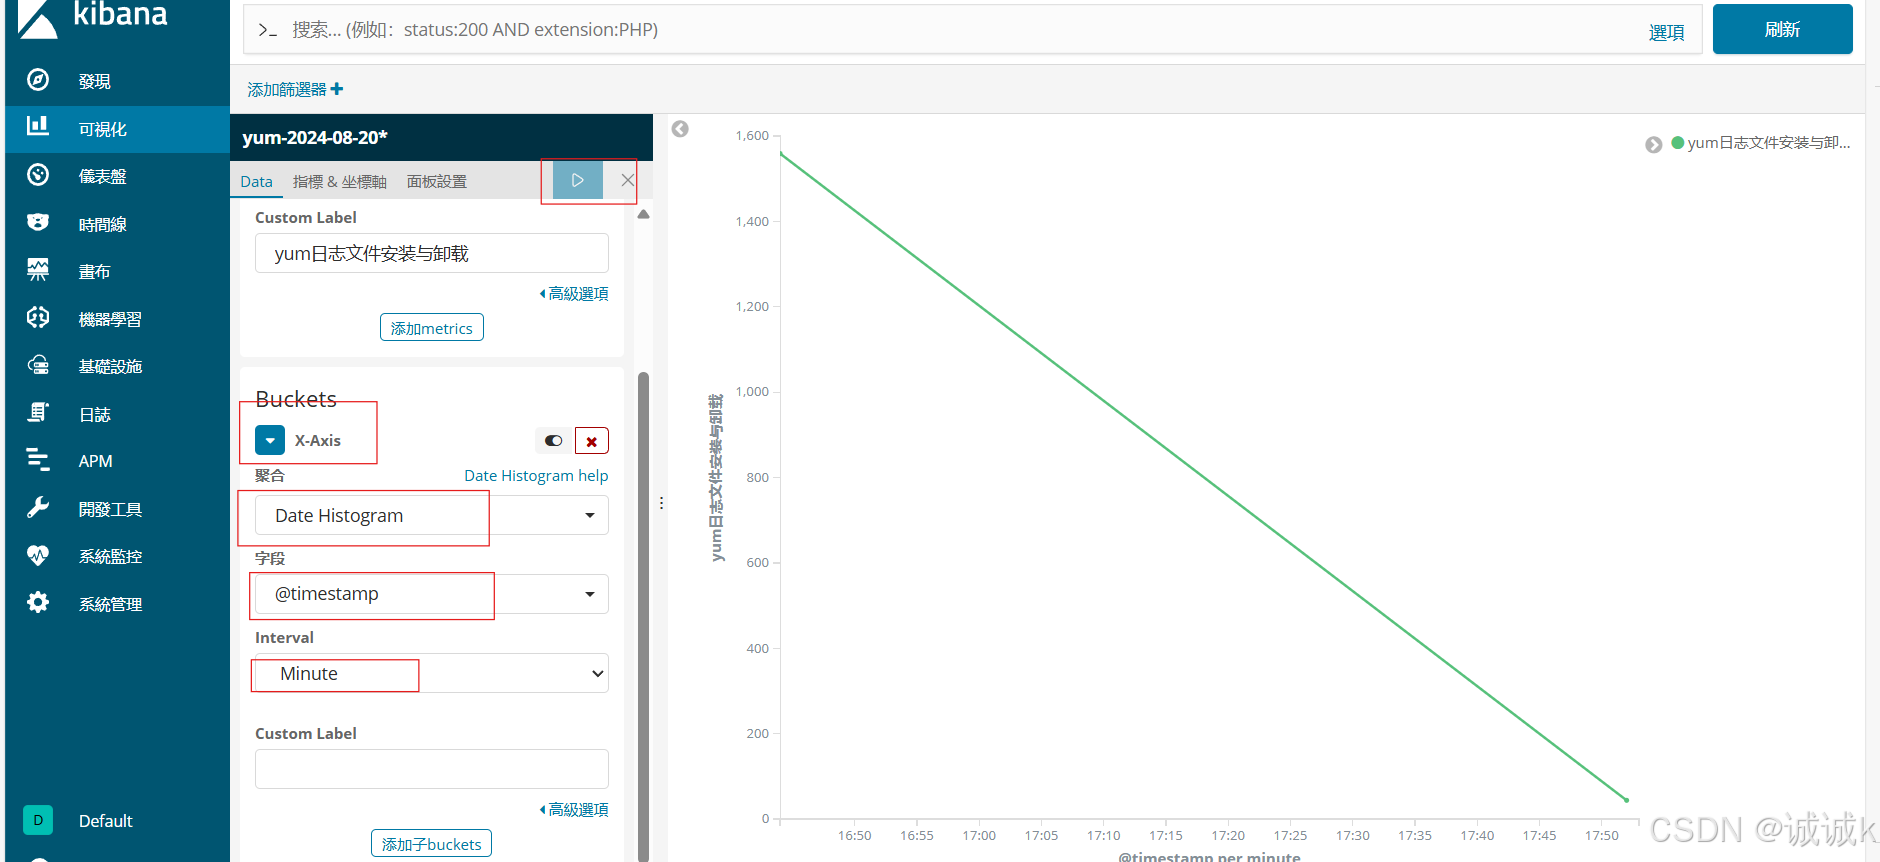
保存
filebeat
因为logstash消耗内存等资源太高,如果在要采集的服务上都安装logstash,这样对应用服务器的压力增 加。所以我们要用轻量级的采集工具才更高效,更省资源。
- beats是轻量级的日志收集处理工具,Beats占用资源少
- Packetbeat: 网络数据(收集网络流量数据)
- Metricbeat: 指标 (收集系统、进程和文件系统级别的 CPU 和内存使用情况等数据)
- Filebeat: 文件(收集日志文件数据)
- Winlogbeat: windows事件日志(收集 Windows 事件日志数据)
- Auditbeat:审计数据 (收集审计日志)
- Heartbeat:运行时间监控 (收集系统运行时的数据)
filebeat可以直接将采集的日志数据传输给ES集群(EFK), 也可以给logstash(5044端口接收)