st.bokeh_chart
显示互动式虚化图。
Bokeh 是 Python 的一个图表库。此函数的参数与 Bokeh 的 show 函数的参数非常接近。有关 Bokeh 的更多信息,请访问 https://bokeh.pydata.org。
要在 Streamlit 中显示 Bokeh 图表,请在调用 Bokeh 的 show 时调用 st.bokeh_chart。
| Function signature[source] | |
|---|---|
| st.bokeh_chart(figure, use_container_width=False) | |
| Parameters | |
| figure (bokeh.plotting.figure.Figure) | A Bokeh figure to plot. |
| use_container_width (bool) | Whether to override the figure's native width with the width of the parent container. If use_container_width is False (default), Streamlit sets the width of the chart to fit its contents according to the plotting library, up to the width of the parent container. If use_container_width is True, Streamlit sets the width of the figure to match the width of the parent container. |
代码
python">import streamlit as st
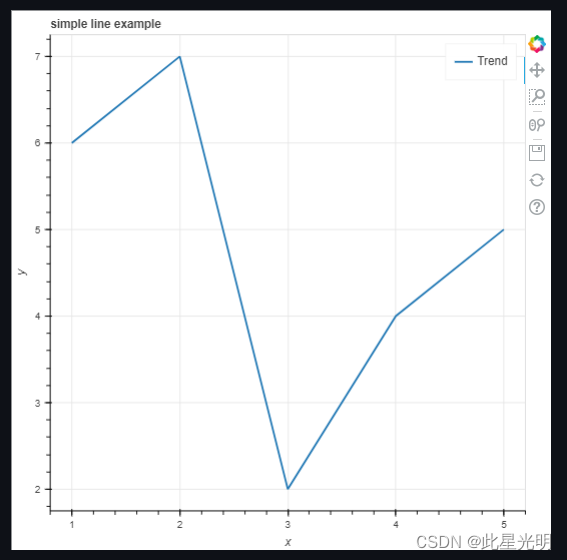
from bokeh.plotting import figurex = [1, 2, 3, 4, 5]
y = [6, 7, 2, 4, 5]p = figure(title='simple line example',x_axis_label='x',y_axis_label='y')p.line(x, y, legend_label='Trend', line_width=2)st.bokeh_chart(p, use_container_width=True)这段代码使用了Streamlit和Bokeh库来创建一个简单的折线图。首先,我们导入了streamlit和bokeh.plotting中的figure模块。然后,我们定义了x和y轴的数据点。接下来,我们创建了一个Bokeh图形对象p,并设置了标题、x轴标签和y轴标签。然后,我们使用p.line()方法在图形对象上绘制了折线,设置了图例标签和线宽。最后,我们使用st.bokeh_chart()方法将图形对象p显示在Streamlit应用程序中,并设置了use_container_width=True以适应容器的宽度。Bokeh
st.graphviz_chart
使用 dagre-d3 库显示图表。
| Function signature[source] | |
|---|---|
| st.graphviz_chart(figure_or_dot, use_container_width=False) | |
| Parameters | |
| figure_or_dot (graphviz.dot.Graph, graphviz.dot.Digraph, str) | The Graphlib graph object or dot string to display |
| use_container_width (bool) | Whether to override the figure's native width with the width of the parent container. If use_container_width is False (default), Streamlit sets the width of the chart to fit its contents according to the plotting library, up to the width of the parent container. If use_container_width is True, Streamlit sets the width of the figure to match the width of the parent container. |
代码
python">import streamlit as st
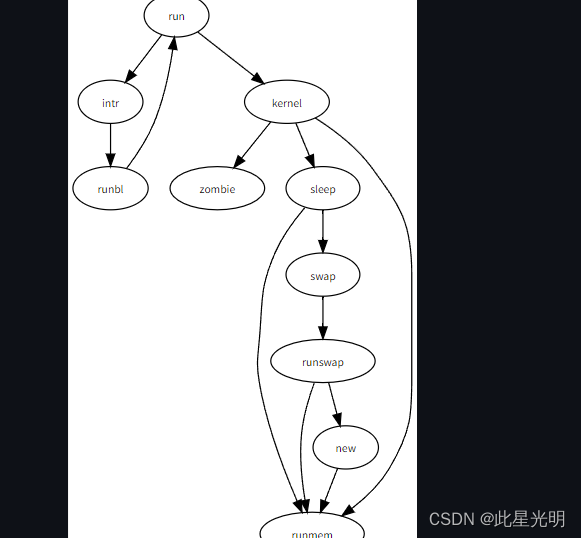
import graphviz# Create a graphlib graph object
graph = graphviz.Digraph()
graph.edge('run', 'intr')
graph.edge('intr', 'runbl')
graph.edge('runbl', 'run')
graph.edge('run', 'kernel')
graph.edge('kernel', 'zombie')
graph.edge('kernel', 'sleep')
graph.edge('kernel', 'runmem')
graph.edge('sleep', 'swap')
graph.edge('swap', 'runswap')
graph.edge('runswap', 'new')
graph.edge('runswap', 'runmem')
graph.edge('new', 'runmem')
graph.edge('sleep', 'runmem')st.graphviz_chart(graph)这段代码使用了Streamlit和Graphviz库。首先,导入了streamlit和graphviz模块。然后创建了一个graphviz的有向图对象graph。接着,通过调用edge方法,向图中添加了一系列的边,构成了一个简单的图形结构。最后,使用st.graphviz_chart方法将图形显示在Streamlit应用程序中。整体来说,这段代码的作用是创建一个简单的有向图并在Streamlit应用程序中展示出来。或者,您也可以使用 GraphViz 的 Dot 语言从图形中渲染图表:
python">st.graphviz_chart('''digraph {run -> intrintr -> runblrunbl -> runrun -> kernelkernel -> zombiekernel -> sleepkernel -> runmemsleep -> swapswap -> runswaprunswap -> newrunswap -> runmemnew -> runmemsleep -> runmem}
''')
st.plotly_chart
显示交互式 Plotly 图表。
Plotly 是 Python 的图表库。该函数的参数与 Plotly 的 plot() 函数的参数非常接近。
要在 Streamlit 中显示 Plotly 图表,请在调用 Plotly 的 py.plot 或 py.iplot 时调用 st.plotly_chart。
| Function signature[source] | |
|---|---|
| st.plotly_chart(figure_or_data, use_container_width=False, *, theme="streamlit", key=None, on_select="ignore", selection_mode=('points', 'box', 'lasso'), **kwargs) | |
| Returns | |
| (element or dict) | If on_select is "ignore" (default), this method returns an internal placeholder for the chart element. Otherwise, this method returns a dictionary-like object that supports both key and attribute notation. The attributes are described by the PlotlyState dictionary schema. |
| Parameters | |
| figure_or_data (plotly.graph_objs.Figure, plotly.graph_objs.Data, or dict/list of plotly.graph_objs.Figure/Data) | The Plotly Figure or Data object to render. See Plotly Python Graphing Library for examples of graph descriptions. |
| use_container_width (bool) | Whether to override the figure's native width with the width of the parent container. If use_container_width is False (default), Streamlit sets the width of the chart to fit its contents according to the plotting library, up to the width of the parent container. If use_container_width is True, Streamlit sets the width of the figure to match the width of the parent container. |
| theme ("streamlit" or None) | The theme of the chart. If theme is "streamlit" (default), Streamlit uses its own design default. If theme is None, Streamlit falls back to the default behavior of the library. |
| key (str) | An optional string to use for giving this element a stable identity. If key is None (default), this element's ide |