IELTS优秀小作文分享
柱状图
本篇范文个人评分是8分或者8.5分,属于能找到的最优质的范文了
题目如下:

The two sets of bar charts illustrate the amount of time that teenagers (boys, girls, and all) in the UK spend chatting online and playing game consoles on a typical school day.
The first set of data shows the behavioral patterns of chatting on the internet: on average, about 25% of teenager students, including both boys and girls, spend less than one hour, around 30% between one to three, and approximately 6% more than four hours. As for the two gender groups, while a slightly larger proportion of girls tend to spend more daily time chatting online, the data are still comparable to that of the boys.
In comparison, game consoles is a totally different story as the behavioral pattens are significantly different between the two gender groups. About 30% of the boys and more than a third of the girls spend less than one hour on games, while almost half of the boys and only 12% of girls spend between one to three hours. Last but not least, 10% of the boys and almost no girls spend more than four hours of their daily time on games. It is also worth noticing that the “All” group simply reflects the average of the two genders but does not seem to be an accurate representation of either.
In conclusion, boys and girls behave slightly differently when chatting online, but significantly differently when it comes to playing game consoles.
表格
剑桥雅思7的Test 1里的小作文

这一篇是Simon书里的范文, 我稍微做了点改变, 他说他的范文能得9分, 但我感觉这样的文章放到考试最多7.5, 大概率6.5/7
The table shows percentages of consumer expenditure for three categories of products and services in five countries in 2002.
It is clear that the largest proportion of consumer spending in each country went on food, drinks and tobacco. On the other hand, the leisure/education category has the lowest percentages in the table.
Among the five countries, consumer spending on food, drinks and tobacco was noticeably the highest in Turkey, at 32.14% and Ireland spent the second highest amount, less than 30%. The proportion of spending on leisure and education was also highest in Turkey, at 4.35%, while expenditure on clothing and footwear was significantly higher in Italy, at 9%, than in any of the other countries.
It can be seen that Sweden had the lowest percentage of national consumer expenditure for food/drinks/tobacco and for clothing/footwear, at nearly 16% and just over 5% respectively. Spain had slightly higher figures for these categories, but the lowest figure for leisure/education, at only 1.98%.
这篇的思路是从类别来分析,上面那篇从国家来分析,视角不同,这篇大约6/6.5
The table compares 5 distinctive countries with regard to their citizens’ expenditure on Food/Drinks/Tobacco, Clothing/Footwear and Leisure/ Education in the year of 2002.
Overall, it can be seen that consumers in the five nations spent more on Food/Drinks/Tobacco than the other categories. It is also noticeable that Leisure/ Education took up the least proportion in 2002.
In terms of the expenditure on Food/Drinks/Tobacco, Turkish consumers ranked the first with a percentage of 32.14% in 2002, followed by individuals from Ireland (28.91%) and Spain (18.80%). By contrast, citizens in Italy and Sweden spent less money on this category, respectively 16.36% and 15.77%.
When it comes to Clothing/Footwear, the figure for Italy was 9%, significantly higher than its counterparts, which represented merely around 6%. Moreover, the spending on Leisure/ Education accounted for the least percentage in these categories. The largest amount, namely 4.35% could be found for Turkey, which was more than twice as high as the figure for Spain(1.98%). The rate of Sweden, Italy and Ireland lied separately in 3.22%, 3.20% and 2.21%.
饼图
C14 Test 1,个人觉得这篇写得非常标准,所以应该有6.5-7.0的水准吧
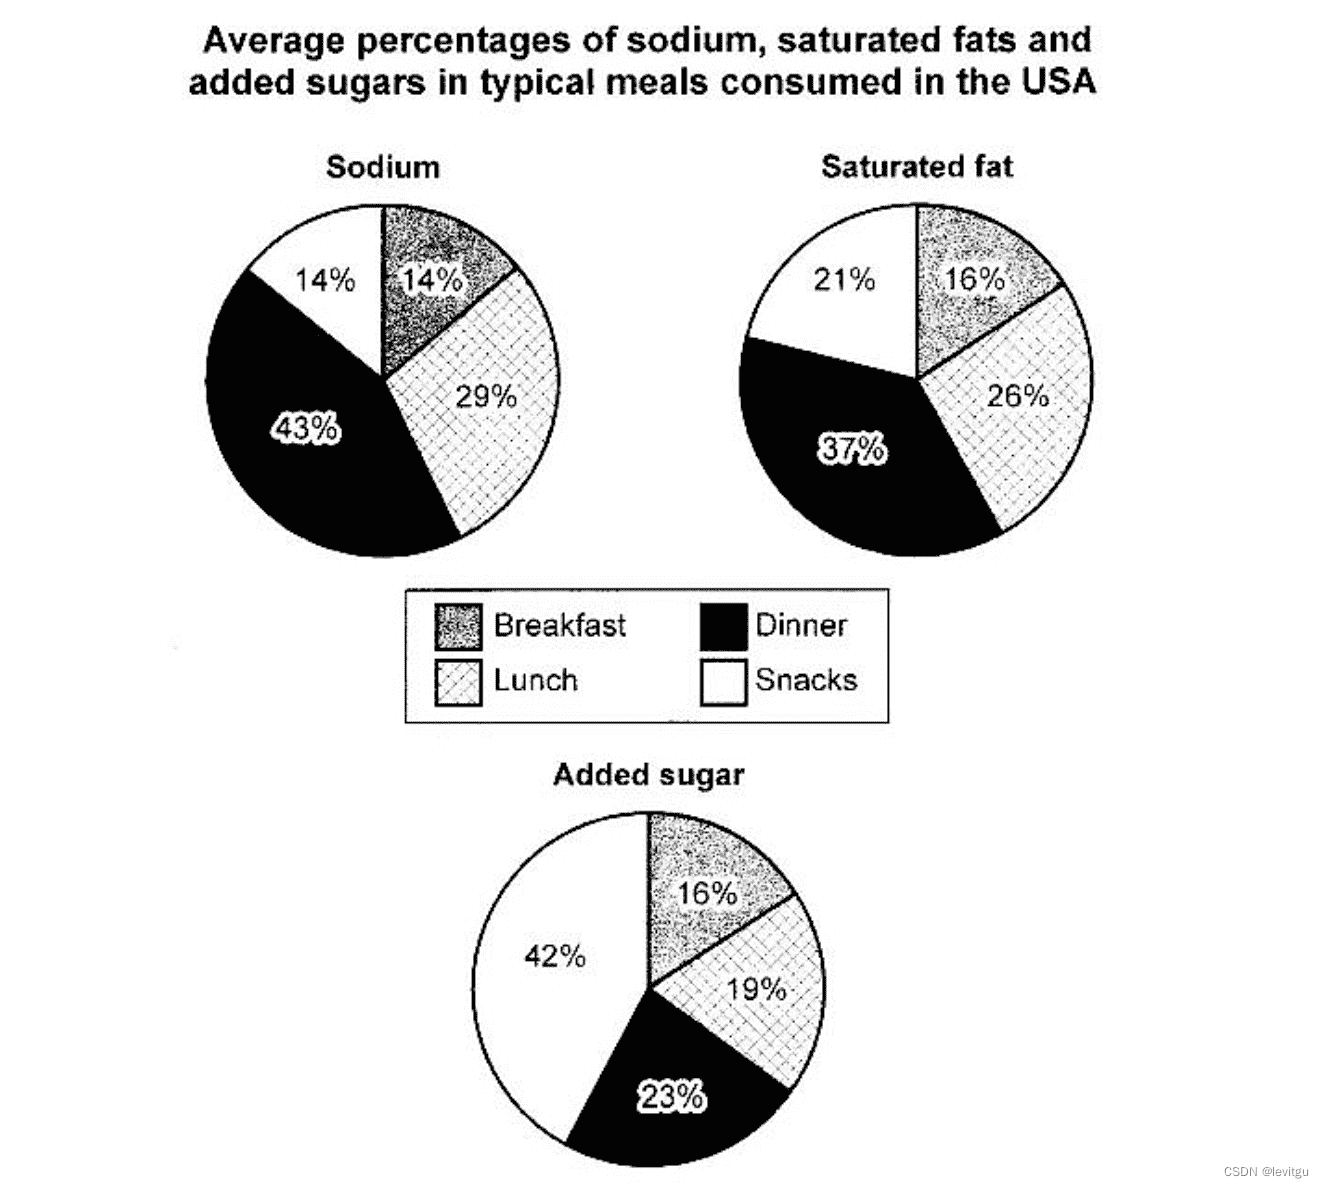
The pie charts compare three types of nutrients, namely sodium, saturated fat and added sugar with regard to their average proportions in Americans’ meals.
Overall, it can be seen that breakfast contains the lowest rate of all the three nutrients. It is also noticeable that dinner occupies the highest rate of both sodium and saturated fat, while snacks contain more added sugar than their counterparts.
In terms of sodium and saturated fat, dinner makes up the highest percentage (43% and 37% respectively) and by contrast, the figure for breakfast remains the lowest being 14% and 16% separately. Apart from that, snacks also contain the lowest proportion of sodium as breakfast both representing 14% but its percentage of saturated fat reaches 21%.
When it comes to added sugar, snacks make up the largest proportion of 42%, followed by dinner and lunch (23% and 19% for each). In breakfast, individuals in the USA take in the lowest amount of added sugar, accounting for only 16% among three meals and snacks.
柱状图
分数应该是8分
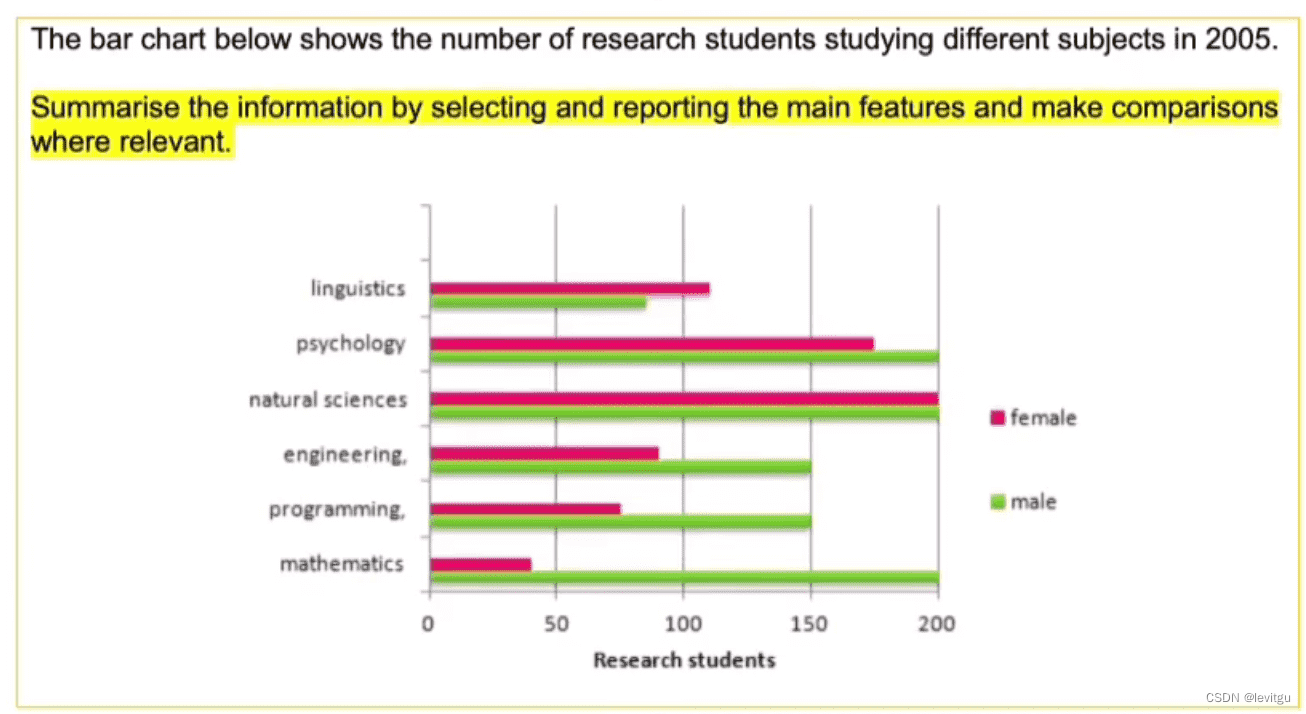
The bar chat presents the number of research students, divided by gender, who pursed different subjects in 2005. These subjects included linguistics, psychology, natural sciences, engineering, programming and mathematics.
Overall, there were more male than female research student in the given year. Among all subjects, male students had a higher enrollment than female students except for linguistics. Although both genders took a strong interset in psychology and natural sciences, two of the most popular subjects, men least preferred linguists and women mathematics.
Female and male students showed a more or less similar interest in linguistics, psychology and natural sciences. In particular, natural sciences was the most popular of all, showing the same enrollment number of 200. Through very popular, psychology was favored more by men (200) than women (around 170). In linguistics, the situation was the reverse, with more women than men.
However, female and male students showed significant differences in engineering, programming and mathematics. In all three subject, male domiance was obvious, especially in mathematics, which was taken by 200 males students and only 40 female students in engineering and programming, the number of female syudents was roughly half of that of male.
折线图
8分左右
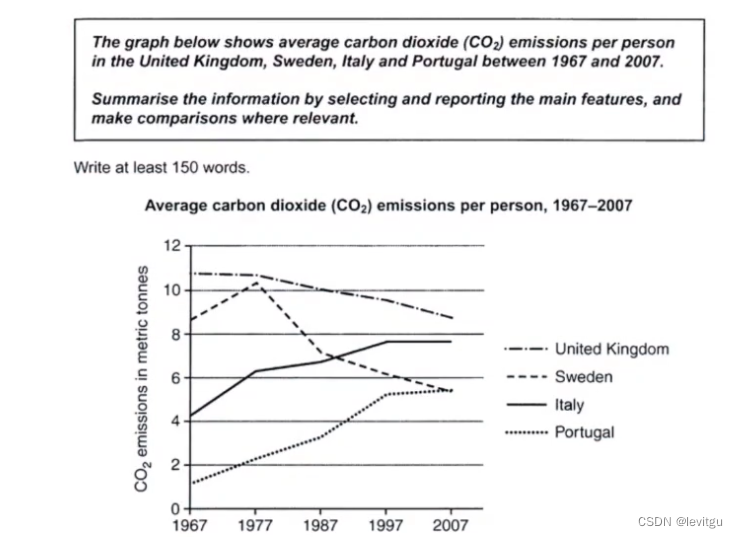
The line chart illustrates avrage carbon dioxide (CO2) emissions per capita in the UK, Sweden, Italy and Portugal over 40 years from 1967 to 2007. Units were measured in metric tonnes.
On the whole, the UK and Sweden showed a general decreasing trend in terms of CO2 emissions while Italy and Portugal both witnessed a stedy rising trend. Throughout this prise, the UK had the highest CO2 emissions, while Portugal remained the lowest.
In 1967, the highest CO2 emission were in the UK, at around 11, following by Sweden at appromately 9. Italy and Portugal had relatively lower emissions, at around 4 and 1 respectively. Around 1987, CO2 emissions per capita in the UK steadily droped to 10, still being the highest. In Sweden, despite the short initial increse to above 10, CO2 emissions later dropped to around 7, which was the same as those in Italy, whichh had witnessed an increase. At the same time, the average emissions of CO2 climbed to arround 3 in Portugal, remaining the lowest.
In2007, CO2 emissions continued falling in the UK, now at around 9, albeit still the highest among the four countries. Co2 emissions in Italy had been the second highest. The falling trend of CO2 emissions in Sweden continued, meeting those in Portugal at around 5.
地图
C18T3 6.5+的分数
From the two diagrams provided, we can observe the changes in room layouts at the Central Library over a period of twenty years. In the past 20 years, there have been not only changes in regional functions, but also fundamental adjustments in layout.
Firstly, the room located in the top-left corner has increased in size. Previously, this room was arranged for CDs, videos and computer games, but nowadays, it is furnished with children’s fiction books. Moreover, there are two sofas, which could provide a comfortable space for holding storytelling activities. The room in the bottom-left corner used to be a space for people to read newspapers and magazines. Nowadays, it is a computer room. Additionally, its door orientation has also been changed. In the middle area, the category of books has changed from adult fiction books to reference books.
Next, regarding the room in the top-right corner, previously it stored children’s books. However, this function has been replaced by the room on the left and it serves as a lecture room currently. The area in the bottom-right corner was previously an enquiry desk, which provides services related to tickets, book returns and so forth, but now it has been transformed into a Cafe. In the area between those two areas mentioned above, adult fiction books, information desk and self-service machines have replaced adult non-fiction books in the past.
Finally, in terms of the central area, it previously contained tables and chairs, providing convenience for people to read. However, they have now been removed, making the library appear more spacious.
流程图
C16T2 7分
The diagram sheds light on how sugar is manufactured from sugar canes.
Overall, it can be seen that the whole process consists of 7 steps, from the initial growing stage to the eventual drying and cooling stage.
The first step begins with growing sugar canes, which lasts for 12 to 18 months and is the longest stage in the whole process. Subsequently, the mature sugar canes are harvested in two means, either by hand or with the help of specialized vehicles and after that, these sugar canes are crushed into juice by certain professional machine.
The fourth step involves the purification of the juice utilizing limestone filters. Afterwards the purified juice is evaporated thanks to the heat under the machine and converts into syrup. In the next stage, sugar crystals are separated from syrup, after which these crystals are dried and cooled and eventually, sugar is produced from sugar canes.
欢迎大家访问我的个人博客www.levitategu.cn